

Melting Curve Analysis with Exponential Background Subtraction
a technology of melting curve and background subtraction, applied in the field of nuclear acid melting curve analysis, can solve the problems of amplified wild type sequences, limited common variants, and inability to sequence,
- Summary
- Abstract
- Description
- Claims
- Application Information
AI Technical Summary
Benefits of technology
Problems solved by technology
Method used
Image

Examples
example 1
Hemochromatosis (HFE) Mutation and Polymorphism Genotyping
[0069]Hemochromatosis gene mutations and polymorphisms are known to interfere with normal iron metabolism in Humans. In this illustrative example, detection and identification of polymorphism and mutation genotypes through melting curve analysis is more accurate with exponential background subtraction then baseline background subtraction. Analysis was performed with small amplicons (78 bp and 40 bp) in order to increase the Tm difference between different homozygote samples. Unlabeled probes are utilized for genotyping SNPs that otherwise could not be easily genotyped by amplicon melting.
[0070]Human genomic DNA representing distinct hemochromatosis genotypes can be amplified by various PCR instruments. An exemplary method includes 10 μl reaction volumes with a Roche LightCycler® 2.0. Following PCR amplification, the HFE samples are heated in an HR-1 (Idaho Technology) melting instrument for approximately 115 seconds. The resu...
example 2
Factor V Leiden (384 Well Plate) Derivative Clustering Combined Probe and Amplicon
[0071]Factor V Leiden is the most common hereditary blood coagulation disorder in the United States. It is present in approximately 5% of the Caucasian population and approximately 1.2% of the African American population. Factor V Leiden as a gene target is important for the detection of SNPs that are linked to coagulation disorder disposition.
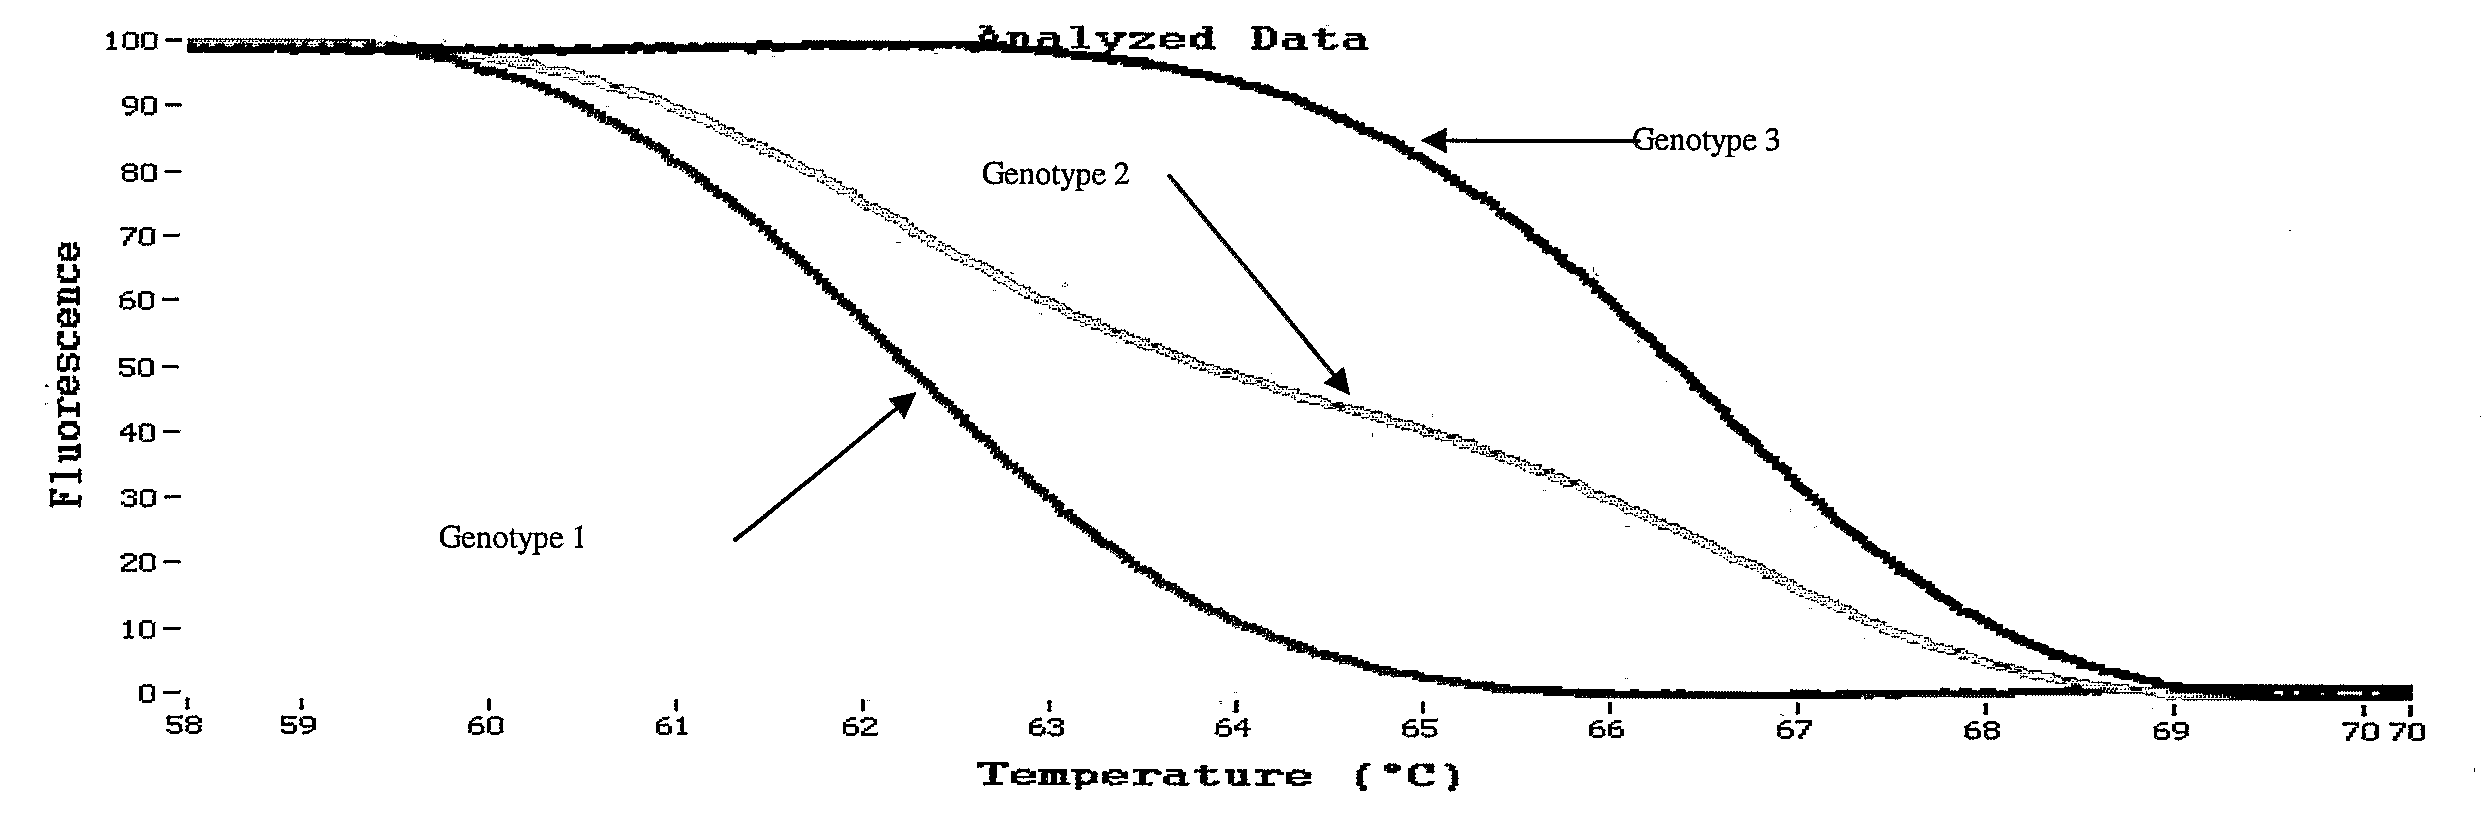
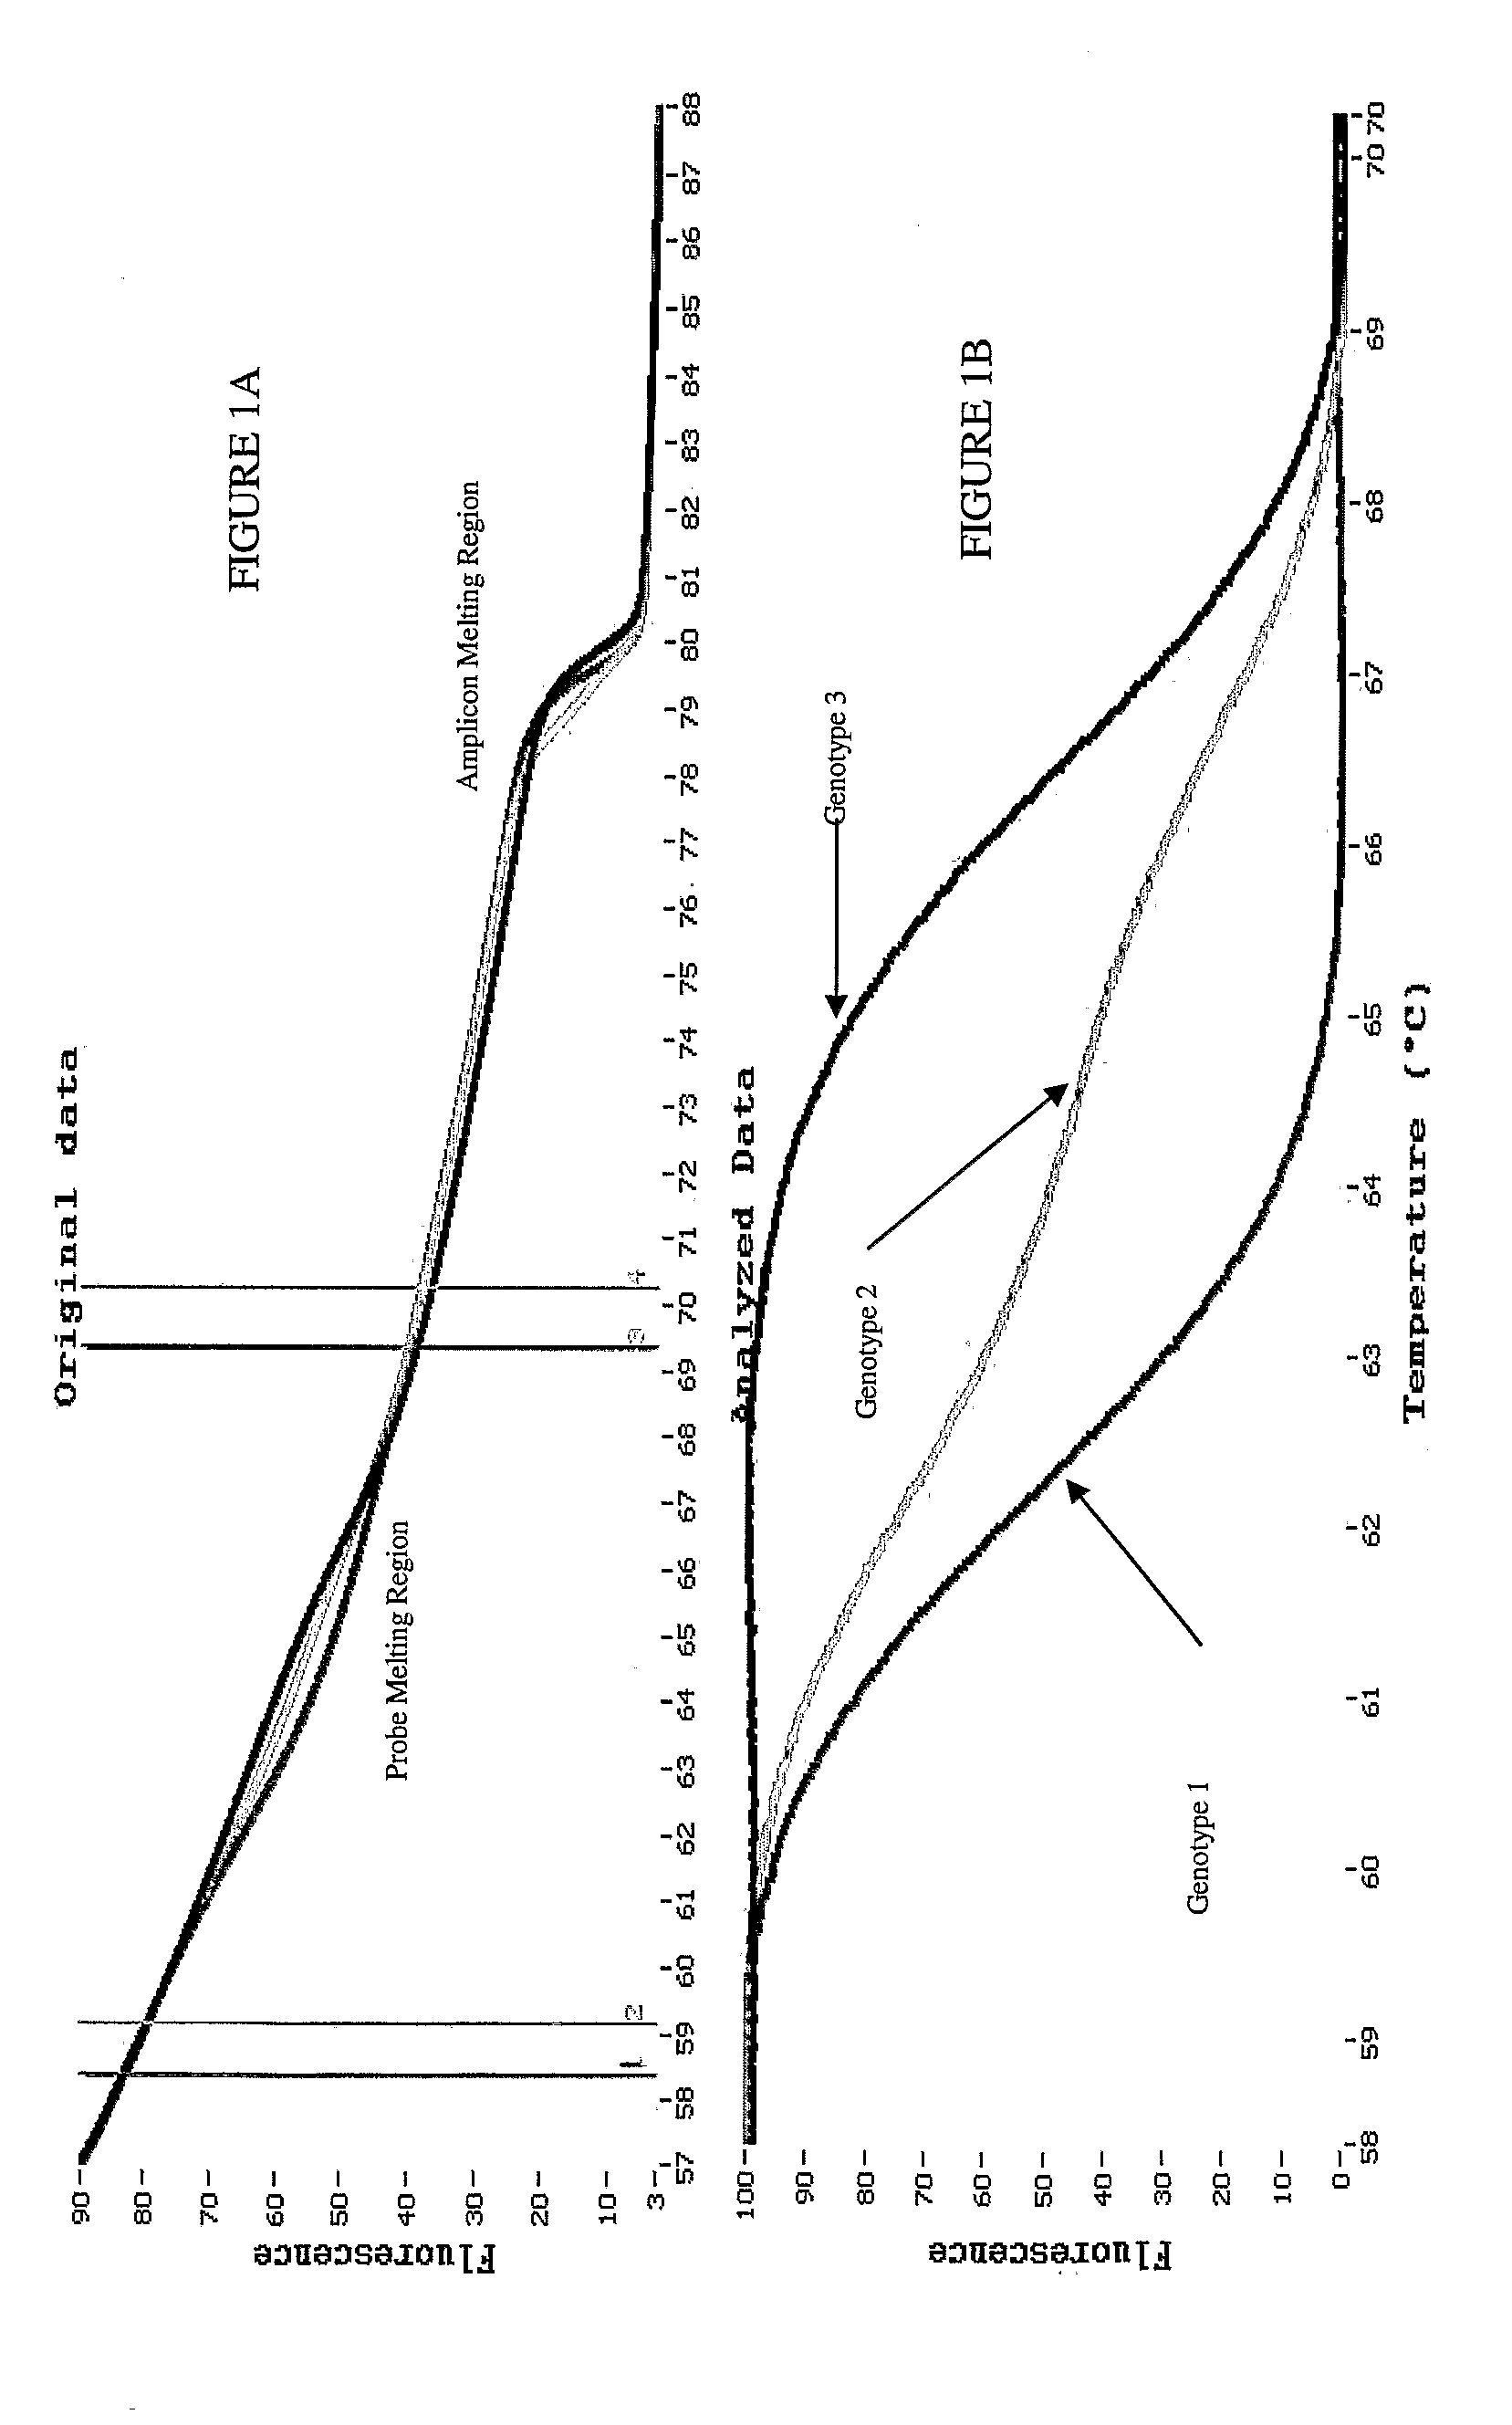
[0072]Human Factor V Leiden genomic DNA samples representing different Factor V Leiden genotypes were amplified in an ABI 9700 with 10 μl reaction volume and 12 μl oil overlay. The assay included a Factor V Leiden amplicon of approximately 100 bp having a sequence of 5′-CTGAAAGGTTACTTCAAGGACAAAATACCTGTATTCCTCGCCTGTCCAGGG ATCTGCTCTTACAGATTAGAAGTAGTCCTATTAGCCCAGAGGCGATGTC-3′ (SEQ. ID NO:1), which was amplified by forward primer 5′-CTGAAAGGTTACTTCAAGGAC-′3 (SEQ. ID NO:2) and reverse primer 5′-GACATCGCCTCTGGG-3′ (SEQ. ID NO:3). The assay also included an unlabeled pr...
example 3
Factor V Leiden (96 Well Plate) Derivative Clustering of Probe Only
[0076]Human Factor V Leiden genomic DNA samples representing different Factor V Leiden genotypes were amplified in an ABI 9700 with 10 μl reaction volume and 12 μl oil overlay. The assay included a Factor V Leiden amplicon and an unlabeled probe, as described above in Example 2, in the presence of 1X LCGreen Plus®. The resultant PCR samples were heated from 58° C. to 88° C. at 0.1° C. / s in a LightScanner melting instrument using a 96 well reaction plate. The total melting procedure required approximately 5 minutes for completion.
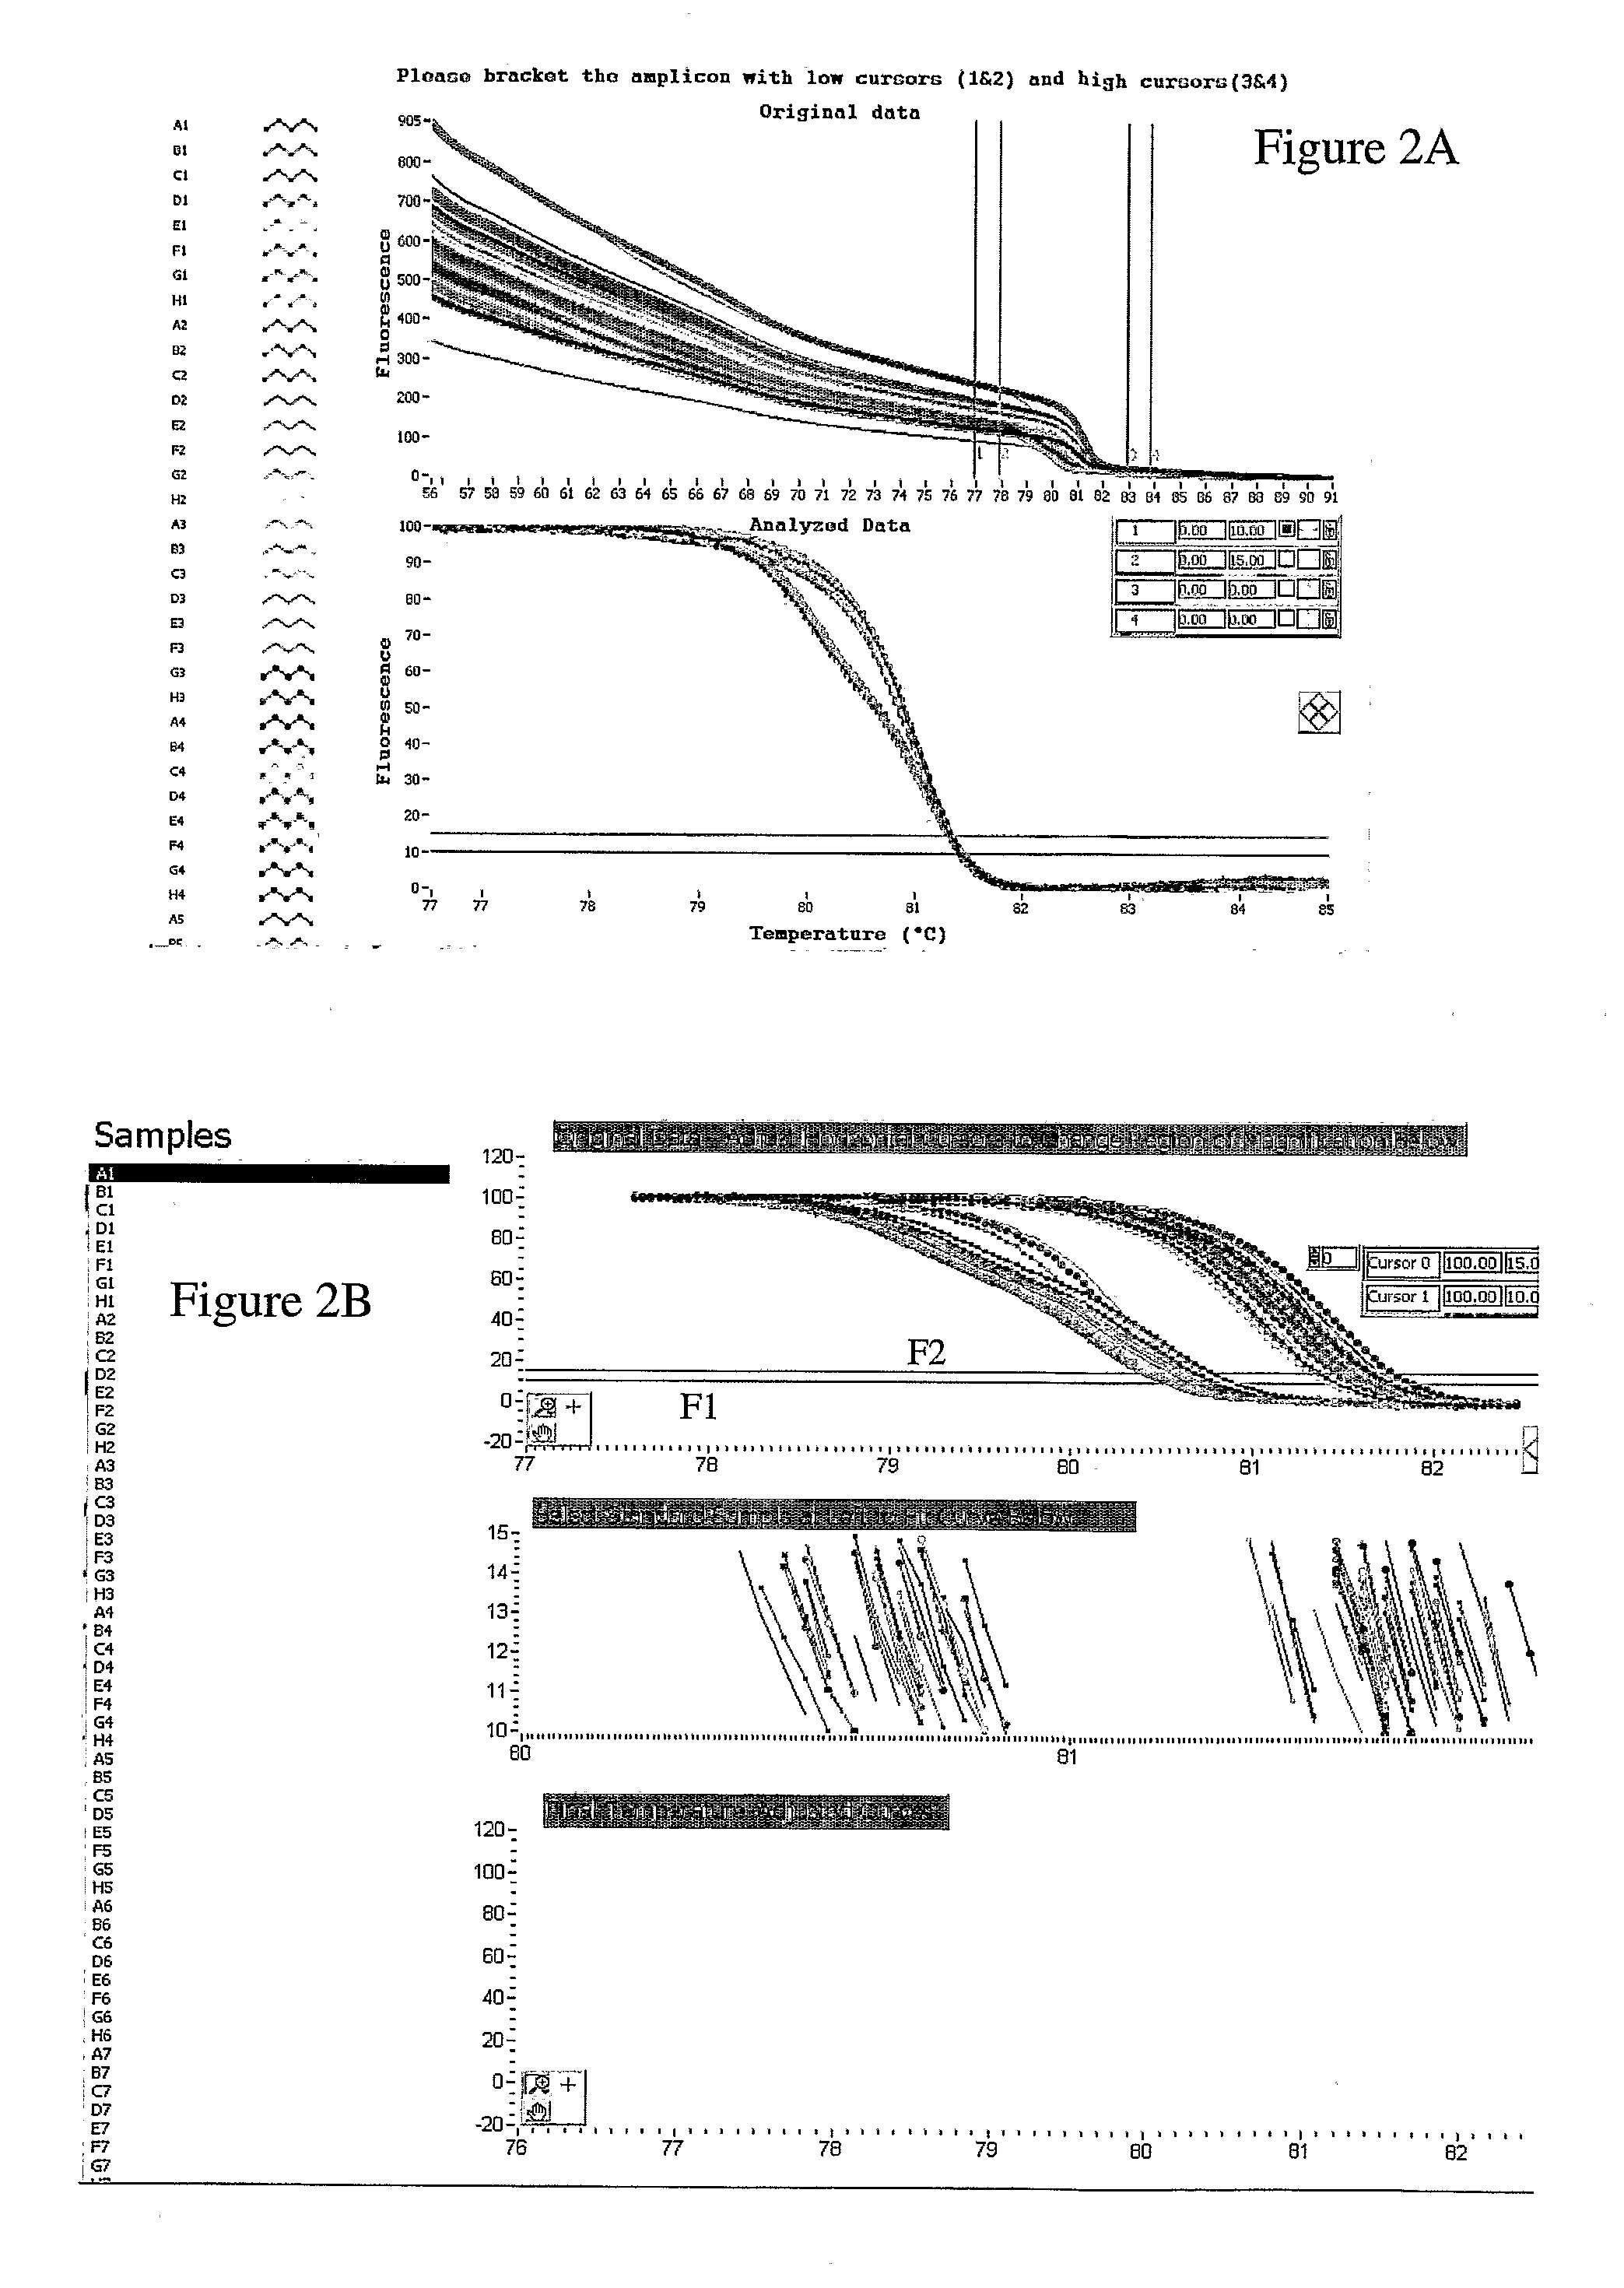
[0077]The LightScanner melting instrument measured and recorded the fluorescence as a function of temperature. The raw melting curve result of the procedure is shown in FIG. 6A. A negative derivative plot as a function of temperature was performed from the melting curve data of FIG. 6A and is shown in FIG. 6B. Two sets of vertical cursor lines are present at approximately 59° C. and 60° C., a...
PUM
| Property | Measurement | Unit |
|---|---|---|
| Temperature | aaaaa | aaaaa |
| Distance | aaaaa | aaaaa |
| Melting point | aaaaa | aaaaa |
Abstract
Description
Claims
Application Information