
Method and Apparatus for Spectral Deconvolution of Detector Spectra

a detector and spectral deconvolution technology, applied in the direction of material analysis using wave/particle radiation, x/gamma/cosmic radiation measurement, instruments, etc., can solve the problem of fifty-year-old problem of spectral deconvolution of nai(t1) scintillation detectors, enormous task of portal monitoring, etc., to achieve improved calibration functions, precise method of calibrating detectors, and improved accuracy

Inactive Publication Date: 2010-12-02
UNIV OF FLORIDA RES FOUNDATION INC
View PDF24 Cites 26 Cited by
  • Summary
  • Abstract
  • Description
  • Claims
  • Application Information

AI Technical Summary

Benefits of technology

[0014]Embodiments of the invention relate to a method and apparatus that can incorporate an advanced synthetically enhanced detector resolution algorithm (ASEDRA). The algorithm can utilize a method for identifying photopeaks, based on recognizing local maxima in a detector spectrum. For each identified photopeak, a corresponding detector response function is subtracted from the detector spectrum, revealing previously hidden photopeaks so that highly overlapping photopeaks can be separated. Despite its simplicity, embodiments of the subject method incorporating ASEDRA have demonstrated a capability for deconvolving intricate detector spectra.
[0016]Embodiments of the advanced synthetically enhanced detector resolution algorithm (ASEDRA) can analyze detector spectra based on the actual physics and a simple heuristic algorithm, without using any information about nuclides of interest. Additionally, embodiments of ASEDRA can provide very fast spectral post-processing, suitable for real-time applications.
[0021]Detector response function generation provides a very precise method for calibrating detectors. A synthetically generated spectrum, based on an estimate of the calibration functions (both energy and resolution), can be overlaid on a measured calibration spectrum for comparison. Even slight differences between the two spectra are easily visible and suggest improvements to the calibration functions. This process can be repeated until a close match between synthetic and measured spectra indicates that calibration is finished.

Problems solved by technology

Portal monitoring is an enormous task, requiring accurate nuclide identification.
Currently available sodium iodide (NaI) scintillators meet most of these requirements, but do not provide sufficient energy resolution.
Spectral deconvolution for NaI(T1) scintillation detectors is a fifty-year-old problem.
While NaI detectors are rugged, portable, relatively inexpensive, and have high detection efficiencies, their poor energy resolution complicates photopeak identification.
While the maximum likelihood method does an excellent job at identifying and characterizing photopeaks, this method is also very computationally intensive [5].

Method used


Image

  • Method and Apparatus for Spectral Deconvolution of Detector Spectra
  • Method and Apparatus for Spectral Deconvolution of Detector Spectra
  • Method and Apparatus for Spectral Deconvolution of Detector Spectra

Examples


example 1

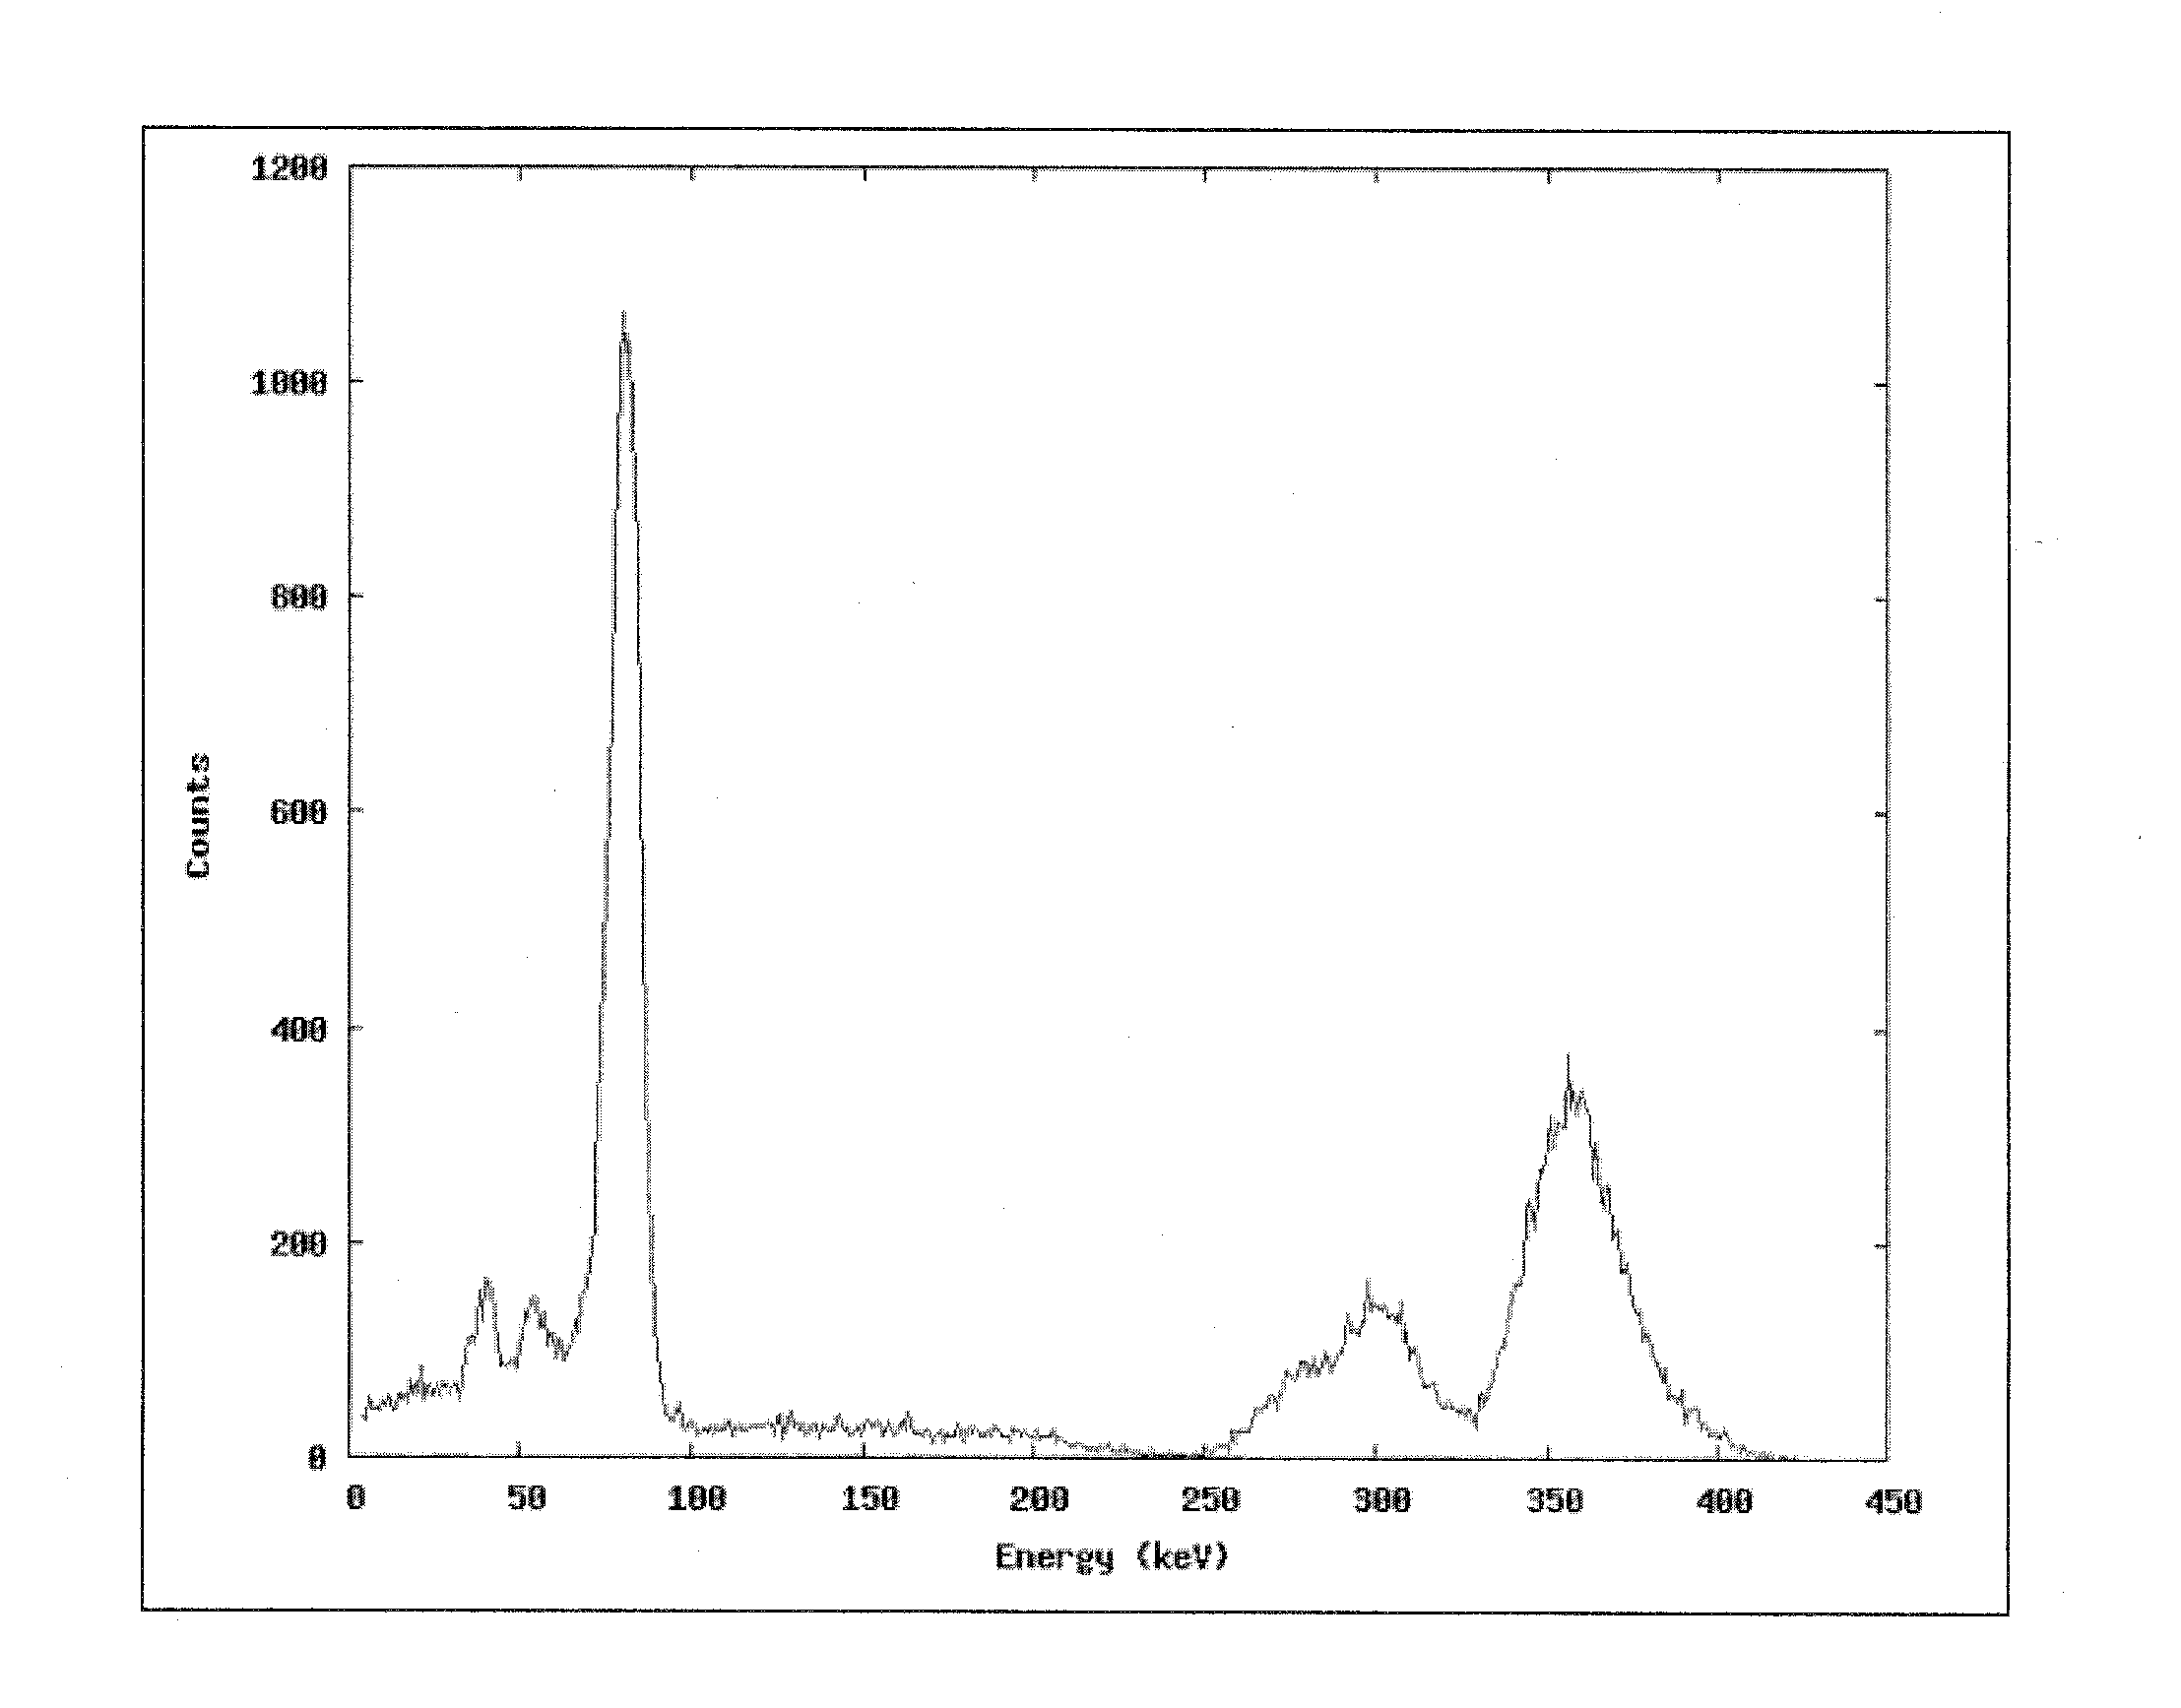
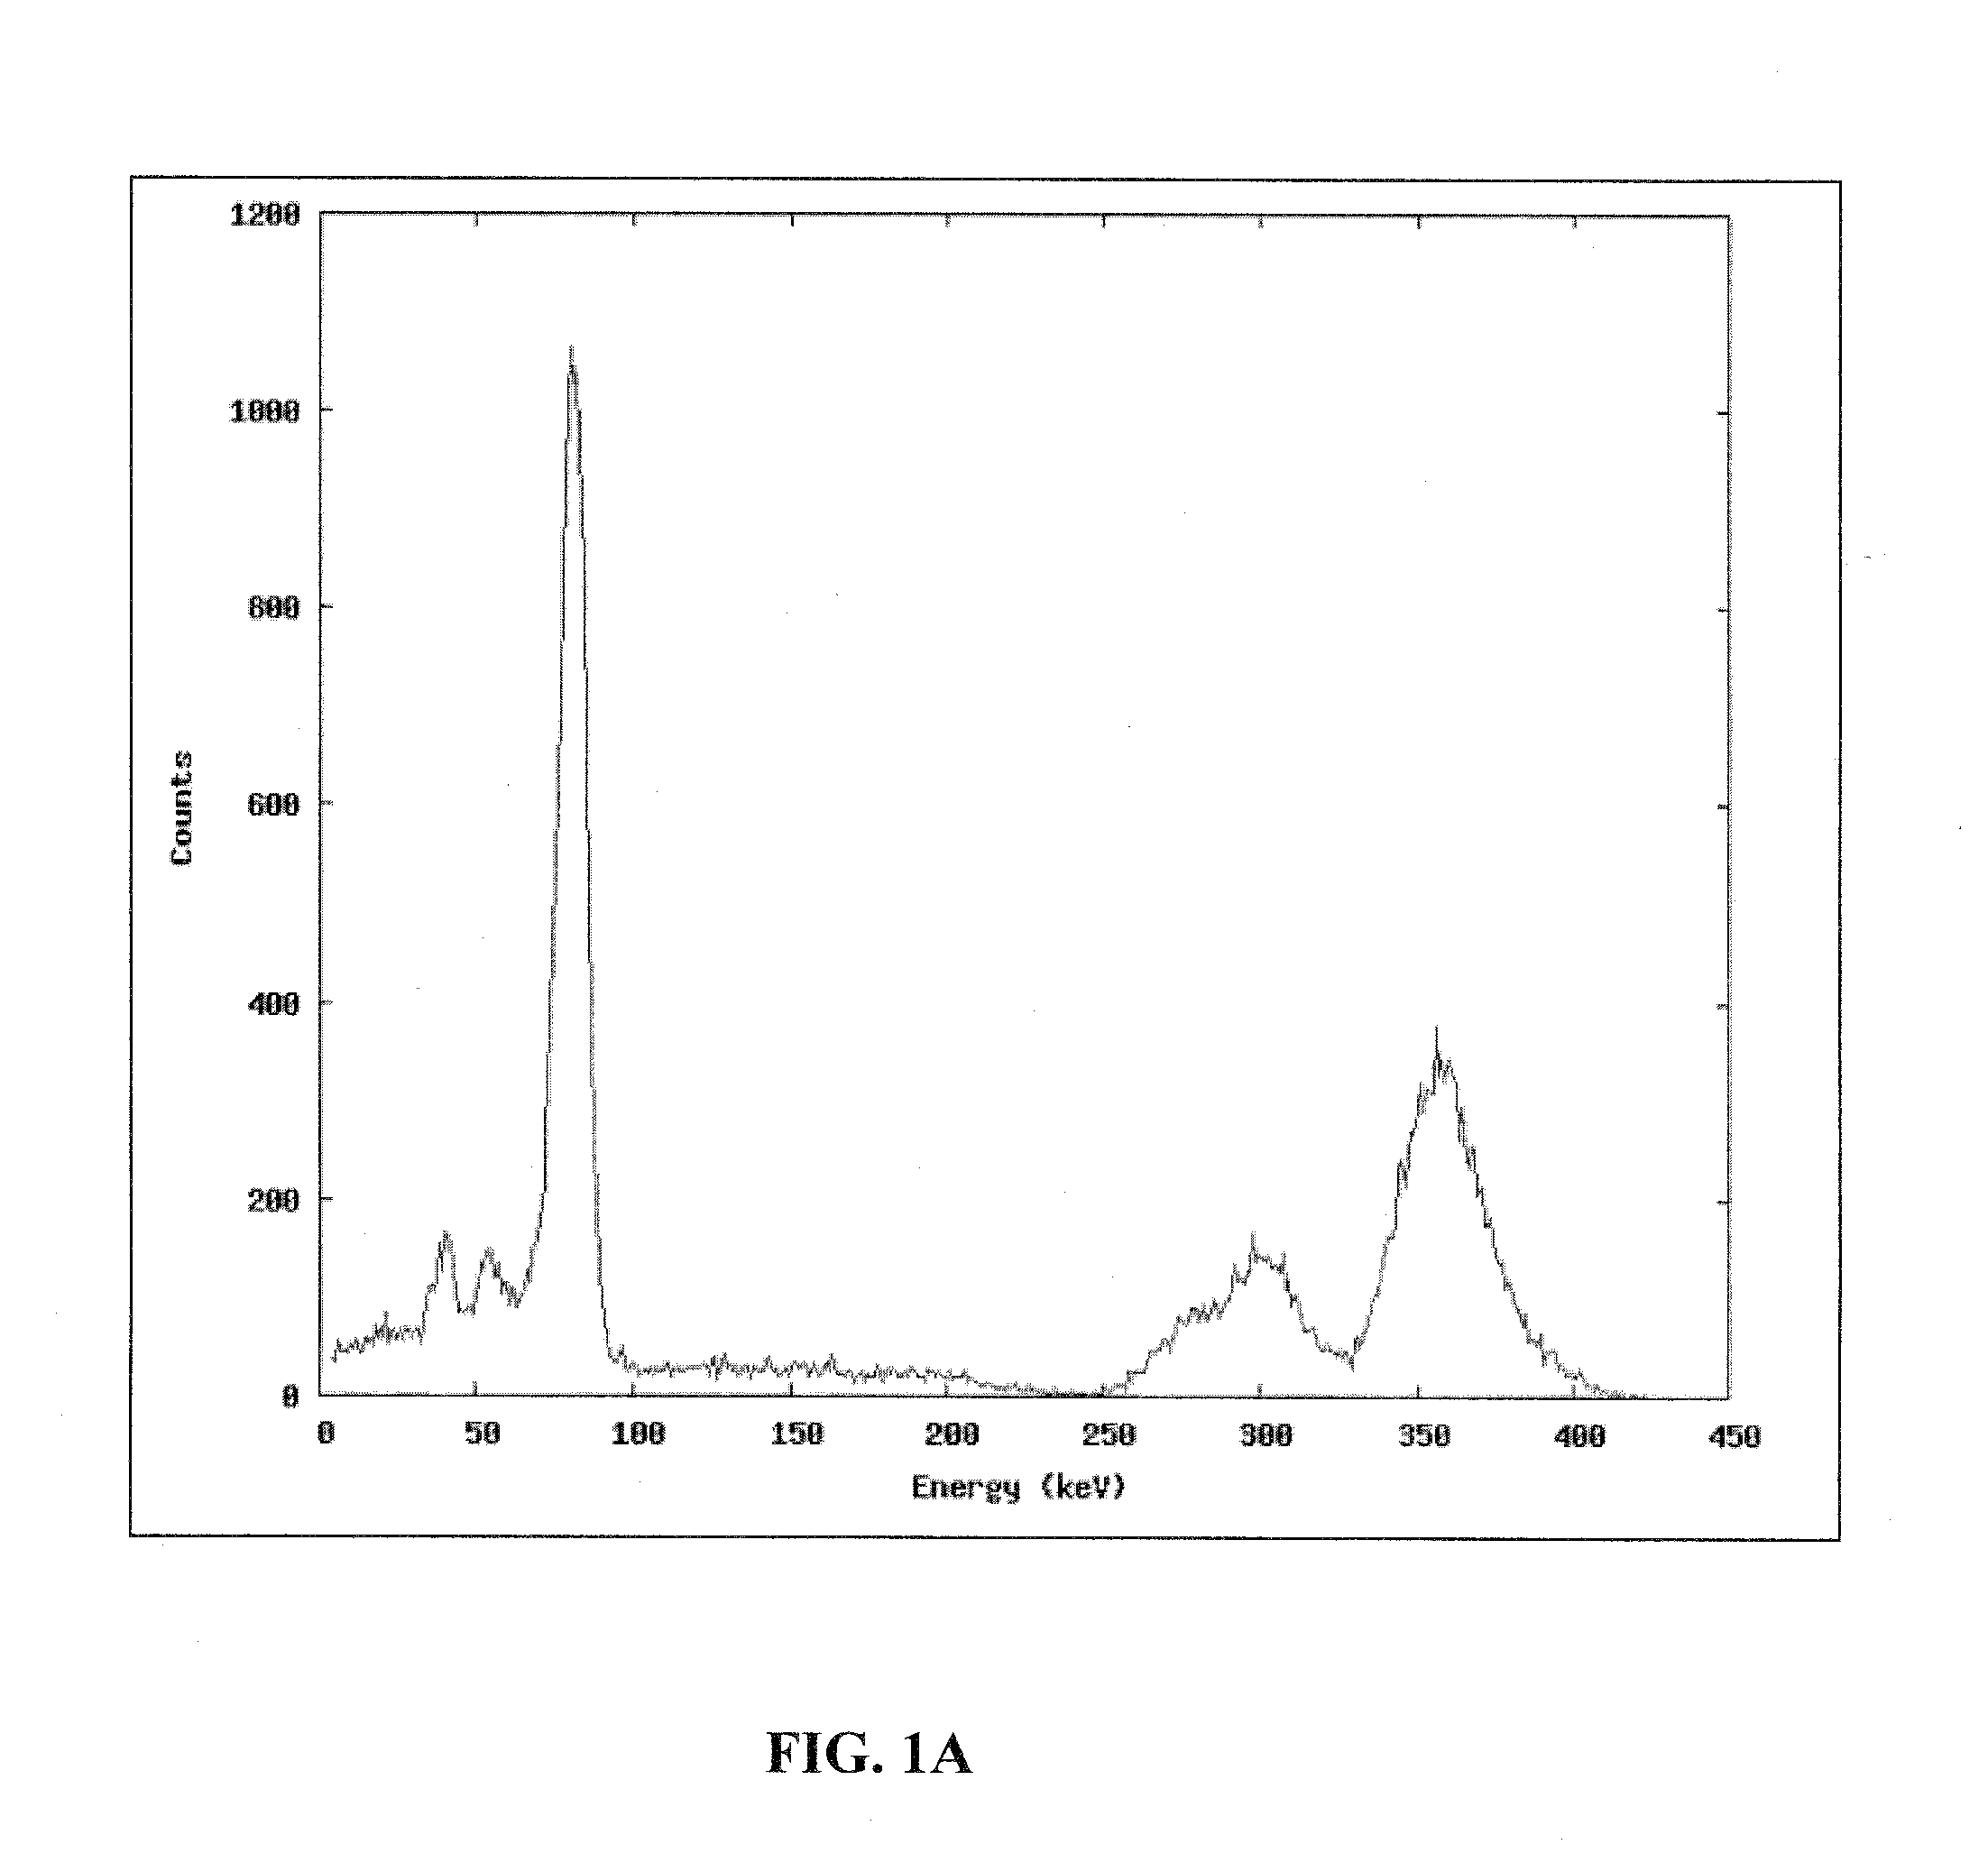
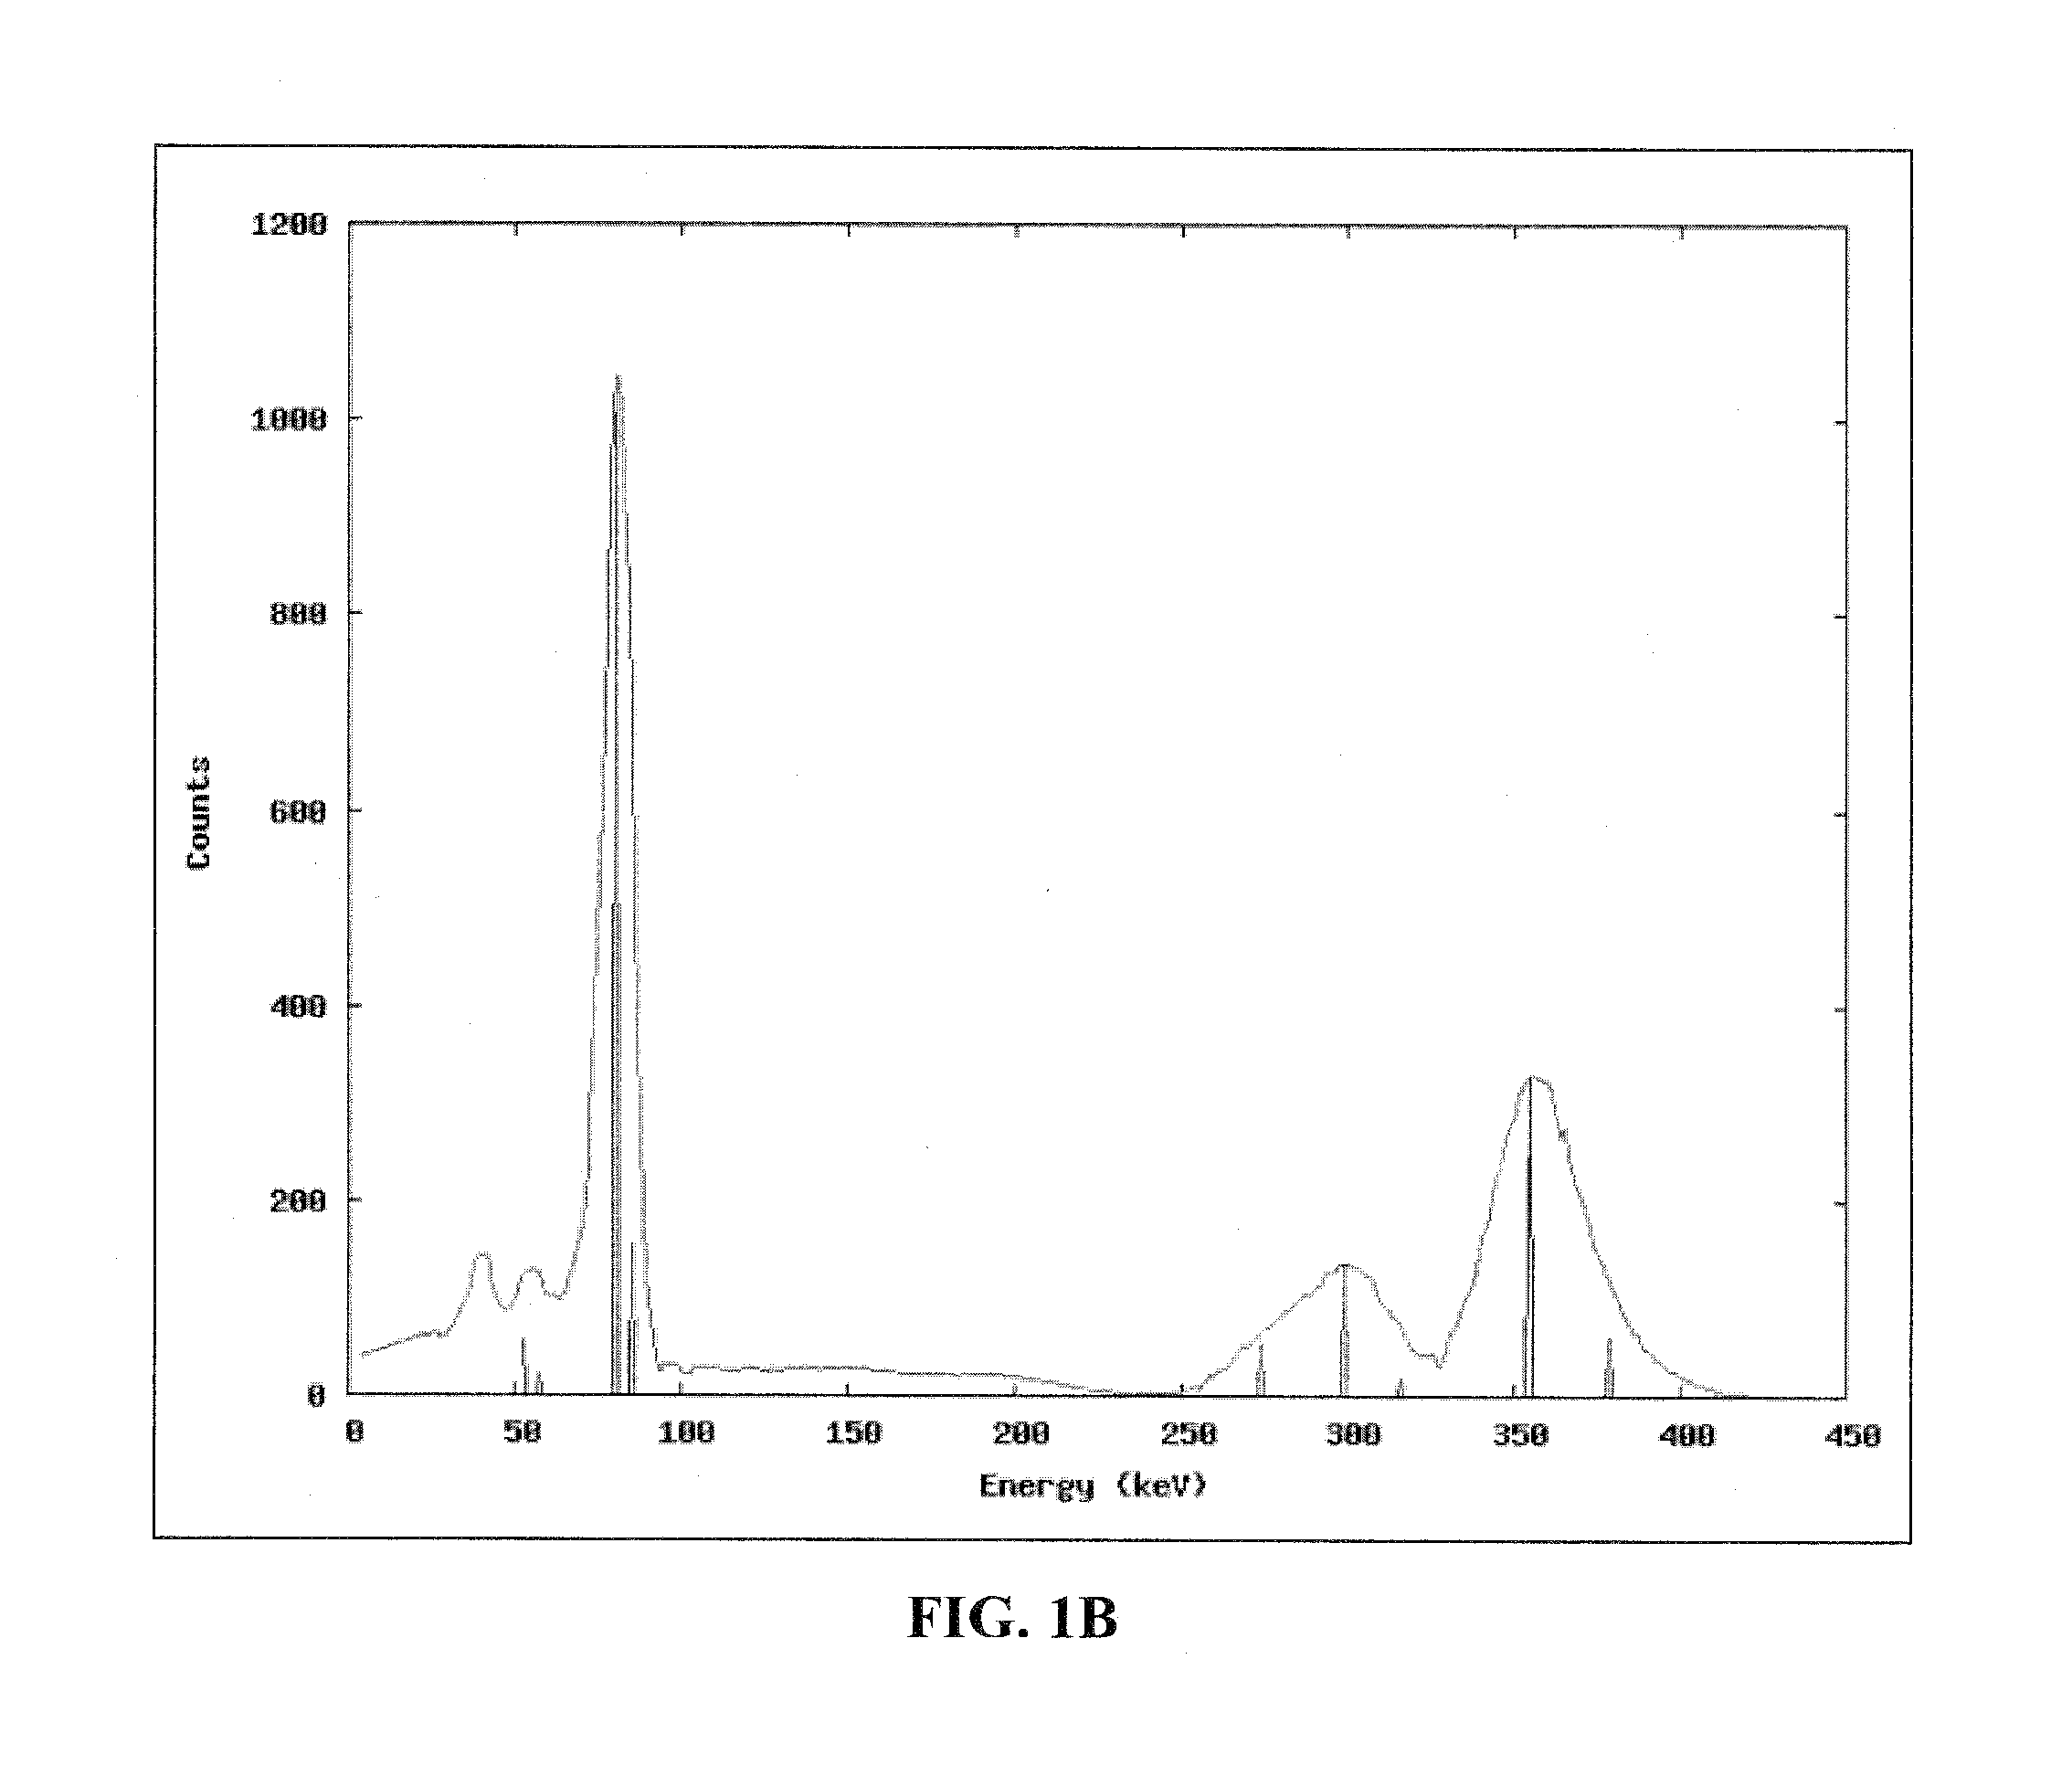
[0195]The following illustration shows an approximation of an actual ASEDRA analysis for a synthetically generated Ba-133 spectrum and demonstrates the details of how a specific embodiment of the ASEDRA algorithm works. This analysis used the input files presented in FIGS. 20, 21, and 23, in which both denoising and background subtraction are turned off. Actual ASEDRA results are shown in later examples.

[0196]The original measured spectrum is shown in FIG. 23, which shows a synthetically generated Ba-133 sample spectrum, and starts out equal to the remainder spectrum. There are eight local maxima points on the spectrum. Of those local maxima, the highest energy is at 356 keV. The height of the remainder spectrum at that point is 1650 counts, so the first identified peak is characterized as having a photopeak energy of 356 keV and a peak height of 1650 counts.

[0197]The detector response function for the first identified photopeak is shown in FIG. 24. Referring to FIG. 24, the remaind...

example 2

[0208]Cesium-137, or Cs-137, provides a very simple example for peak search because it has only one visible photopeak. A Cs-137 detector spectrum can be simulated with the spectral generator described herein used to produce the simulated detector response of FIG. 17, and the sample description in FIG. 6-1, which indicates that there is a single peak at 661.7 keV with a height of 650 counts. Referring to FIG. 36, with respect to the input file for generating a simulated Cs-137 detector response function, the first column lists the energies, in keV, of the photopeaks, and the second column lists the photopeak heights in counts.

[0209]The process.txt input file providing input settings for simulated Cs-137 for this example, as shown in FIG. 37, provides information about the sample and the detector, indicates where other input files can be found, and allows some tuning of ASEDRA's behavior. Each of the input parameters found in process.txt is described herein. In this case, the backgrou...

example 3

[0224]Previous examples used idealized examples for demonstrating how the advanced synthetically enhanced detector resolution algorithm (ASEDRA) performs spectral deconvolution. A variety of additional complications arise in real laboratory conditions, such as changes in the background radiation, scattered radiation from nearby objects in the lab, and uncertainty in the energy and full-width half-max (FWHM) calibration curves. This example includes laboratory measurements, with a 5 cm square cylindrical NaI detector, of samples that are similar to the previous examples. Additionally, a plutonium beryllium source is included to show ASEDRA's performance on a highly convoluted detector spectrum.

[0225]Energy calibration becomes more significant when real detectors are used. Table 8-1 shows the energy calibration data for this example.

TABLE 8-1Energy calibration dataChannelEnergy (keV)6253.29781.0334302.9387356.0705661.712391173.214021332.5

[0226]A measured Cs-137 spectrum is shown in FI...


PUM


Abstract

Embodiments of the invention pertain to a method and apparatus for spectral deconvolution of detector spectra. In a specific embodiment, the method can be applied to sodium iodide scintillation detector spectra. An adaptive chi-processed (ACHIP) denoising technique can be used to remove the results of stochastic noise from low-count detector spectra. Embodiments of the ACHIP denoising algorithm can be used as a stand alone tool for rapid processing of one dimensional data with a Poisson noise component. In a specific embodiment, the denoising technique can be combined with the spectral deconvolution method. Embodiments of the denoising technique and embodiments of the deconvolution method can be applied to any detector material that provides a radiation spectrum. Specific embodiments can incorporate one or more of the following for spectral deconvolution: denoising, background subtraction, detector response function generation, and subtraction of detector response functions. Photopeaks can be rapidly identified, starting at the high-energy end of the spectrum. The detector response functions can be estimated for photopeaks with a combination of Monte Carlo simulations and simple transformations.

Description

CROSS-REFERENCE TO RELATED APPLICATION[0001]The present application claims the benefit of U.S. Provisional Application Ser. No. 60 / 971,770, filed Sep. 12, 2007, which is hereby incorporated by reference herein in its entirety, including any figures, tables, or drawings.BACKGROUND OF INVENTION[0002]Roughly half of all sea-borne containers entering the U.S. in May 2006 were screened for radiological weapons and materials [1]. Portal monitoring is an enormous task, requiring accurate nuclide identification. Costs per portal monitoring system should preferably be low, in order to allow inspections at many, if not all, entry points to the United States. Further analysis of results should preferably be fast enough to not impede traffic flow.[0003]There is a growing demand for low cost, portable, high resolution gamma-ray detector systems that can operate at room temperature. Currently available sodium iodide (NaI) scintillators meet most of these requirements, but do not provide sufficien...

Claims


Application Information

Patent Timeline
IPC IPC(8): G06F19/00G01N21/00
CPCG01T1/362
Inventor SJODEN, GLENNLAVIGNE, ERICBACIAK, JAMESDETWILER, REBECCA
Owner UNIV OF FLORIDA RES FOUNDATION INC
Learn More