Analysis of Transcriptomic Data Using Similarity Based Modeling

a transcriptomic data and similarity-based modeling technology, applied in the field of transcriptomic data, can solve the problems of mis-regulation and upset of delicately balanced networks, and achieve the effect of small computing footprint, improved classification capability, and improved accuracy

Active Publication Date: 2011-04-21
PHYSIQ
View PDF21 Cites 21 Cited by
  • Summary
  • Abstract
  • Description
  • Claims
  • Application Information

AI Technical Summary

Benefits of technology

The invention takes the form of software for analysis of data. The software can run on any conventional platform, and can even be deployed in a remote, served environment, such as over the internet, because the needed data files can be sent to the processor for processing, and the results returned at a later time. However, a particular advantage of the present invention is that it has a small computing footprint and processes data quickly, making it ideal for an interactive tool, or for embedding in a distributed product for diagnostics (e.g., a CDROM deployed with a diagnostic microarray).
is that it has a small computing footprint and processes data quickly, making it ideal for an interactive tool, or for embedding in a distributed product for diagnostics (e.g., a CDROM deployed with a diagnostic microarray).
In a first embodiment of the invention, a model is trained with multivariate transcriptome profiles representative of normal health, and the model is then used to detect deviations in transcriptome patterns and dynamics representative of a diseased state, which deviations point to underlying disease mechanisms. An autoassociative model of gene expression data for normal tissue is trained from normal tissue data. A new input vector representing expression level data from diseased tissue is modeled with this model to provide an autoassociative estimate of the expression levels, which is then differenced with the actual measurements to provide residuals. A residual threshold test detects gene expression levels that are abnormal, identifying these genes as potential markers. Furthermore, the residual pattern can be pattern matched against stored patterns for known disease types to classify the'input vector vis-à-vis disease.
In a second embodiment of the invention, a diagnostic classification is made for a dynamic multivariate genomic or proteomic profile. An inferential model is trained to recognize normal and diseased state transcriptome profiles, and new samples are analyzed and classified accordingly.
The classification capability of the invention can advantageously be extended to prognostics, or assessing the progression of a disease. Thus, in a third embodiment of the analytic method, especially useful for multi-class classification though also useful for binary classification, an autoassociative model is built for each class represented, containing only samples / observations from that class (and none that are not from that class). A new input observation to be classified is modeled by all models in the system, and an autoassociative estimate is produced from each. Each estimate is then pattern matched to the input vector to provide a “global similarity” score: The estimate vector is compared to the input vector using the similarity operator, and the vector similarity score represents the global similarity. The model that generates the estimate with the highest global similarity score represents the class of the input vector.
An important aspect of the present invention is the use of a kernel-based model, and more particularly a similarity-based model. Such models are capable of learning complex dynamic relationships from data, with a small and fast computing footprint, and are robust to noise in the input. Even more particularly, the model can be a localized model, which is reconstituted with each new input sample, thus filtering out less relevant learned profiles.

Problems solved by technology

Disease most often occurs when these delicately balanced networks are upset and mis-regulated.

Method used


Image

  • Analysis of Transcriptomic Data Using Similarity Based Modeling
  • Analysis of Transcriptomic Data Using Similarity Based Modeling
  • Analysis of Transcriptomic Data Using Similarity Based Modeling

Examples


example

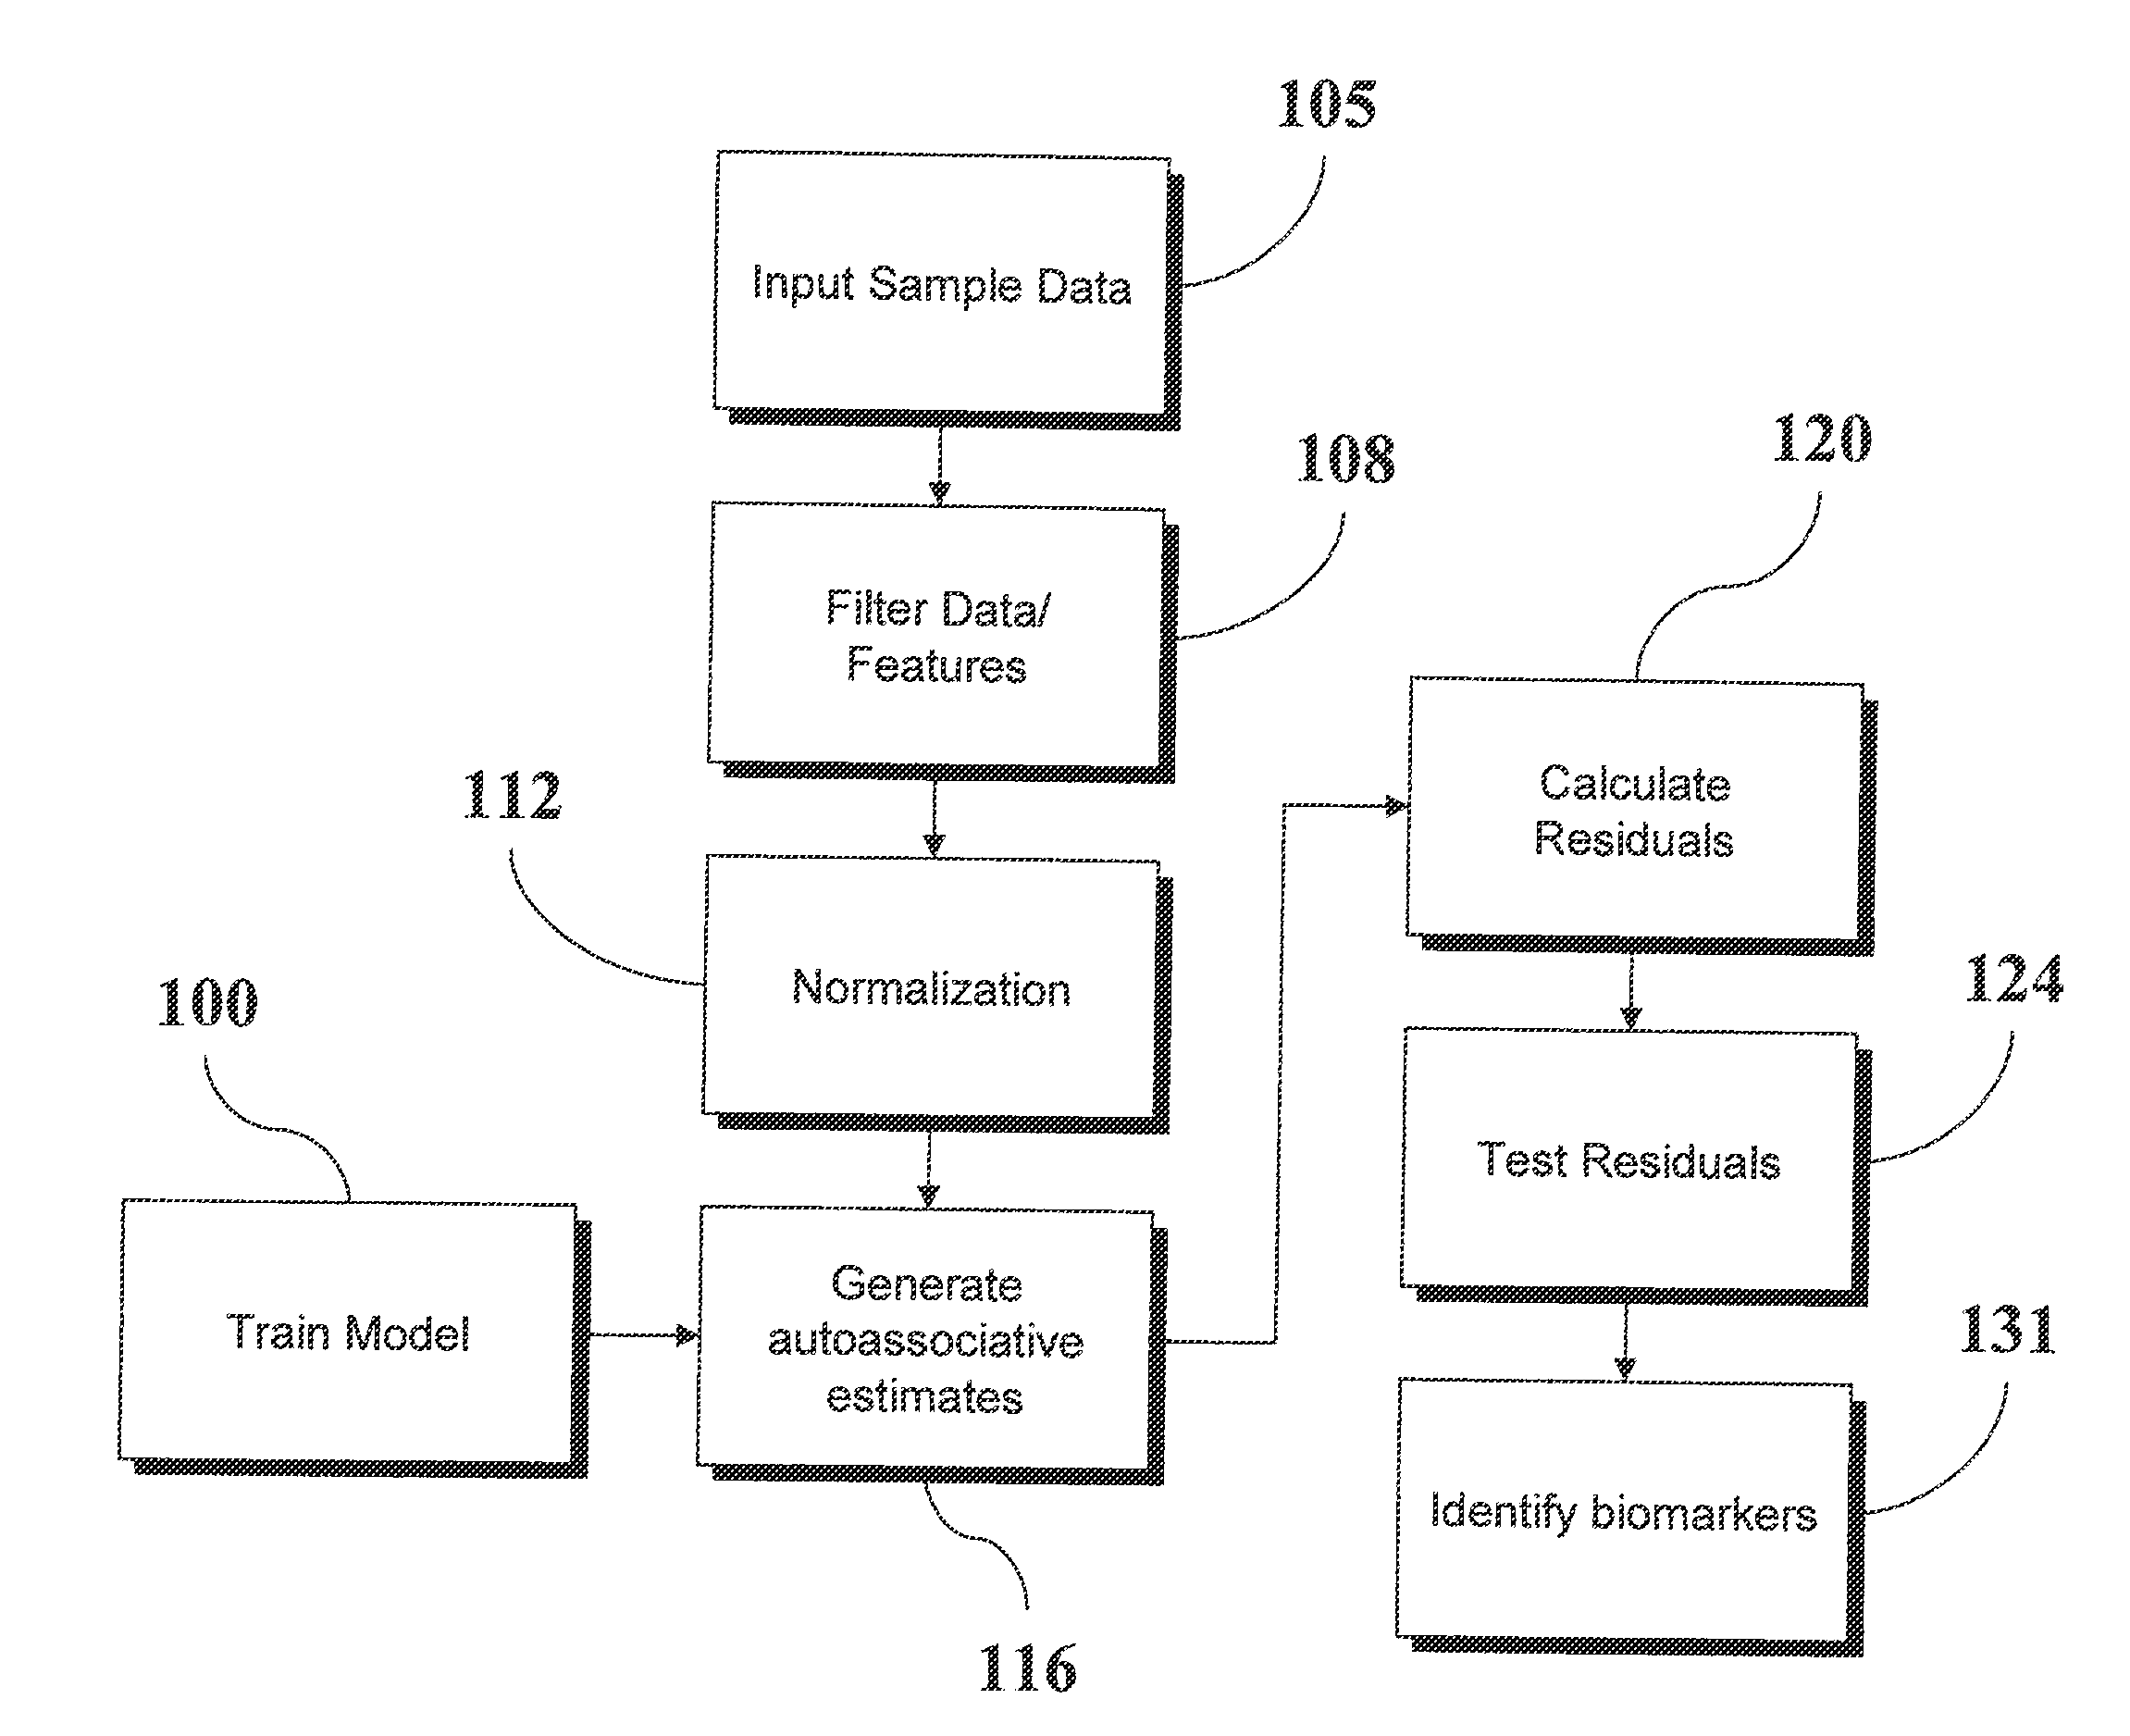
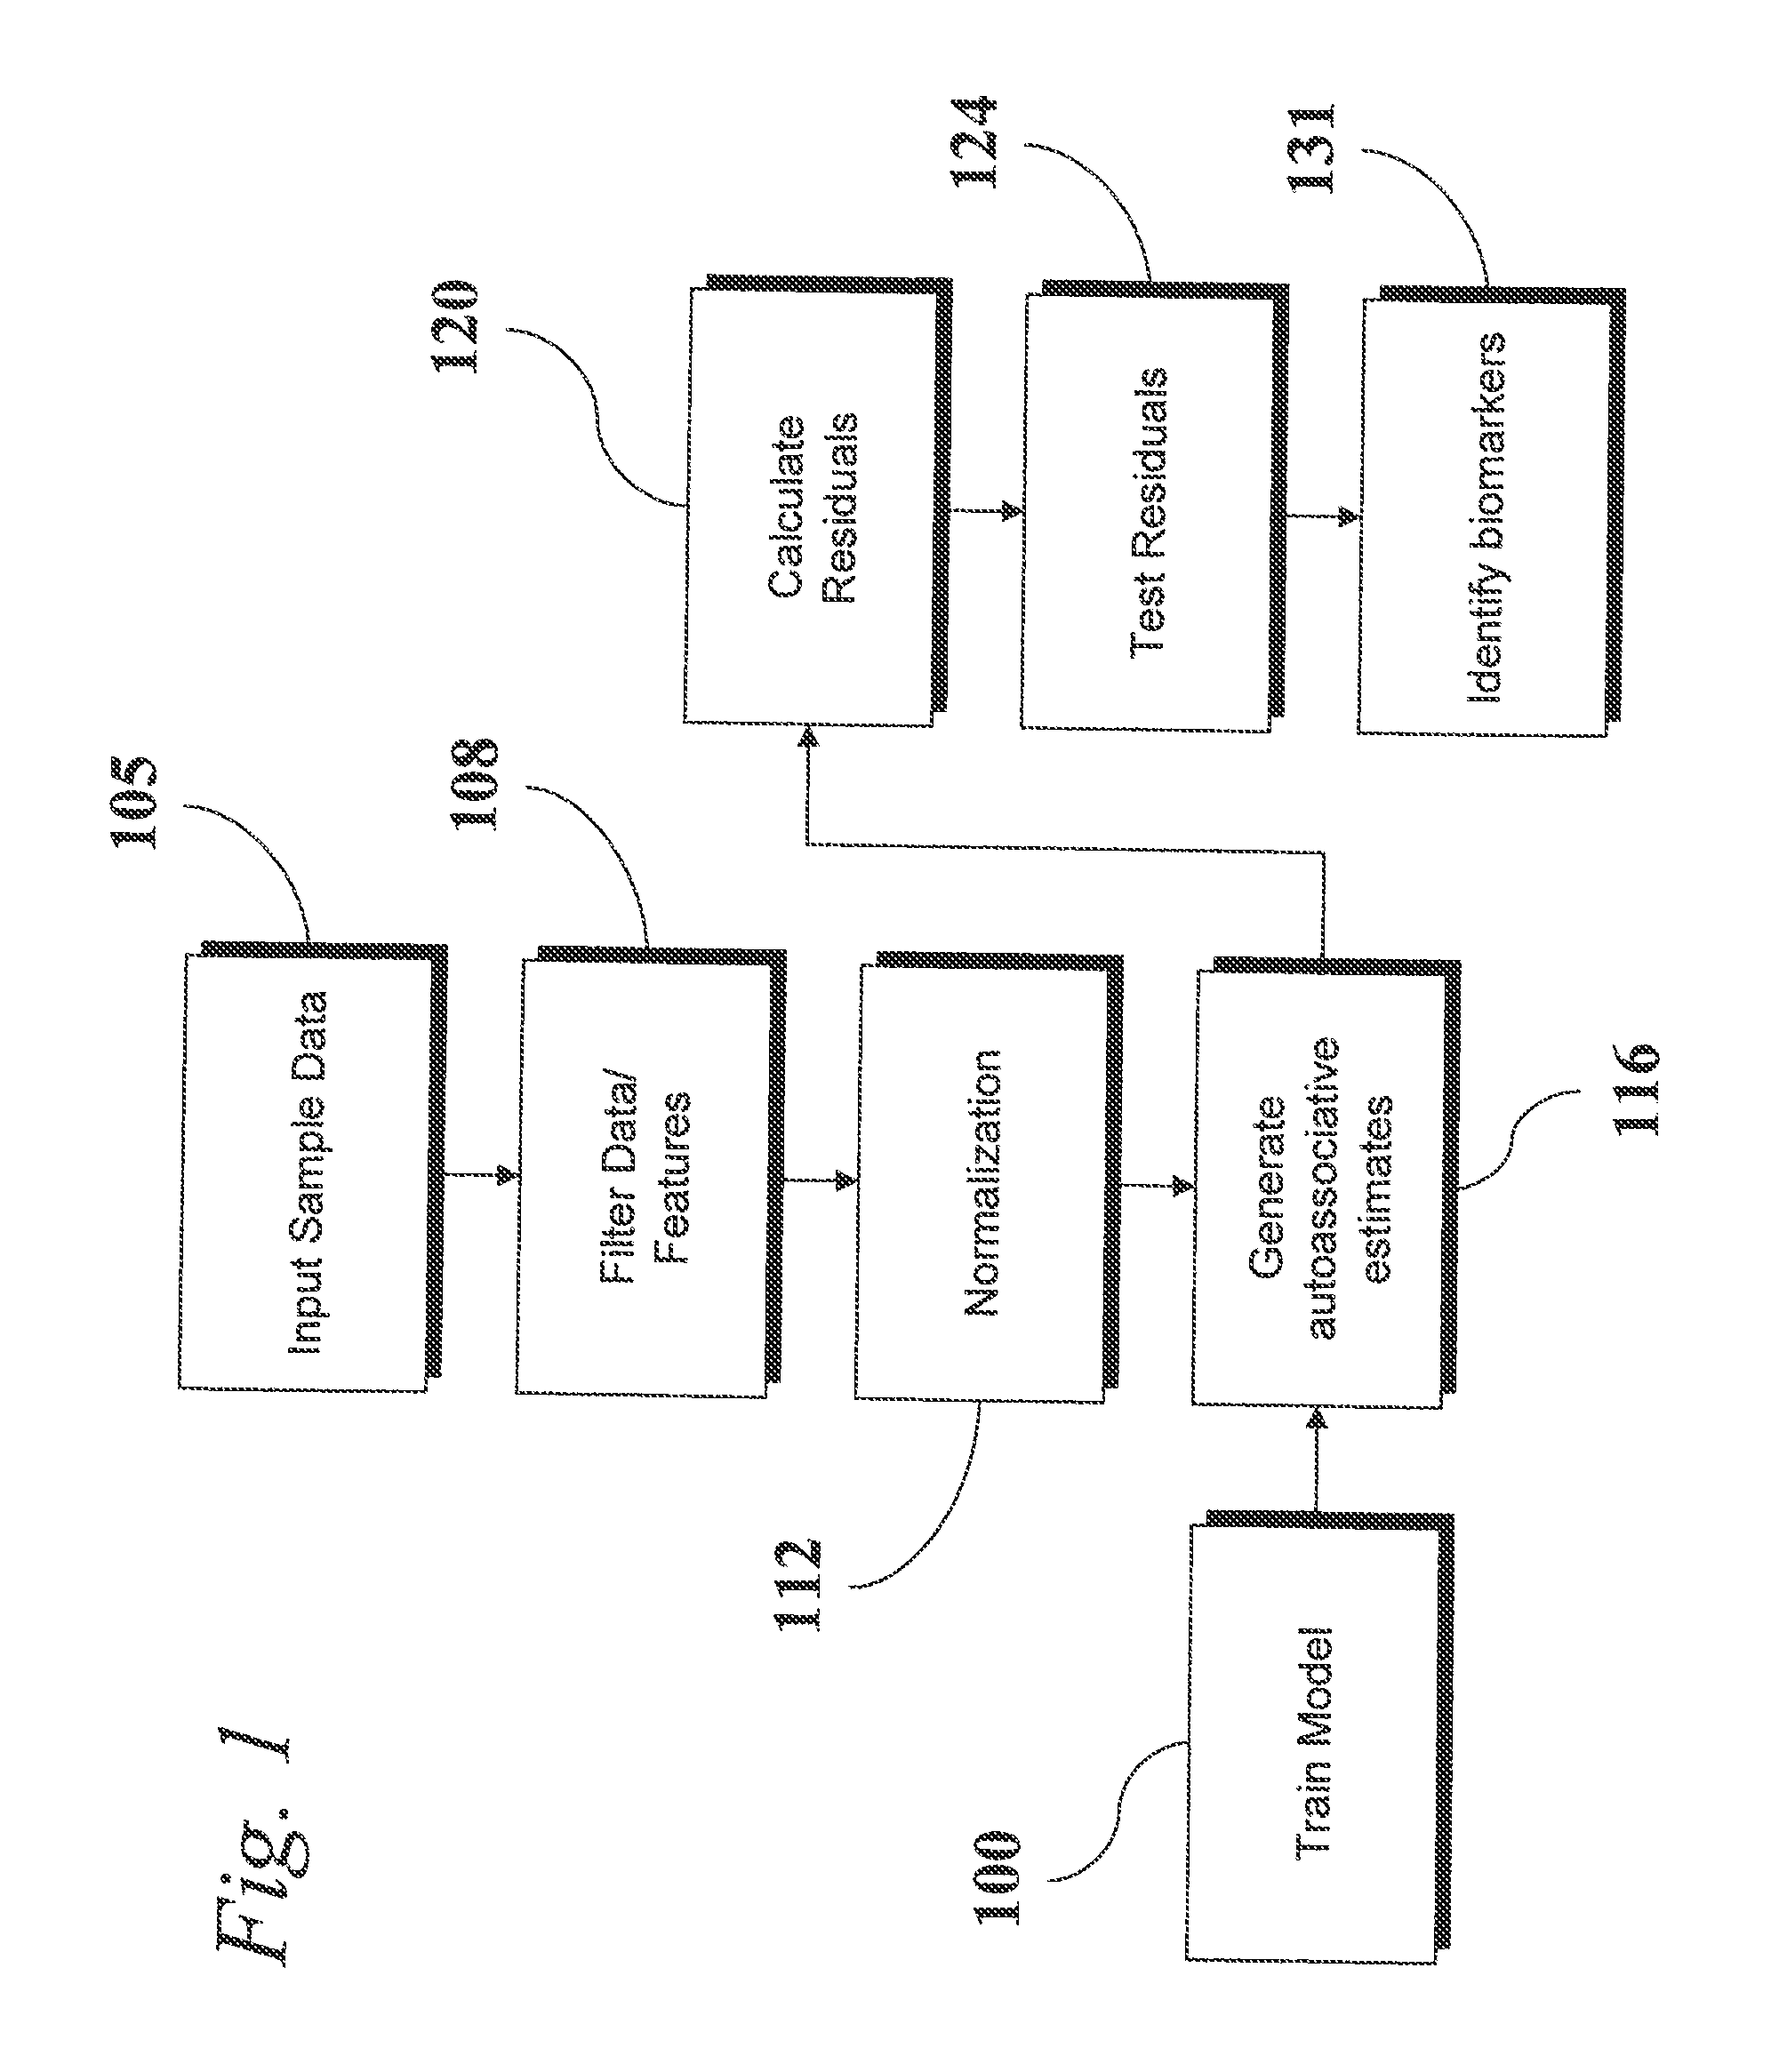
A simulated system comprising 15 constituents was developed whereby the 15 constituents related in their dynamic behavior to one another with varying degrees of linkage, emulating a regulatory network in a metabolic system. A set of reference data for this system, comprising observations of the 15 variables throughout various states of the dynamics of the system, was used to train a kernel-based model. Then, sets of normal and diseased observations, respectively, were generated, wherein one of the 15 constituents was perturbed to be slightly lower than it should be, regardless of its raw value. Turning to FIG. 10, a chart 1004 shows the value (quantity, expression level, etc.) for the suspect constituent, for the set of normal test observations. Each stem is a separate measurement of that constituent from the set of observations of “normal” specimens. Similarly is shown in chart 1005 the values for that same constituent in the set of observations of the “diseased” specimens. Values ...


PUM

PropertyMeasurementUnit
mass spectrometryaaaaaaaaaa
residual testingaaaaaaaaaa
oligo lengthaaaaaaaaaa

Abstract

An analytic apparatus and method is provided for diagnosis, prognosis and biomarker discovery using transcriptome data such as mRNA expression levels from microarrays, proteomic data, and metabolomic data. The invention provides for model-based analysis, especially using kernel-based models, and more particularly similarity-based models. Model-derived residuals advantageously provide a unique new tool for insights into disease mechanisms. Localization of models provides for improved model efficacy. The invention is capable of extracting useful information heretofore unavailable by other methods, relating to dynamics in cellular gene regulation, regulatory networks, biological pathways and metabolism.

Description

FIELD OF THE INVENTIONThe invention relates to biomarker discovery and disease diagnosis and prognosis, especially based on transcriptomic data such as gene expression levels and proteomics.BACKGROUND OF THE INVENTIONRecent advances in the biological sciences have made it possible to measure thousands of gene expression levels in cells using microarrays, and to quantify the cellular content of thousands of types of proteins using e.g., mass spectrometry, in single experiments with one sample of tissue or serum. Gene expression molecules, i.e., messenger RNA, and the proteins encoded by the mRNA comprise the “transcriptome” of the cell, the components of the cell that are the direct products of the transcription (the genome) and translation (the proteome) of DNA. Analysis of the transcriptome offers the potential to identify “bad actors” in the genetic expression process that are responsible for disease, and may offer both a signature for disease diagnosis, as well as targets for dis...

Claims


Application Information

Patent Timeline
Patent Type & Authority Applications(United States)
IPC IPC(8): G06F7/60G16B40/10G16B25/10
CPCG06F19/24G06F19/20G16B25/00G16B40/00G16B40/10G16B25/10
Inventor PIPKE, ROBERT MATTHEWMOTT, JACK E.
Owner PHYSIQ
Why Eureka
Try Eureka