Methods to identify macromolecule binding and aggregation prone regions in proteins and uses therefor
- Summary
- Abstract
- Description
- Claims
- Application Information
AI Technical Summary
Benefits of technology
Problems solved by technology
Method used
Image
Examples
example 1
Molecular Dynamics Simulation Methodology
[0147]Molecular dynamics simulations were performed for a full antibody using an all atom model. The initial structure for simulation for the full antibody was obtained from the X-ray structures of individual Fab and Fc fragments. The X-ray structure of a proof-of-concept (POC) Fab fragment was selected for modeling onto the X-ray structure of Fc obtained from the IgG1 antibody 1HZH (Saphire et al., Science. 2001, 293, 1155). 1HZH was chosen since the X-ray structure is known for the full antibody and since the Fc structure is the same for all of the IgG1 class of antibodies. The structure of a full POC antibody was then obtained by aligning the Fab and Fc fragments using the 1HZH structure as a model template. In order to align the fragments at the correct distance and orientation, the RMSD (Root Mean Square Deviation) was minimized between the common CYS residues of the fragments and the full antibody template (1HZH). The CYS residues were ...
example 2
Calculation of the Spatial Aggregation Propensity (SAP)
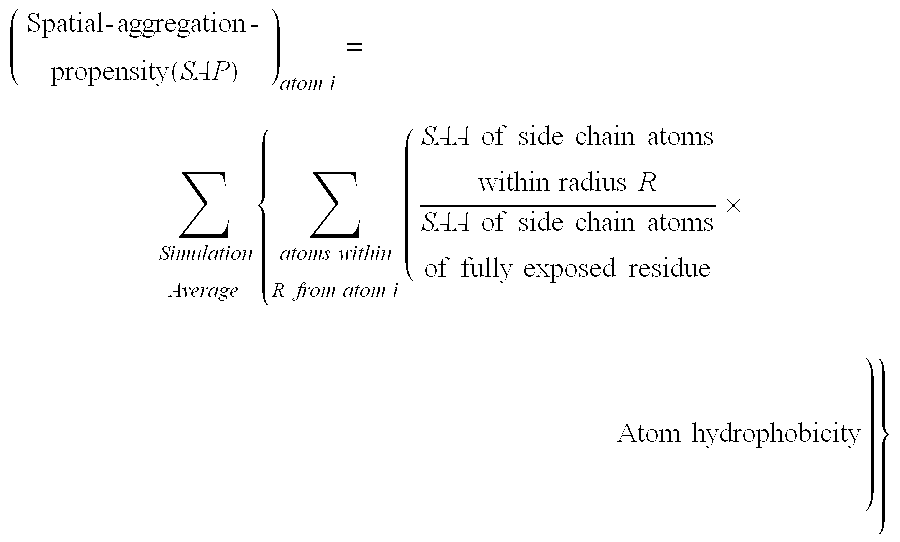
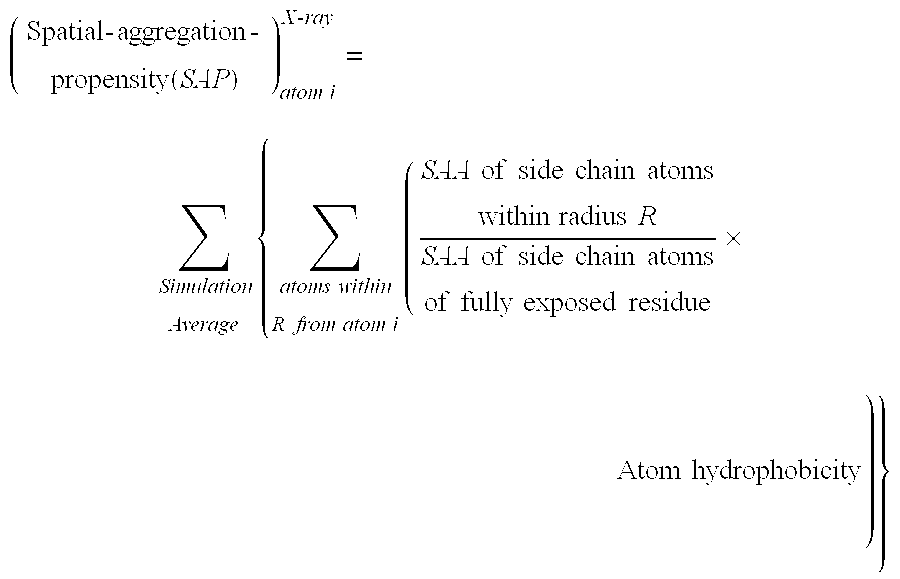
[0150]In order to overcome the shortcomings of SAA, a new parameter was defined called ‘Spatial-Aggregation-Propensity’ as described above.
[0151]In this example the ‘Spatial-Aggregation-Propensity’ was calculated for spherical regions with radius R centered on every atom in the antibody described in Example 1. The value of Spatial-Aggregation-Propensity was thus evaluated with a 3Ons simulation average for the Fc-fragment of the antibody for two different radii of patches (R=5 Å, 10 Å) (One of skill in the art will appreciate various time steps for simulation may be chosen according to the computational resources available and the desired resolution of the result). In both cases it was noticed that the majority of values were negative, indicating that most exposed regions are hydrophilic. This was as expected since most of the exposed protein surface is usually hydrophilic. It was also observed that there are a few regions with ...
example 3
Selection of Antibody Sites for Stability Engineering
[0157]The sites to be engineered for enhanced antibody stability were selected on the basis of the SAP parameter. This spatial parameter accounts for (1) Solvent accessible area (SAA) of each residue, (2) the residue's hydrophobicity, and (3) the spatial contributions of all residues within a certain radius. In this example, the hydrophobic residues that correspond to the positive peaks in CH2 were changed to non-hydrophobic residues. It was expected that this would improve the overall protein stability. The two selected sites (A1 and A2) correspond to two very hydrophobic residues. An analysis was undertaken of substitutions of these residues with lysine, a very hydrophilic amino acid with a positively charged side chain. Variant A1 and Variant A2 differ from wild-type by single amino substitution.
PUM
| Property | Measurement | Unit |
|---|---|---|
| Radius | aaaaa | aaaaa |
| Area | aaaaa | aaaaa |
| Hydrophilicity | aaaaa | aaaaa |
Abstract
Description
Claims
Application Information
 - R&D
- Intellectual Property
- Life Sciences
- Materials
- Tech Scout
- Unparalleled Data Quality
- Higher Quality Content
- 60% Fewer Hallucinations
Browse by: Latest US Patents, China's latest patents, Technical Efficacy Thesaurus, Application Domain, Technology Topic, Popular Technical Reports.
© 2025 PatSnap. All rights reserved.Legal|Privacy policy|Modern Slavery Act Transparency Statement|Sitemap|About US| Contact US: help@patsnap.com


