Quality metrics for automatic evaluation of dual ish images

a technology of quality metrics and image, applied in image analysis, image enhancement, instruments, etc., can solve the problems of poor clinical outcome, high risk of recurrence, labor-intensive manual interpretation of tissue slides, etc., and achieve the most suitable z-layer accuracy, high discriminability, and high number of cases

Active Publication Date: 2017-11-09
VENTANA MEDICAL SYST INC
View PDF0 Cites 31 Cited by
  • Summary
  • Abstract
  • Description
  • Claims
  • Application Information

AI Technical Summary

Benefits of technology

[0030]Applicants have discovered a superior method of determining the most suitable z-layer in a given z-stack of images. Indeed, when compared to prior art methods, the present method for z-layer identification is consistently superior and experimentation has shown that the new method is able to accurately determine the most suitable z-layer in more cases as compared with the prior art methods.

Problems solved by technology

Sadly, this alteration is also an independent prognostic factor predictive of poor clinical outcome and a high risk of recurrence.
Interpreting tissue slides manually is labor intensive, costly and involves the risk of human errors and inconsistency, while using automated image analysis can provide additional automatic, fast and reproducible analyses, assisting the pathologist in making an accurate and timely diagnosis.
Indeed, properly focused images having sharp, discernible features are needed for further downstream processing, and failure to provide quality, foc

Method used


Image

  • Quality metrics for automatic evaluation of dual ish images
  • Quality metrics for automatic evaluation of dual ish images
  • Quality metrics for automatic evaluation of dual ish images

Examples


example 2

[0289]Description of Experimental Dataset and Correlation Metrics

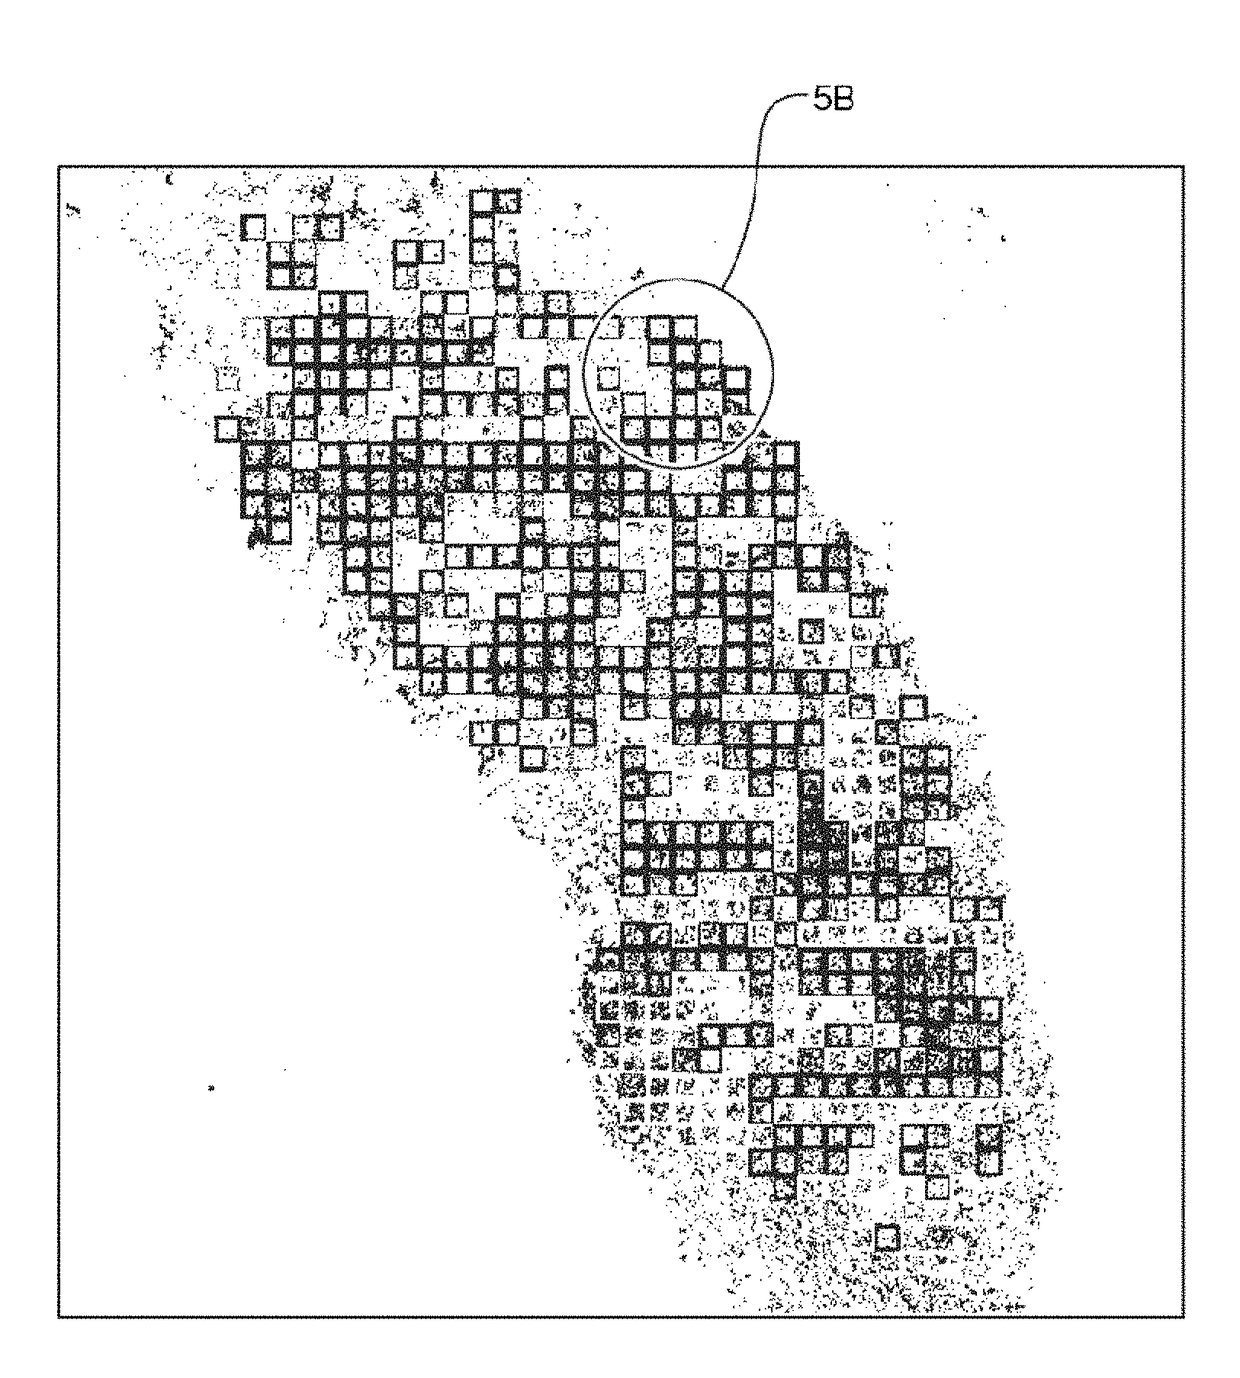
[0290]For training the algorithm, i.e. to compute the correlation between the ground truth and computed features and to find the features more correlated to the ground truth, volume scans of 10 Dual ISH slides were used that were scanned at 40× using 15 z-layers at 0.25 micron spacing on the Coreo scanner. 76 Fields of View (FOVs) were extracted, resulting in 76*15=1140 images. For testing how well the correlation holds for unseen data, the testing set included volume scans of 12 Dual ISH slides, scanned at 40× using 15 z-layers and 0.25 micron separation; where 45 FOVs were extracted resulting in 45×15=675 images.

[0291]Suppose (a,b) (where derived image being considered=R+a*G+b*B, where (R,G,B) can be original 8-bit pixel values, or they can refer to the corresponding optical density values) are varied in the range [−1,1] in steps of 0.2; so each of a and b can take up 9 possible value and the set (a, b) can have 9×9=...

example 3

[0294]Computation of Correlation score (C) Between a Quality Score Feature Vector (F), and a Ground Truth Score Vector(G). The following steps may be performed for a plurality of quality score feature vectors, whereby a quality score feature vector may be a vector of candidate color separation metrics computed for each of the z-layer images or may be a vector of candidate focus metrics computed for each of the z-layer images. For example, the correlation may be computed by using a plot 902 as depicted in FIG. 9 for a candidate focus feature metrics.

[0295]A plurality of training z-layers in a z-stack of training digital images is read by a processor of the computer system. Each training digital image is an RGB image having assigned a focus score known to accurately indicate the focus quality of the training image. For each of the training digital images, the processor computes a plurality of candidate focus metrics. It is at this stage not yet clear if a candidate focus metric has an...

example 4

[0304]FIG. 10a depicts the representation of 6 dots of a first color and 6 dots of a second color in an optical density domain coordinate system. For example, a set of 6 vectors 918 corresponds to a set of 6 dots generated by black color signals of respective tissue sample areas stained with a black stain such as silver. A set of 6 vectors 936 corresponds to a set of 6 dots generated by red color signals of respective tissue sample areas stained with a red stain, e.g. a red fluorescent stain.

[0305]At first, the optical density (OD) of the rgb values for the 12 identified dots are determined. For example, the 12 dots may all be contained in the same tile.

[0306]Each of the identified first dots (e.g. black dots) and second dots (e.g. red dots) are represented as dot-vectors. The number 918 refers to the set of dot vectors derived from black dots and 936 refers to the set of dot vectors derived from red dots.

[0307]The 12 dot vectors are represented in spherical coordinates and the azim...


PUM


Abstract

The present disclosure is directed to a computer system designed to (i) receive a series of images as input; (ii) compute a number of metrics derived from focus features and color separation features within the images; and (iii) evaluate the metrics to return (a) an identification of the most suitable z-layer in a z-stack, given a series of z-layer images in a z-stack; and/or (b) an identification of those image tiles that are more suitable for cellular based scoring by a medical professional, given a series of image tiles from an area of interest of a whole slide scan.

Description

CROSS-REFERENCE TO RELATED APPLICATIONS[0001]This patent application is a continuation of International Patent Application No. PCT / EP2016 / 051903 filed Jan. 29, 2016, which claims priority to and the benefit of U.S. Provisional Application No. 62 / 110,215 filed Jan. 30, 2015. Each of the above patent applications are hereby incorporated by reference herein in their entireties.BACKGROUND OF THE DISCLOSURE[0002]Molecular pathology is the examination at a molecular level of the DNA, mRNA, and proteins that cause or are otherwise associated with disease. Gene amplification and / or overexpression have been identified as an indicator of patient prognosis in a variety of tumors or for determining those patients that should be provided certain treatments. For example, a certain type of breast cancer is associated with an over-abundance (e.g., over expression) of the human epidermal growth factor 2 (“HER2”) versus the number of chromosome 17s found in the cell. Sadly, this alteration is also an...

Claims


Application Information

Patent Timeline
IPC IPC(8): G06T5/00G06T7/00G06T5/50G02B21/36
CPCG06T5/003G06T5/50G06T7/0002G02B21/367G06T2207/30168G06T2207/10056G06T2207/10148G06T2207/30024G06T2207/10024G06T7/90G06T7/0014G06T2207/20076
Inventor SARKAR, ANINDYAMARTIN, JIMATCHISON, JEFFREY
Owner VENTANA MEDICAL SYST INC
Why Eureka
Try Eureka