Analysis device
a technology of analysis device and analysis technology, applied in the field of analysis technology and analysis device, can solve the problems of complex cell groups with limited human knowledge and ability, difficult to effectively reconstruct, recognize, process and utilize a tremendously large amount of multi-dimensional data of cells, and difficult to effectively analyze and classify single-cell imaging cytometry information, etc., to achieve rapid optimization of optical systems, improve the accuracy and speed of analysis and classification, and improve the effect of accuracy and speed
- Summary
- Abstract
- Description
- Claims
- Application Information
AI Technical Summary
Benefits of technology
Problems solved by technology
Method used
Image
Examples
example 1
[0136]Hereinafter, the present invention will be specifically described with reference to examples.
(Supervised Machine Learning, Decompression / Conversion of Image into Temporal Signal Using Optical Structure, Classifier Formation, and Classification)
[0137]A computer used in present example included a 2.8 GHz Intel Core i7 processor and 16 GB of memory.
[0138]First, as an object sample for learning, a total of 1100 images including 1000 images for learning and 100 images for classification accuracy measurement were provided for a face image group and a non-face image group in which an image had 19 pixels in length and 19 pixels in width (an image source of FIG. 16 is the Center for Biological and Computational Learning at MIT).
[0139]Within the computer, noise (S / N=30 dB) was applied to the above-described image group, the above-described GMT process passing through an optical structure was virtually executed, and a temporal signal was generated. The optical structure was a patterned ...
example 2
Example 2 (Cell Classification by Unsupervised Machine Learning)
[0149]A computer used in this embodiment included a 2.8 GHz Intel Core i7 processor and 16 GB of memory.
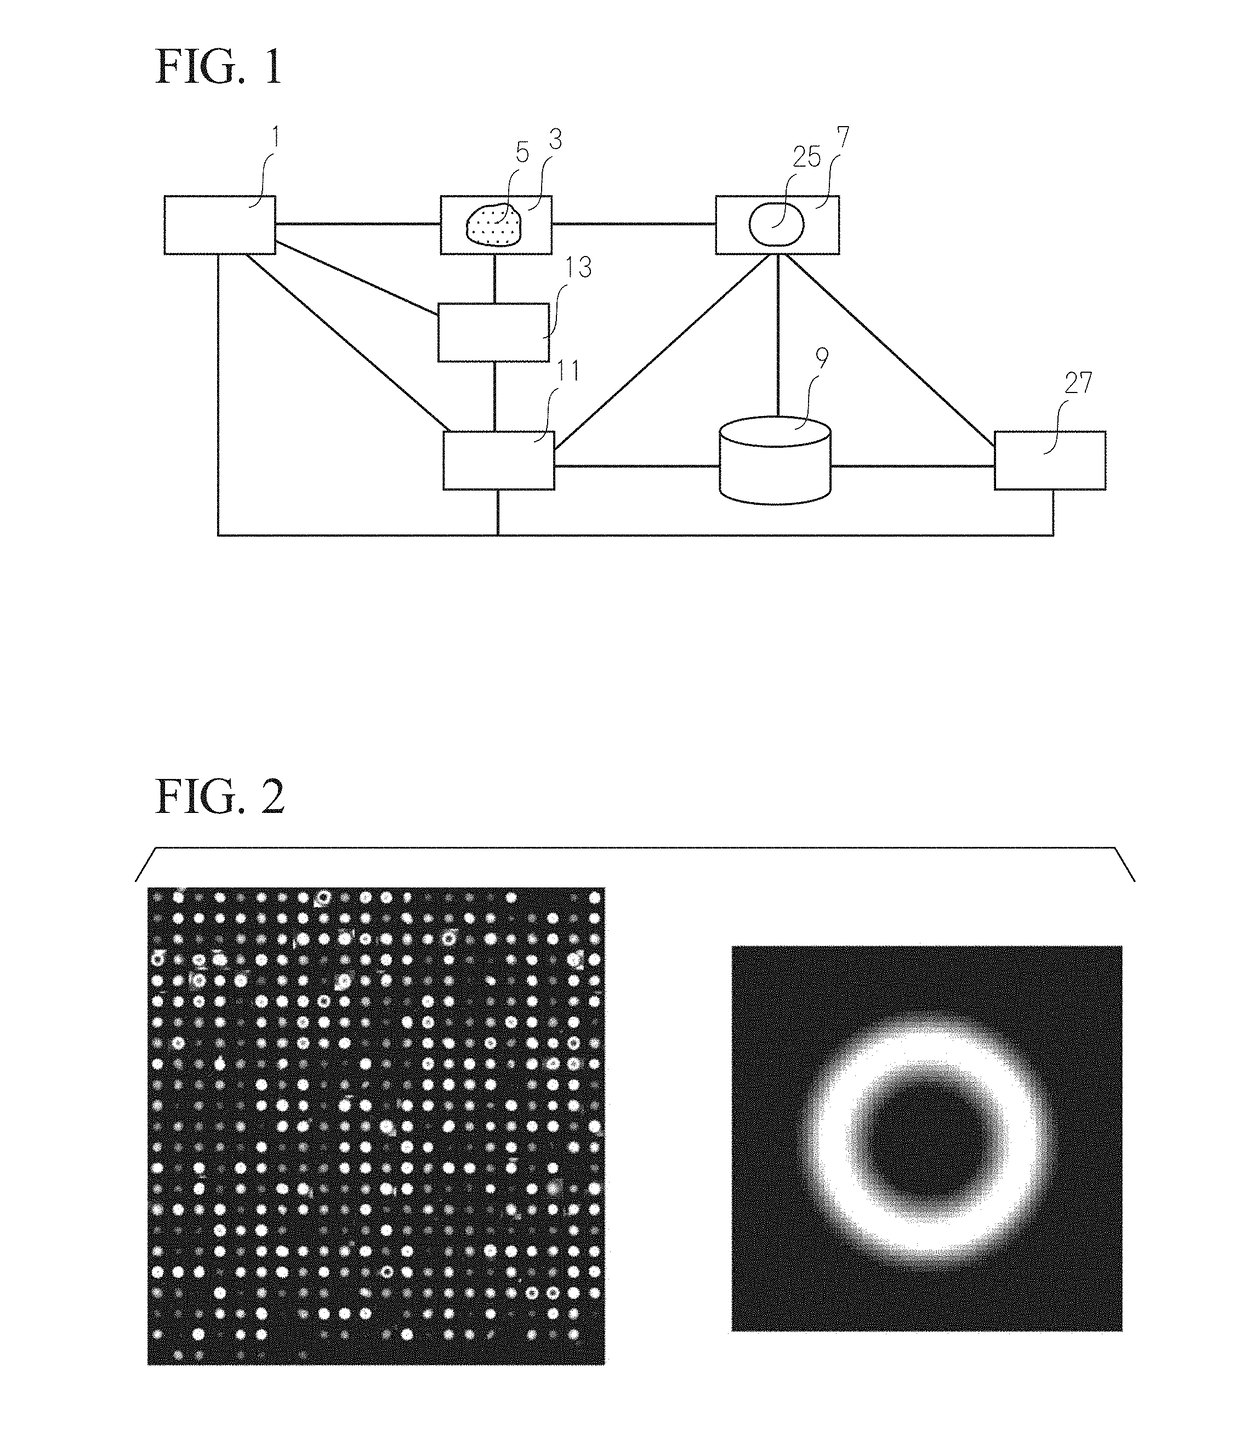
[0150]For a sample, viable cell staining was performed using calcein AM for a single-cell group generated by dispersing mouse spleen. A fluorescence-labeled single cell solution as described above was spread on a glass slide and a large number of fluorescence images of a single-cell group were captured by an sCMOS camera (Flash 4.0 manufactured by Hamamatsu Photonics K.K.) using a fluorescence microscope. This image data was read within the computer, the position of a single cell was specified by software (imagej), and a single-cell periphery was partitioned using 70 pixels in length and width to cut out 2165 samples of a large number of single-cell image group samples (FIG. 19). This single-cell image group included images containing single cells having different sizes and images including a plurality of cells or obj...
example 3
Example 3 (Optimization of Optical Structure by Supervised Machine Learning)
[0153]In the present example, samples similar to those used in Example 1 were used.
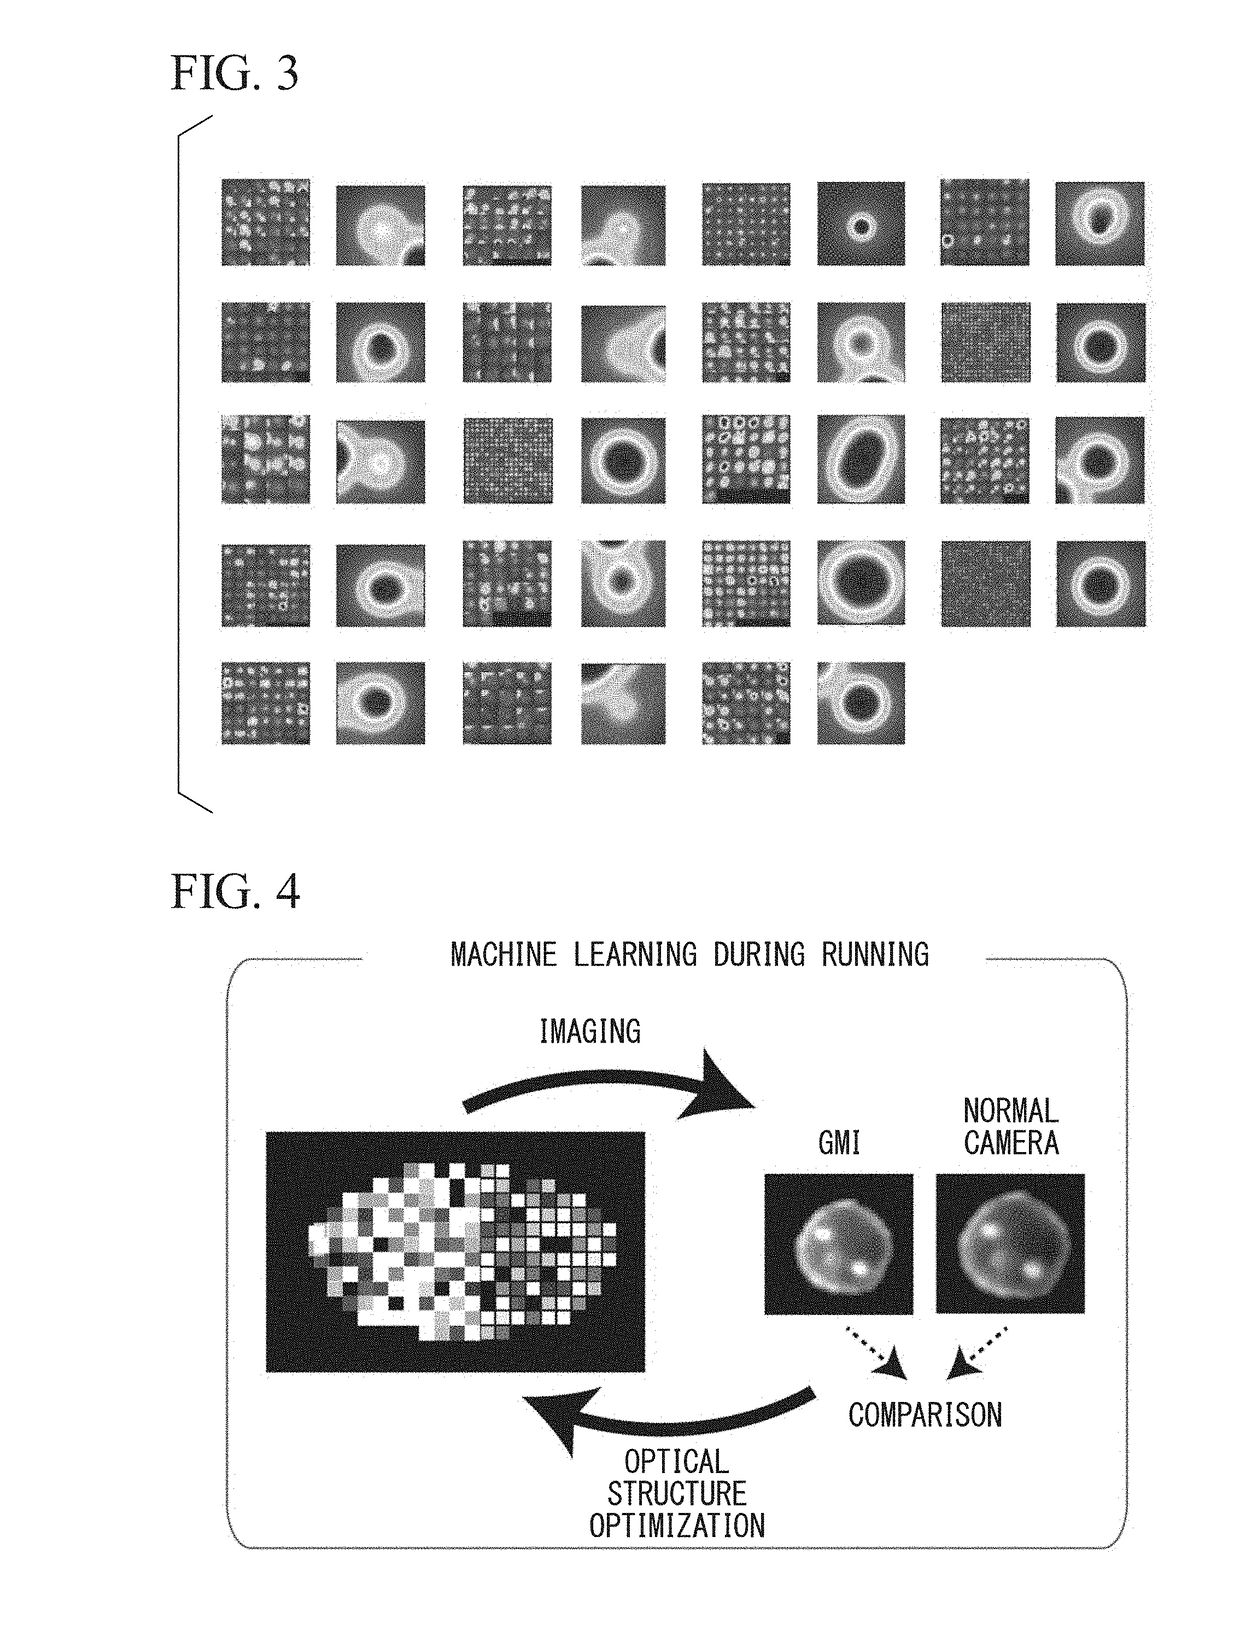
[0154]As an initial optical structure, a random structure was provided with 80 pixels in length and 20 pixels in width and samples of the temporal waveform signal group were provided through the image samples of Example 1. As in Example 1, learning was performed using a linear classification type support vector machine technique, and the classification accuracy (the number of correct answers for face and non-face / total number×100) was obtained. This accuracy of classification was set as an objective function, and the optical structure was optimized using machine learning in order to maximize the objective function (FIG. 24). Specifically, a genetic algorithm was used. The number of individuals was 200, the number of generations was 16,000, roulette selection was used for selection, and uniform crossover was used for crossover....
PUM
 Abstract
Description
Claims
Application Information
 - R&D
- Intellectual Property
- Life Sciences
- Materials
- Tech Scout
- Unparalleled Data Quality
- Higher Quality Content
- 60% Fewer Hallucinations
Browse by: Latest US Patents, China's latest patents, Technical Efficacy Thesaurus, Application Domain, Technology Topic, Popular Technical Reports.
© 2025 PatSnap. All rights reserved.Legal|Privacy policy|Modern Slavery Act Transparency Statement|Sitemap|About US| Contact US: help@patsnap.com


