Identifying false positive variants using a significance model

Pending Publication Date: 2019-03-07
GRAIL LLC
View PDF0 Cites 4 Cited by
  • Summary
  • Abstract
  • Description
  • Claims
  • Application Information

AI Technical Summary

Benefits of technology

[0007]Disclosed herein are methods and systems for training and applying a background noise model that predicts the occurrence and a level of noise that is present in sequencing read information. In particular, disclosed herein are models to assess the significance level of evidence and identify and eli

Problems solved by technology

However, deep sequencing has limitations.
In particular, errors introduced during sample preparation and sequencing can make accurate identification of rare variants difficult.
These methods may not be suitable for calling variants from deep sequencing data obtained from a cell free nucleotide sample.
However, detection of variants in deep sequencing data sets poses distinct challenges: the number of sequenced fragments tend to be several order of magnitude larger (e.g., sequencing depth can be 2,000× or more)), de

Method used


Image

  • Identifying false positive variants using a significance model
  • Identifying false positive variants using a significance model
  • Identifying false positive variants using a significance model

Examples


Example

Example 1: Tradeoff Between Sensitivity and Specificity

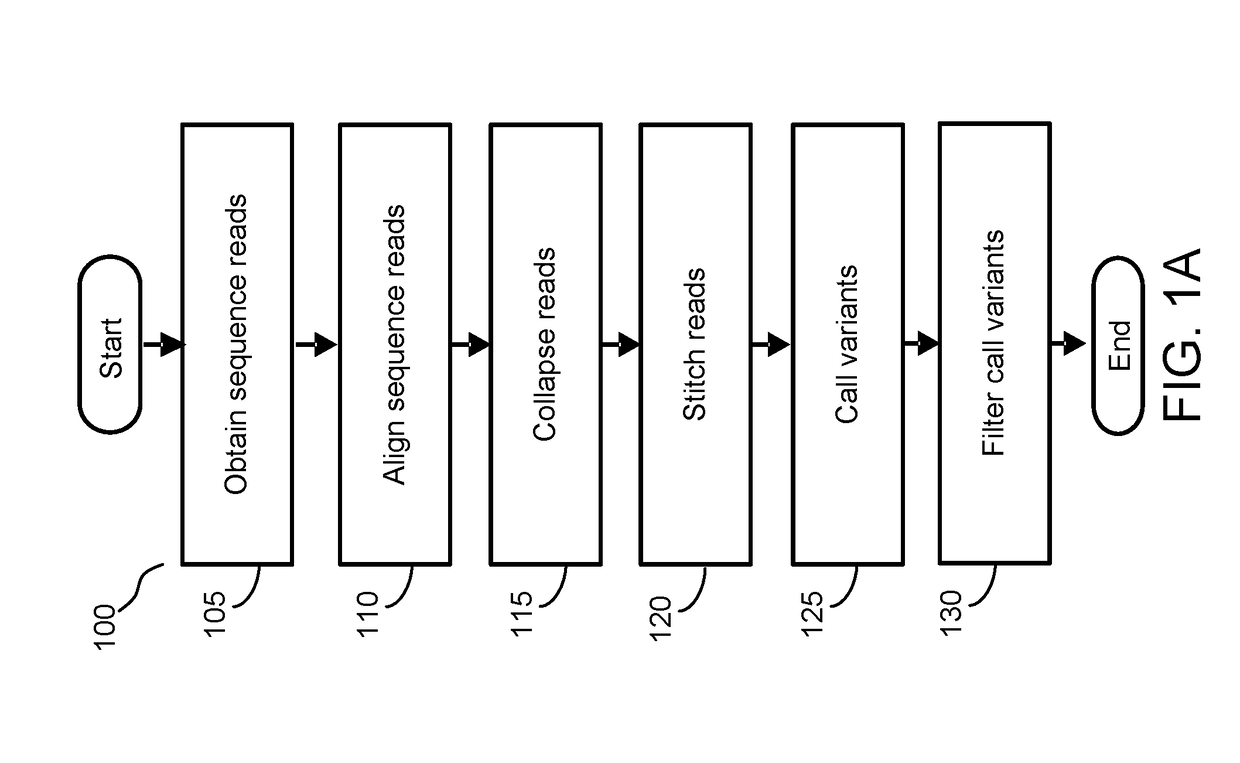
[0135]FIG. 5A depicts the tradeoff between sensitivity (e.g., detection rate) and specificity (e.g., false positives per sample), in accordance with an embodiment. In this example, the tradeoff between sensitivity and specificity of applying the significance model is shown in relation to samples processed using the partial workflow process of FIG. 1A without the application of the significance model.

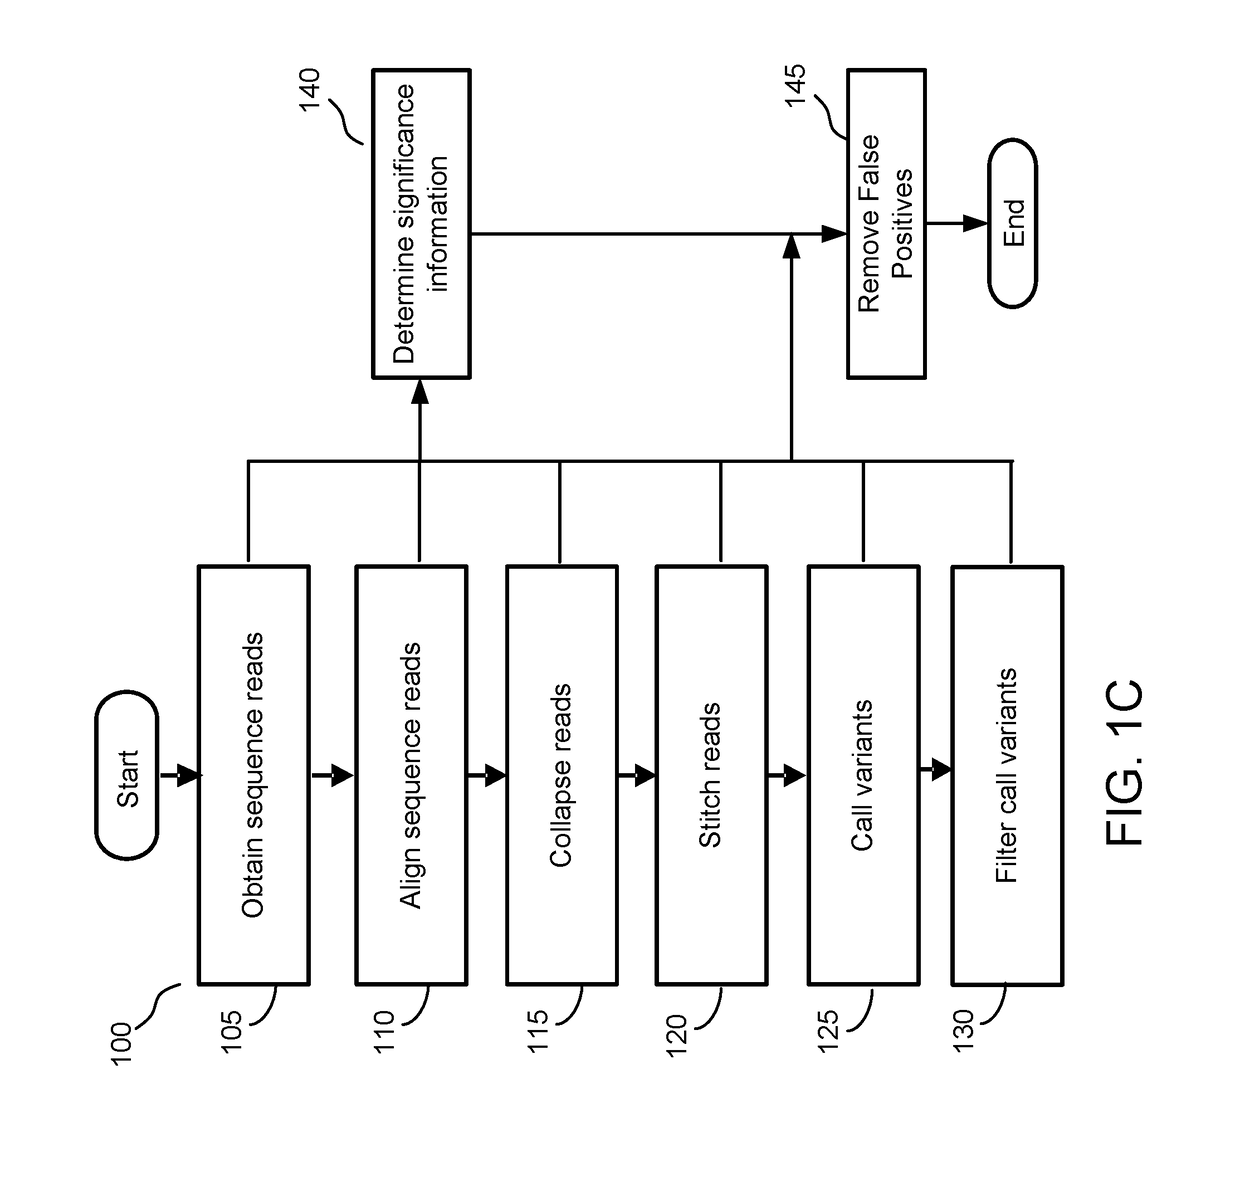
[0136]The expected allele frequency (expected AF) of different variants was experimentally determined using a cfDNA titration study. Referring to the most stringent criteria for removal of false positives in step 145 (e.g., p−6), for each expected AF (e.g., expected AF=0.1%, 0.2%, 0.4%), a large number of false positives were removed by step 145 (e.g., 130). However, for variants with lower expected AF (e.g., expected AF=0.1% or 0.2%), the detection rate similarly dropped at the most stringent criteria of p−6 in comparison to larger ...

Example

Example 2: Example Experimental Setup

[0137]FIG. 5B depicts an example experimental setup for training and testing a significance model. In this example, a total of n=60 healthy human cfDNA samples were obtained from an experiment titled “RefSet experiment”. Of those, three samples were excluded due to likely contamination issues. The remaining cfDNA samples were divided into a training dataset (n=43) for training the significance model and a testing dataset (n=14) for testing the significance model. Additionally, n=24 genomic DNA samples (gDNA) were obtained for training the significance model and for evaluating the technical noise.

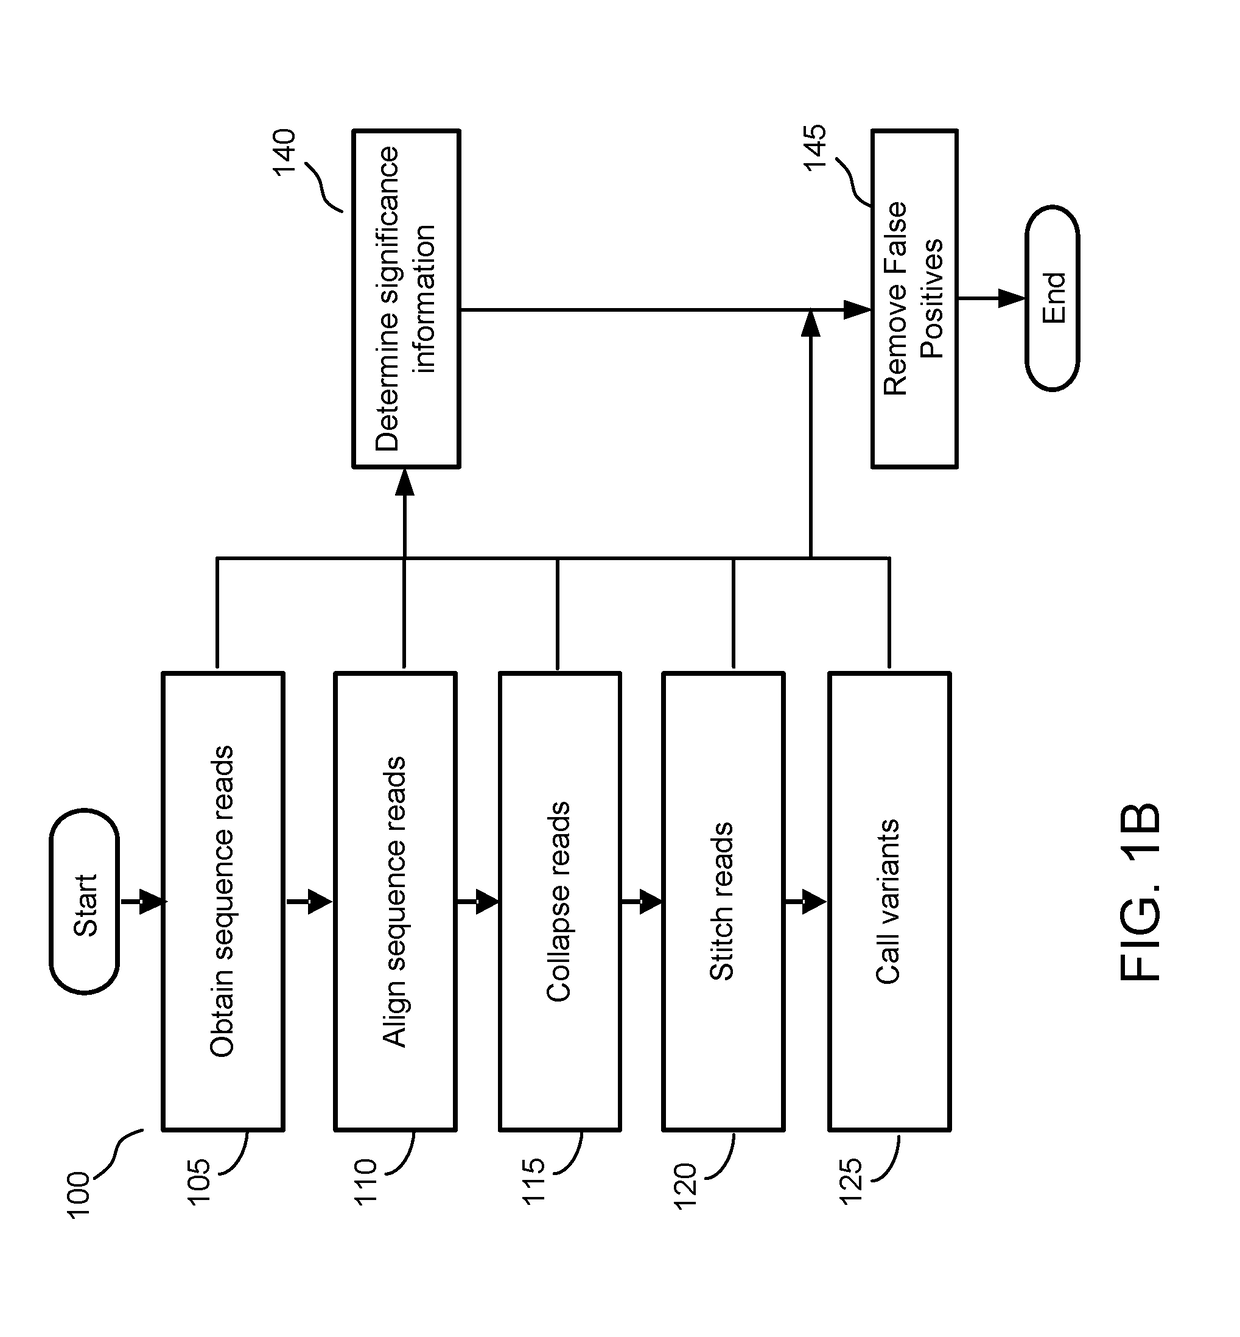
[0138]Each of the samples were processed using the process flow 100 depicted in FIG. 1B and the flow 1200 shown in FIG. 12. First, sequence reads for each sample were obtained (e.g., step 105). Two tubes of whole blood were drawn into Streck blood collection tubes from healthy individuals (self-reported as no cancer diagnosis). After plasma was separated ...

Example

Example 3: False Positive Called Variants Arise from Technical Bias

[0140]Having trained the significance model, the training datasets (e.g., cfDNA training dataset and gDNA training dataset) as well as the cfDNA testing dataset were used to evaluate the significance model. Each of these datasets were applied as input to the significance model to determine significance information that is used to differentiate true variants from false positive variants. The true variants and false positive variants were categorized according to their respective trinucleotide context. For example, FIG. 6A depicts an example graph of the frequency of detected false positives in the cfDNA training dataset as a function of trinucleotide sequences.

[0141]In FIG. 6A, true variants are blocks filled white whereas false positive variants are filled with other patterns or colors. Therefore, FIG. 6A depicts a high proportion of false positive variants for the trinucleotide sequences of ACG, CCG, CGA, CGC, CGG, ...


PUM

PropertyMeasurementUnit
Distanceaaaaaaaaaa
Frequencyaaaaaaaaaa

Abstract

A system and a method are described for applying a noise model for predicting the occurrence and a level of noise that is present in cfDNA read information. The significance model is trained for a plurality of stratifications of called variants using training data in the stratification. Stratifications may include a partition and a mutation type. The significance model predicts the likelihood of observing a read frequency for a called variant in view of two distributions of the significance model. The first distribution predicts a likelihood of noise occurrence in the sample. The second distribution predicts a likelihood of observing a magnitude of the read frequency for the called variant. The two distributions may further depend on a baseline noise level of blank samples. With these two distributions, the significance model, for a particular stratification, more accurately predicts the likelihood of a false positive for a called variant.

Description

CROSS REFERENCE TO RELATED APPLICATIONS[0001]This application claims the benefit of U.S. Provisional Application No. 62 / 553,593 filed Sep. 1, 2017, which is incorporated by reference in its entirety.INTRODUCTION[0002]Analysis of circulating cell free nucleotides, such as cell free DNA (cfDNA) or cell free RNA (cfRNA), using next generation sequencing (NGS) is recognized as a valuable tool for detection and diagnosis of cancer. Identifying rare variants indicative of cancer using NGS requires deep sequencing of circulating cfDNA from a patient test sample. However, deep sequencing has limitations. In particular, errors introduced during sample preparation and sequencing can make accurate identification of rare variants difficult.[0003]A number of different methods have been developed for detecting variants, such as single nucleotide variants (SNVs), in sequencing data. Most conventional methods have been developed for calling variants from DNA sequencing data obtained from a tissue s...

Claims


Application Information

Patent Timeline
IPC IPC(8): G06F19/22G06N99/00G06F19/24
CPCG06N20/00G16B40/00G16B30/00C12Q1/6869G16B40/20G16B20/20G16B30/10C12Q2535/122C12Q2537/165
Inventor SHEN, LINGBARBACIORU, CATALINLIU, QINWEN
Owner GRAIL LLC
Why Eureka
Try Eureka