Imaging nerve function and pathologies

a nerve function and pathology technology, applied in the field of imaging nerve function and pathologies, can solve the problems of limited success studies with white matter bold fmri, demonstrated the ability to image nerve activation, etc., and achieve the effect of increasing the intensity of nerve activity

Active Publication Date: 2019-10-31
WASHINGTON UNIV IN SAINT LOUIS
View PDF0 Cites 4 Cited by
  • Summary
  • Abstract
  • Description
  • Claims
  • Application Information

AI Technical Summary

Benefits of technology

[0011]In one aspect, a computer-implemented method of detecting nerve activity from a time series of diffusion MRI images is provided. The method includes obtaining, using an MRI scanner, a time-series of diffusion MM datasets from a nerve. Each diffusion MM dataset includes a plurality of voxels and associated diffusion MRI signals. The method further includes applying, using a computing device, a diffusion basis spectrum imaging (DBSI) model to each diffusion MRI dataset of the time-series to obtain a time-series of at least one DBSI parameter. The method further includes detecting, using the computing device, the nerve activity at each voxel of the plurality of voxels based on changes in at least one value within the time series of the at least one DBSI parameter according to a nerve activity detection rule. The method further includes transforming, using the computing device, the detected nerve activity into a spatial map of nerve activity at each voxel position of the diffusion MRI dataset, and displaying to a user, using a display device operatively coupled to the computing device, the spatial map of nerve activity. The nerve activity detection rule further includes detecting a nerve activity for at least one of: an increase of a fiber component (ffiber) value above a first threshold value; an increase of a restricted component (fR) value above a second threshold value; a decrease of an axial diffusivity (λ∥) value below a third threshold value; a decrease of a radial diffusivity (λ⊥) value below a fourth threshold value; a decrease of a hindered isotropic spectral component (DH) value below a fifth threshold value; and an increase of a restricted isotropic spectral component (DR) value above a sixth threshold value. In one aspect, the first threshold value is 1% of a total diffusion signal higher than a baseline ffiber value associated with a non-stimulated nerve; the second threshold value is about 0.3% of the total diffusion signal higher than a baseline fR value associated with a non-stimulated nerve; the third threshold value is about 0.06 μm2 / ms less than a baseline λ∥ value associated with a non-stimulated nerve; the fourth threshold value is about 0.02 μm2 / ms less than a baseline fR value associated with a non-stimulated nerve; the fifth threshold value is about 0.1% μm2 / ms less than a baseline DH value associated with a non-stimulated nerve; and the sixth threshold value is about 0.03 μm2 / ms less than a baseline DR value associated with a non-stimulated nerve. In another aspect, the method may further include estimating, using the computing device, an intensity of nerve activation based on changes in at least one value within the time series of the at least one DBSI parameter according to a nerve activity intensity rule. The nerve activity intensity rule includes an empirically-derived relationship between a change in the axial diffusivity (λ∥) value and a nerve activity intensity, wherein further increases of axial diffusivity (λ∥) value below the third threshold value are indicative of increased nerve activity intensity.
[0012]In an additional aspect, a computer-implemented method of detecting optic nerve activity in a human subject from a time series of diffusion MRI images is disclosed that includes obtaining, using an MRI scanner, a time-series of diffusion MM datasets from an optic nerve. Each diffusion MRI dataset includes a plurality of voxels and associated diffusion MM signals. The method also includes applying, using a computing device, a diffusion basis spectrum imaging (DBSI) model to each diffusion MM dataset of the time-series to obtain a time-series of at least one DBSI parameter. The method further includes detecting, using the computing device, the nerve activity at each voxel of the plurality of voxels based on changes in at least one value within the time series of the at least one DBSI parameter according to a nerve activity detection rule. The method also includes transforming, using the computing device, the detected nerve activity into a spatial map of nerve activity at each voxel position of the diffusion MRI dataset, and displaying to a user, using a display device operatively coupled to the computing device, the spatial map of nerve activity. In another aspect, the nerve activity detection rule includes detecting a nerve activity for at least one of: a decrease of an axial diffusivity (λ∥) value below a third threshold value; and a decrease of a radial diffusivity (λ⊥) value below a fourth threshold value. In an additional aspect, the third threshold value is about 0.2 μm2 / ms less than a baseline λ∥ value associated with a non-stimulated nerve; and the fourth threshold value is about 0.3 μm2 / ms less than a baseline λ⊥ value associated with a non-stimulated nerve.
[0013]In yet another aspect, a computer-implemented method of detecting optic nerve pathology in a human subject from a time series of diffusion MRI images. The method includes obtaining, using an MRI scanner, a diffusion MM dataset from an optic nerve, the diffusion MRI dataset comprising a plurality of voxels and associated diffusion MRI signals. The method further includes applying, using a computing device, a diffusion basis spectrum imaging (DBSI) model to the diffusion MRI dataset to obtain at least one DBSI parameter. The method also includes detecting, using the computing device, the optic nerve pathology at each voxel of the plurality of voxels based on at least one value of the at least one DBSI parameter according to a optic nerve pathology detection rule. The method also includes transforming, using the computing device, the detected optic nerve pathology into a spatial map of optic nerve pathology at each voxel position of the diffusion MM dataset, and displaying to a user, using a display device operatively coupled to the computing device, the spatial map of optic nerve pathology. In another aspect, the optic nerve pathology detection rule includes detecting an optic nerve pathology for at least one of: a decrease of an axial diffusivity (λ∥) value below a third threshold value; and an increase of a radial diffusivity (λ⊥) value above a fourth threshold value. In another aspect, the third threshold value is about 0.5 μm2 / ms less than a baseline λ∥ value associated with a non-stimulated nerve; and the fourth threshold value is about 0.1 μm2 / ms greater than a baseline λ⊥ value associated with a non-stimulated nerve.

Problems solved by technology

Despite the continued success of resting-state and task-specific fMRI applications, few have demonstrated the ability to image nerve activation using BOLD fMRI.
By comparison, successful studies with white matter (WM) BOLD fMRI are limited because both blood volume and the tissue's capacity for physiologic modulation of blood flow are considerably less than in grey matter.

Method used


Image

  • Imaging nerve function and pathologies
  • Imaging nerve function and pathologies
  • Imaging nerve function and pathologies

Examples


example 0

ng of Optic Nerve Pathology in Mice

[0140]To compare the effectiveness of the DBSI and DTI analysis models for the detection of optic nerve pathology in mice, the following experiments were conducted.

[0141]Eight 10-week-old female C57BL / 6 mice underwent optic nerve DBSI, followed by a week-long recuperation prior to active immunization for experimental autoimmune encephalomyelitis (EAE). Visual acuity of all mice was assessed daily. Longitudinal DBSI was performed in mouse optic nerves at baseline (naïve, before immunization), before, during, and after the onset of optic neuritis.

[0142]FIG. 19A is an exemplary diffusion-weighted MRI image of the optic nerves of a mouse prior to active immunization. FIGS. 19B and 19C are exemplary diffusion-weighted MRI images of the optic nerves at two stages of optic neuritis. Inset images on each of FIGS. 19A-19C shows a close-up image of the optic nerves.

[0143]FIG. 20A is a bar graph of the mean nerve volumes estimated from the diffusion-weighted ...

example 1

ysis of Human Optic Nerve Activation and Deactivation In Vivo

[0144]To compare the effectiveness of the DBSI and DTI analysis models for the detection of optic nerve function non-invasively in human subjects, the following experiments were conducted.

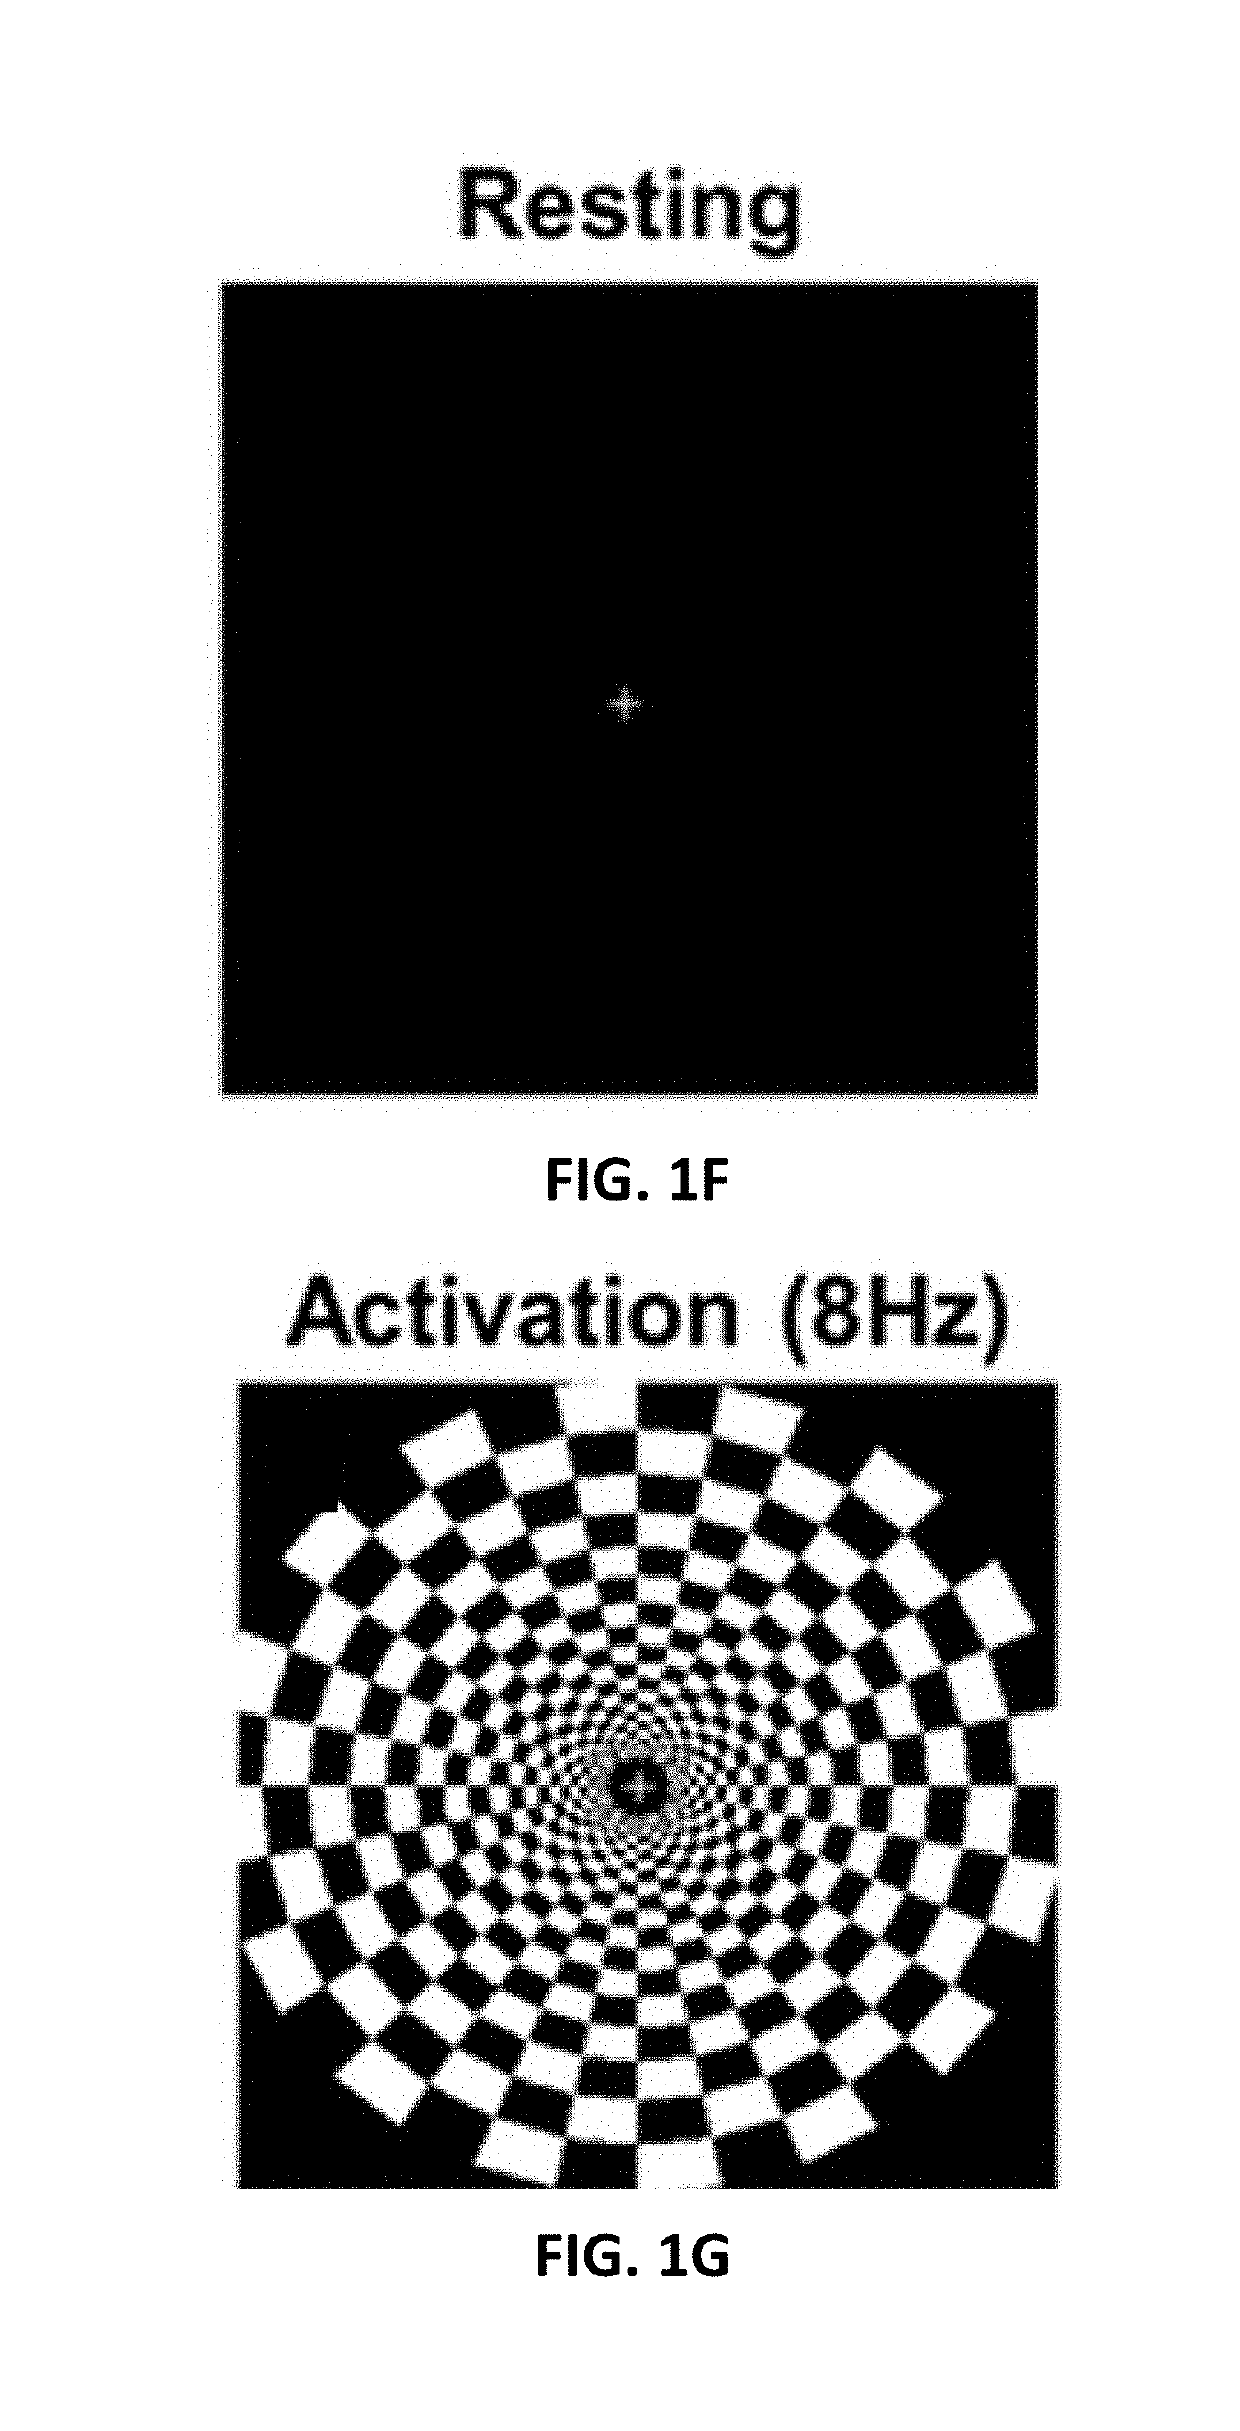
[0145]Single-direction diffusion functional MM (fMRI) has been previously employed to assess activation of mouse optic nerve via decreased apparent diffusion coefficient perpendicular to axonal fibers (ΔADC⊥) during flashing-light visual or direct electrical stimulation. Unlike blood-oxygen level dependent (BOLD) fMRI, the stimulation-induced ΔADC⊥ was found to be independent of vascular effects using diffusion functional MRI. This functional fMRI response (ΔADC⊥) was found to be attenuated in optic nerves from mice with optic neuritis.

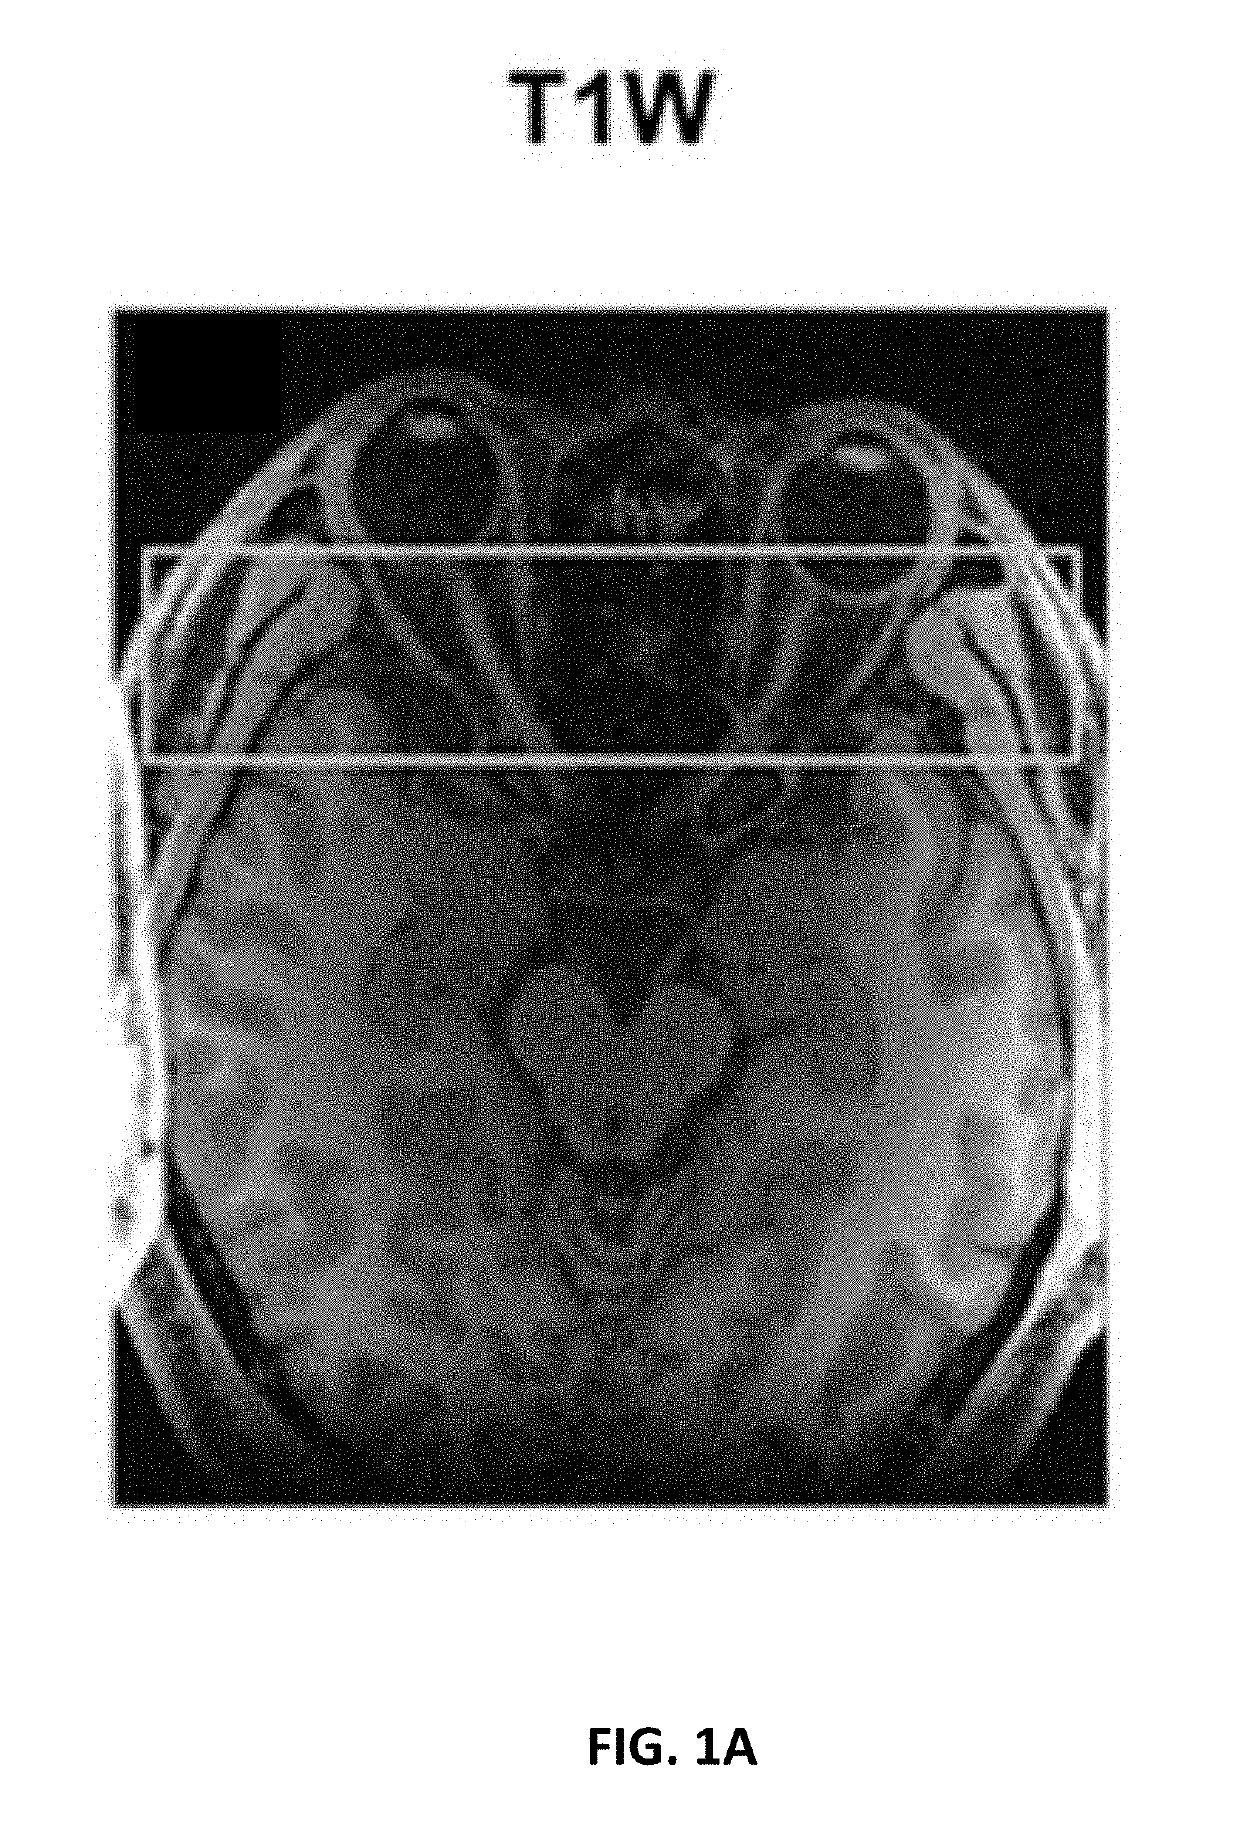
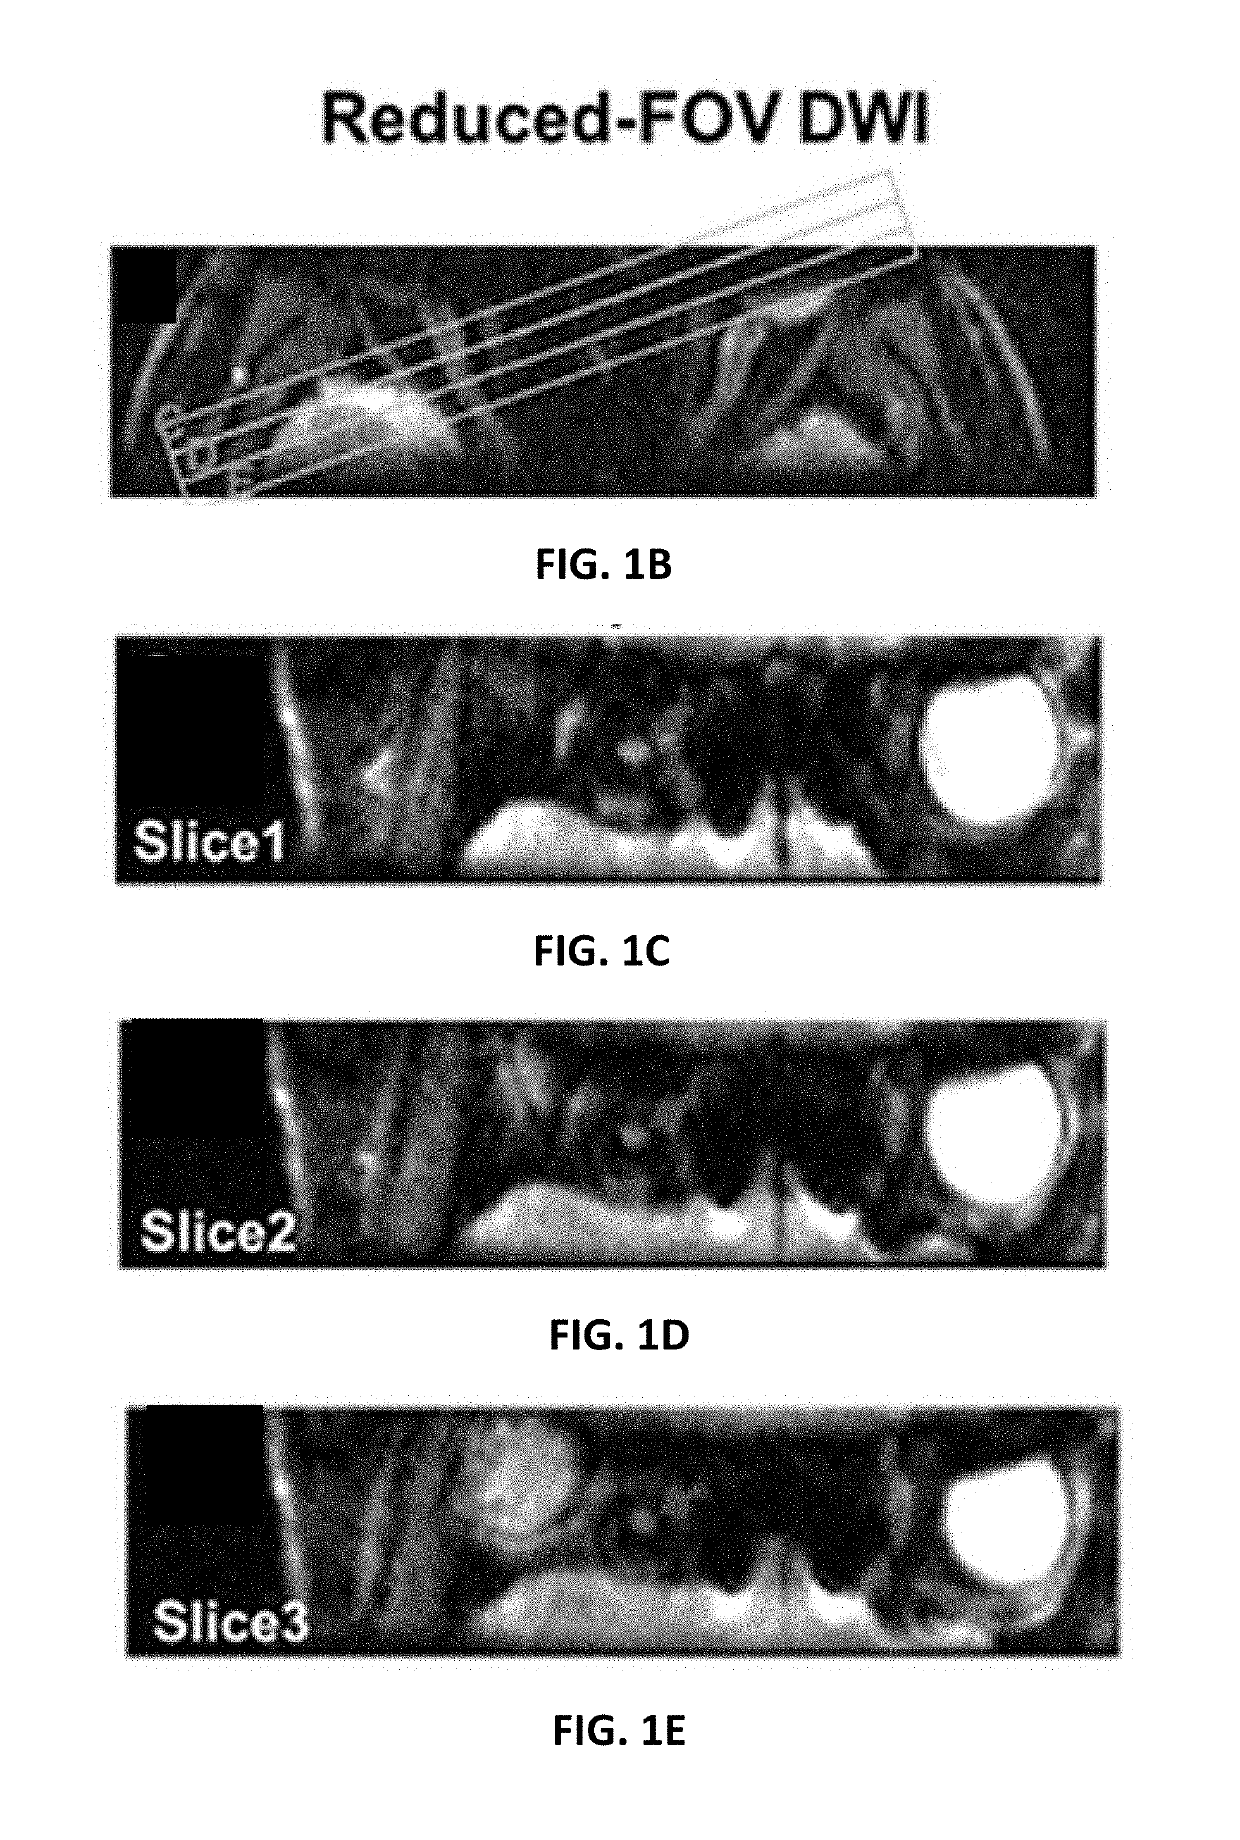
[0146]In this experiment, diffusion-weighted imaging (DWI) measurements were performed in human optic nerves with visual stimulation and the data were analyzed using diffusion basis spectrum imaging (DBSI) ...

example 2

n of DTI, DBSI and T2 Spectral Analysis of Frog Sciatic Nerve Activation and Deactivation Ex Vivo

[0154]To demonstrate the ability to perform function imaging of neuronal activity using DBSI and T2 spectral methods, the following experiments were conducted. The experiments were carried out on perfused, ex vivo frog sciatic nerves, which due to their extreme robustness have been the subject of numerous electrophysiology and MM studies.

[0155]Methods

[0156]Frog Nerve Preparation

[0157]Jumbo bullfrogs (Rana catesbeiana) were purchased from Rana Ranch (Twin Falls, Id.) and housed in a climate-controlled environment with a 12 / 12 hr-light / dark cycle. The animal housing consisted of a standard clear plastic container [18″(1)×10″(w)×10″(h)] holding 1.5 L of water and tipped at an angle to provide a dry area within the cage. Frogs were fed pelleted chow (5LP3, Lab Diet, St. Louis, Mo.) three times per week.

[0158]Frogs were anesthetized in a solution of tricaine methanesulfonate (Sigma-Aldrich, S...


PUM


Abstract

Repetitive electrical activity produces microstructural alteration in myelinated axons. These transient microstructural changes can be non-invasively visualized via two different magnetic-resonance-based approaches: diffusion fMRI and dynamic T2 spectroscopy in the ex vivo perfused bullfrog sciatic nerves. Non-invasive diffusion fMRI, based on standard diffusion tensor imaging (DTI), clearly localized the sites of axonal conduction blockage as might be encountered in neurotrauma or other lesion types. Diffusion fMRI response was graded in proportion to the total number of electrical impulses carried through a given locus. Diffusion basis spectrum imaging (DBSI) method revealed a reversible shift of tissue water into a restricted isotropic diffusion signal component, consistent with sub-myelinic vacuole formation.

Description

CROSS-REFERENCE TO RELATED APPLICATION[0001]This application claims the benefit of priority to U.S. Provisional Application No. 62 / 663,816, filed Apr. 27, 2018, which is hereby incorporated by reference herein in its entirety.STATEMENT OF GOVERNMENTAL SUPPORT[0002]This invention was made with government support under grants U01EY025500, R01NS047592, and P01NS059560 awarded by the National Institutes of Health. The government has certain rights in the invention.BACKGROUND[0003]BOLD functional MRI has been extremely successful and forms the basis of the NIH-supported Human Connectome Project. Despite the continued success of resting-state and task-specific fMRI applications, few have demonstrated the ability to image nerve activation using BOLD fMRI. Diffusion-weighted MRI has recently been proposed to image brain function as those seen by BOLD fMRI, without a consensus in its utility or mechanisms.[0004]Blood oxygen-level-dependent functional magnetic resonance imaging (BOLD fMRI) ha...

Claims


Application Information

Patent Timeline
Patent Type & Authority Applications(United States)
IPC IPC(8): A61B5/00A61B5/055G01R33/563G01R33/56
CPCA61B5/055A61B5/0042G01R33/5608G01R33/56341A61B5/742A61B5/4041G01R33/4806A61B5/24
Inventor SONG, SHENG-KWEISPEES, WILLIAM M.LIN, TSEN-HSUANSUN, PENGSONG, CHUNYU
Owner WASHINGTON UNIV IN SAINT LOUIS
Why Eureka
Try Eureka