Biosensor for Conformation and Secondary Structure Analysis
a biosensor and conformational technology, applied in the direction of material analysis, fluorescence/phosphorescence, instruments, etc., can solve the problems of sample discrimination based on the specific structural composition of an analyzed compound, inability to detect structure information, and inability to provide direct information about the secondary structure of analytes by the techniqu
- Summary
- Abstract
- Description
- Claims
- Application Information
AI Technical Summary
Benefits of technology
Problems solved by technology
Method used
Image
Examples
example 1
of the Amide I Band in Aß with Silane-Coupled Linkers
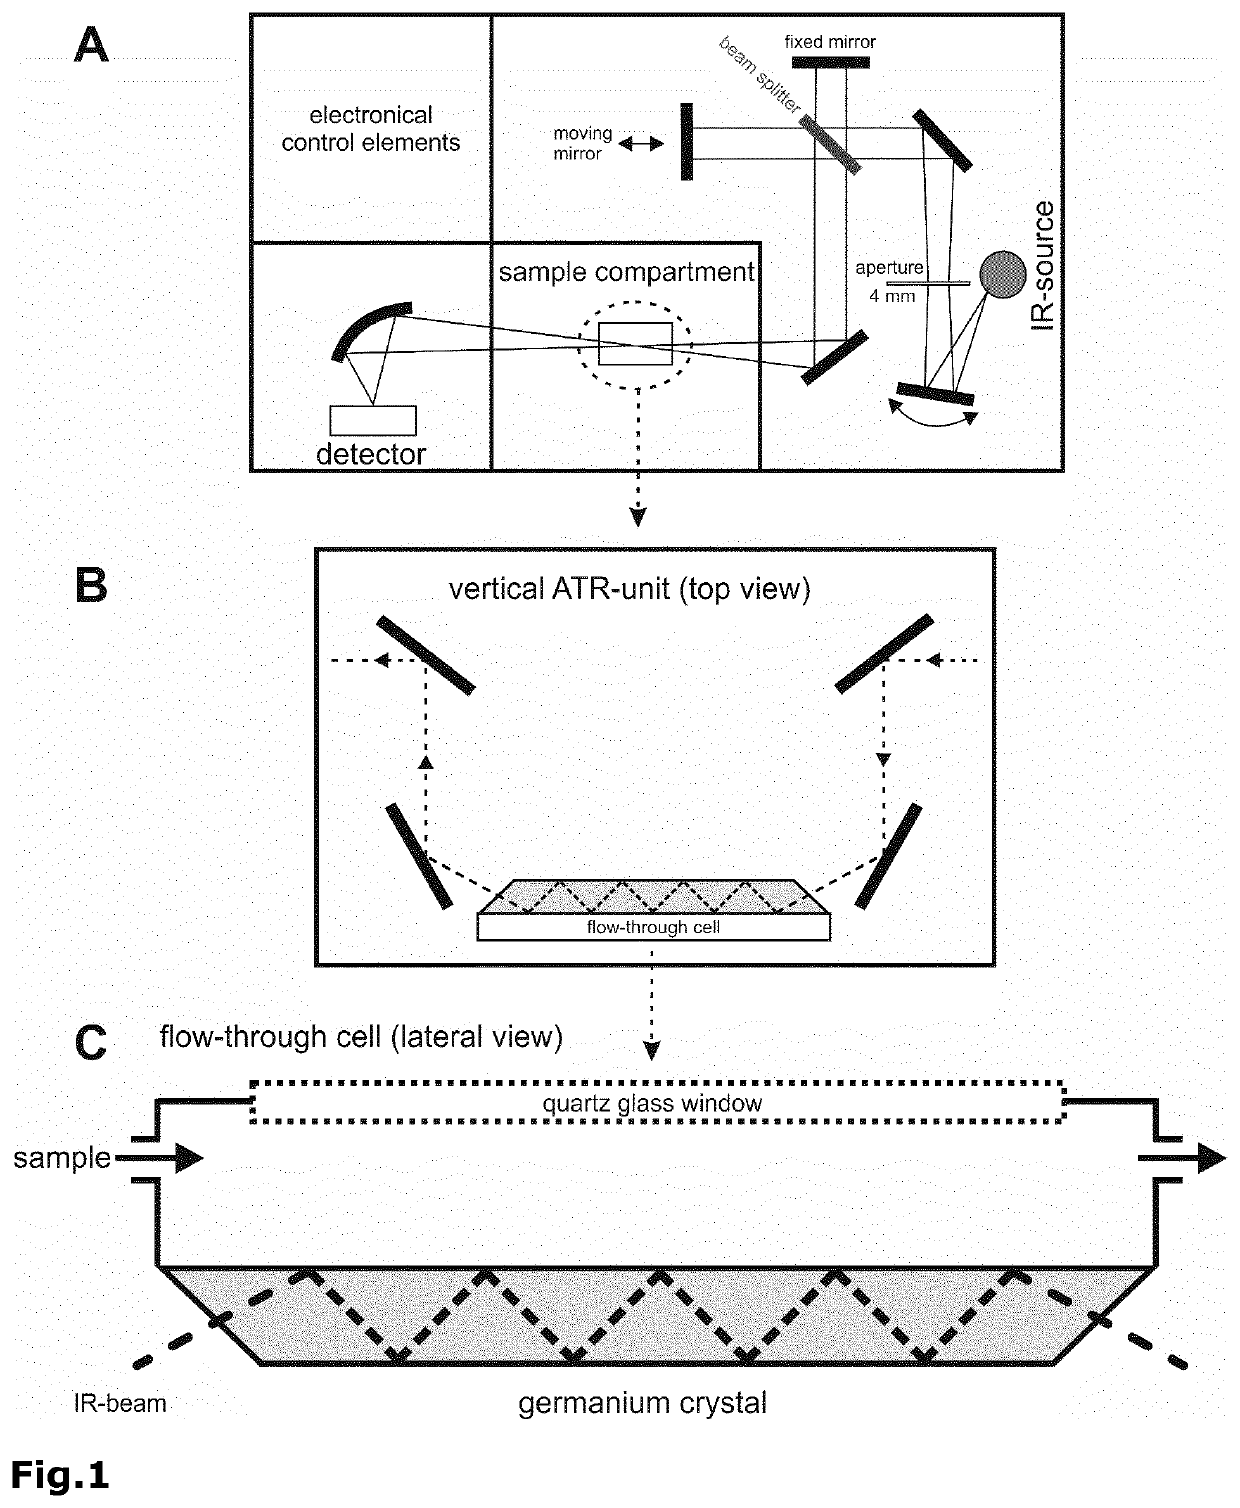
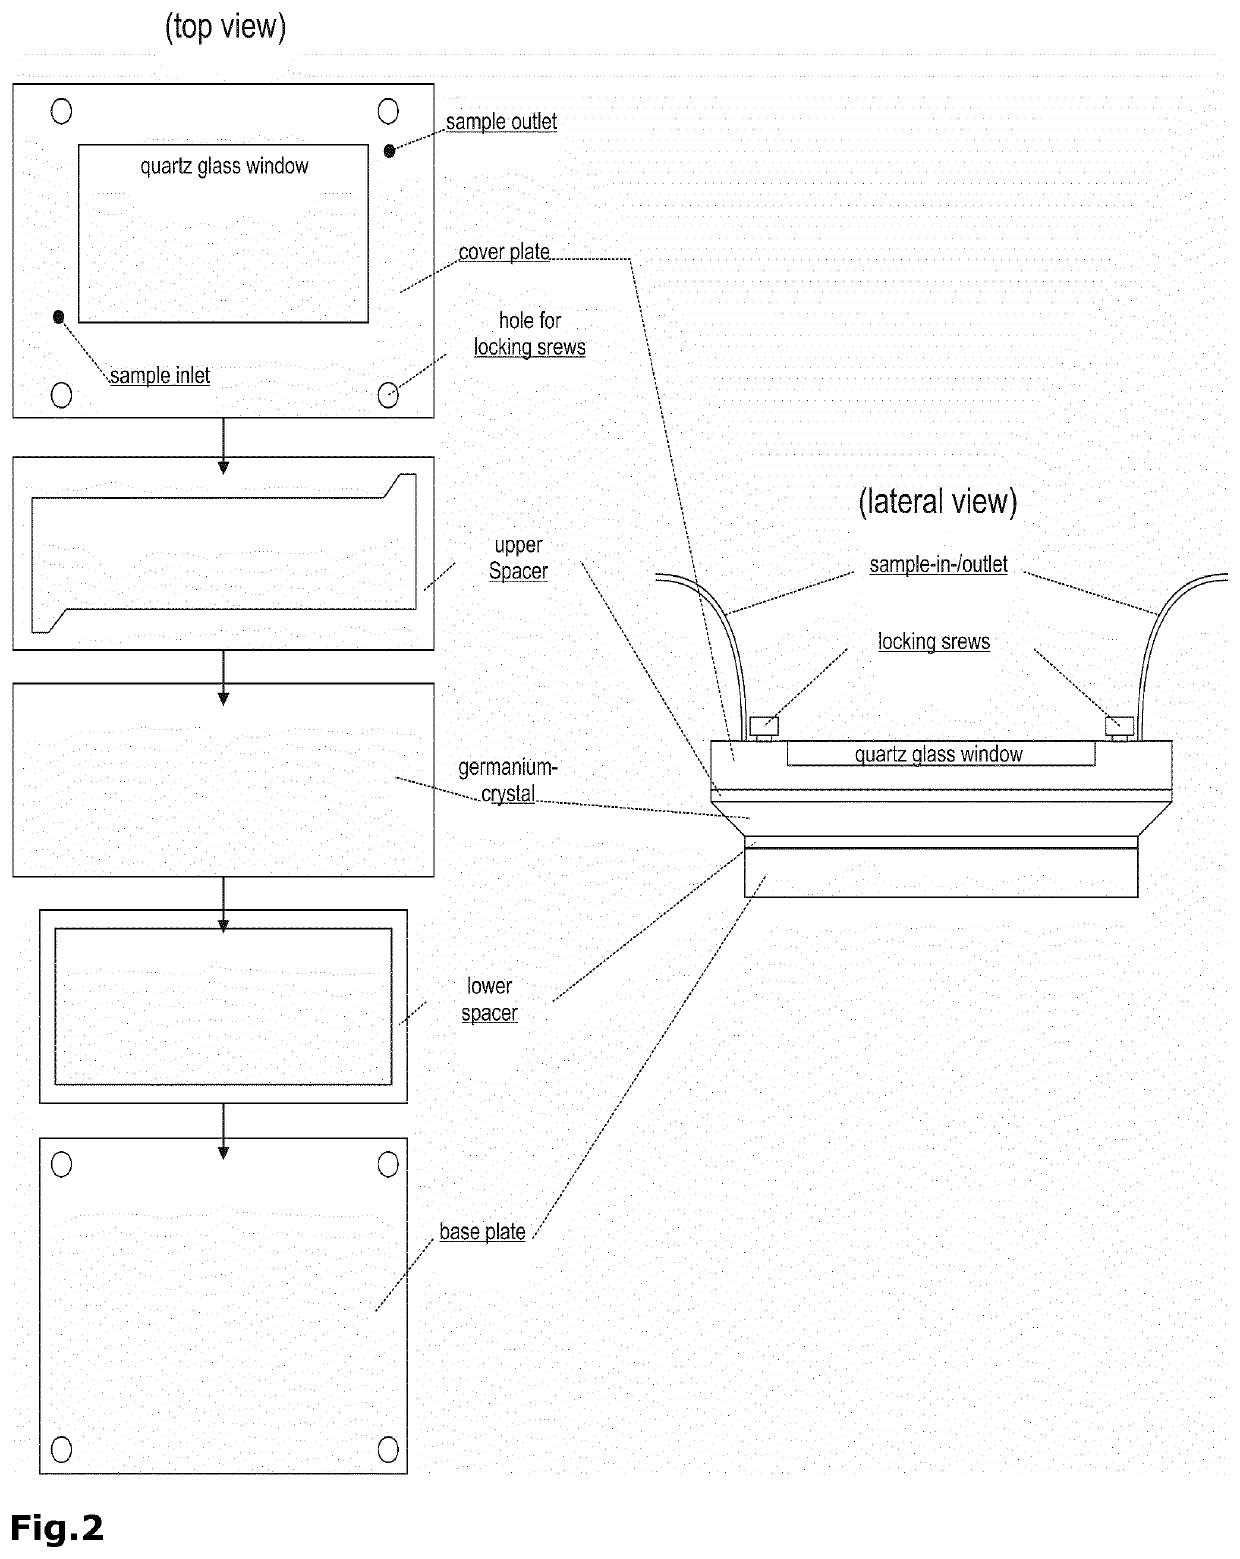
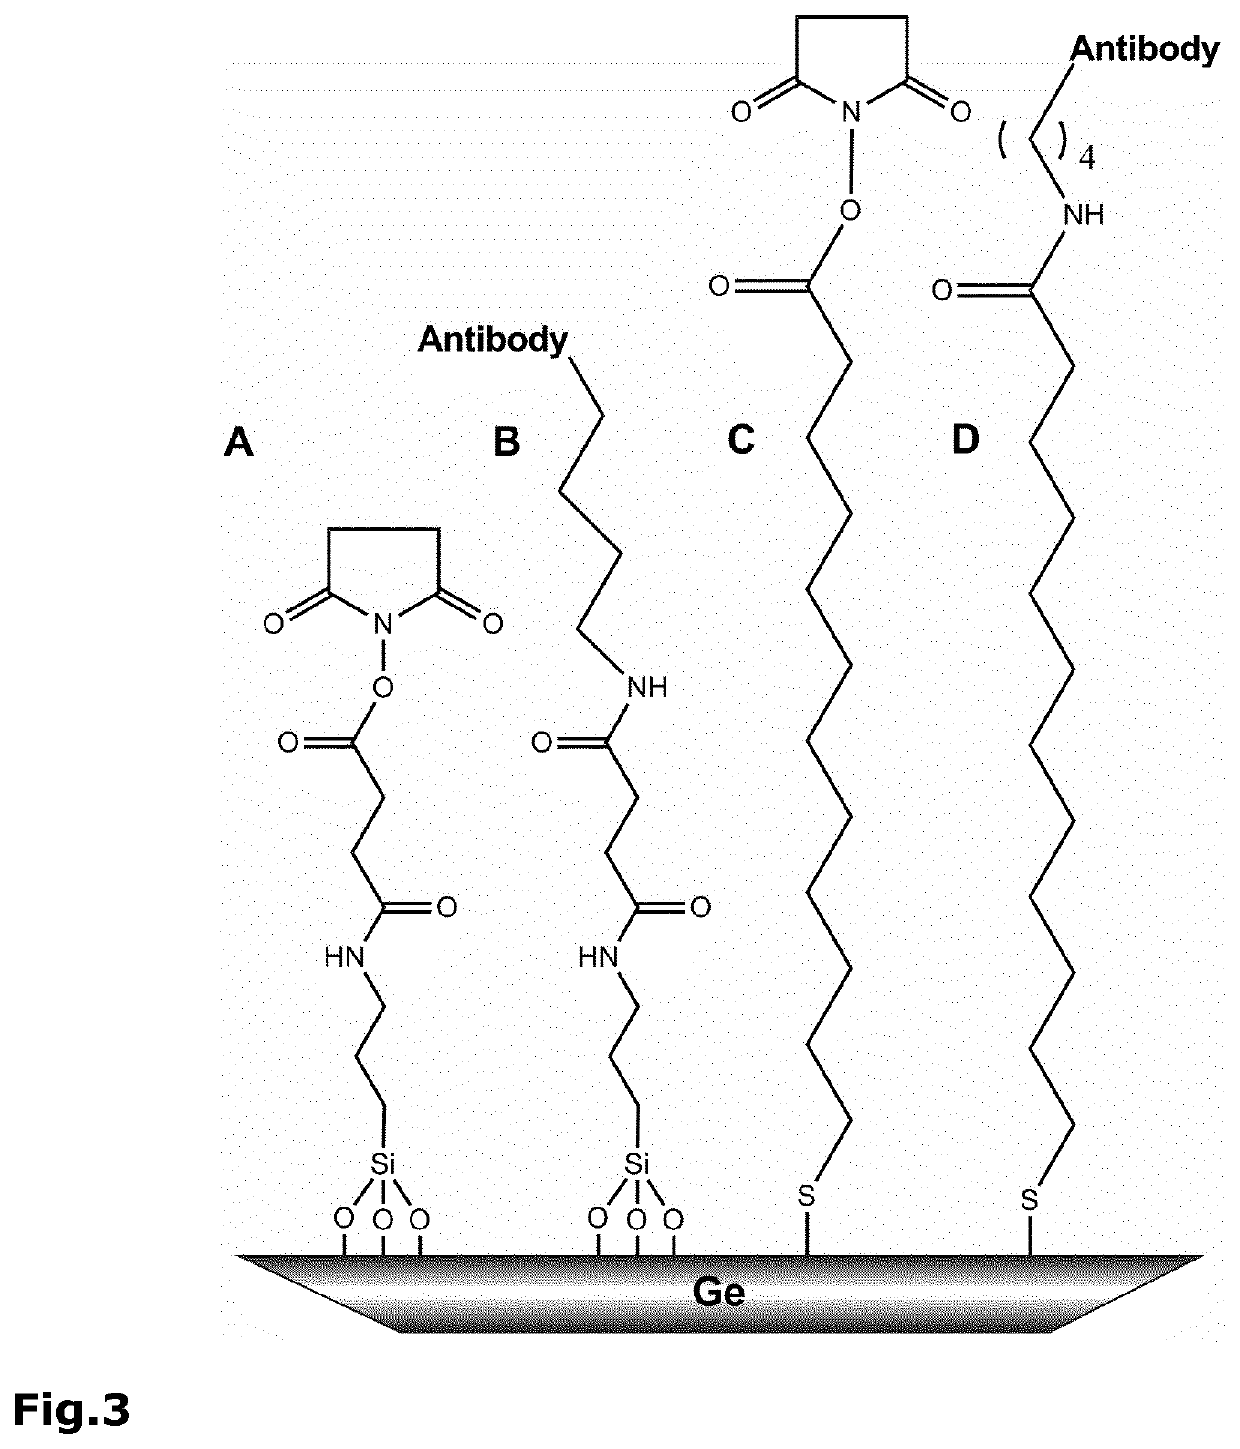
[0119]The specific sensitivity of the established sensor setup (FIG. 1, 2) is defined by the antibody. By using fluorescence microscopy it was possible to determine fluorescence only if the FITC coupled antibody 8G7 was attached onto the surface. The control did not reveal any fluoresecence (FIG. 4). The antibody 8G7-FITC was attached covalently to the amine-reactive silane surface (FIG. 3 A, B) and could not be removed by washing with buffer (FIG. 4 C). Another tested antibody 1E8 did not show any fluorescence (FIG. 4 E). After blocking open, nonspecific binding sites with casein, no further binding of the 8G7 was observed, which shows that 8G7 neither binds to casein nor to 1E8. If looking on 8G7-FITC as a protein in general, this experiment shows the silane surface being shielded from unspecific interaction with the contained proteins in the sample.
[0120]Only after the incubation with the Aß1-42 peptide, a fluorescence signal w...
example 2
of Aß Peptide Structure in CSF of Alzheimer's Disease (AD) Patients and a Control Group, Extended Data Set of 37 AD and 63 Controls
[0126]The original exemplary analysis of 20 samples was extended to 100 patients. The average conformation of Aß peptides, as present in CSF, exhibited a higher amide I band frequency in the control than the AD group (FIG. 9A). This indicated a predominant alpha-helical fold in the control, whereas the AD group already exhibits an enriched beta-sheet component. Using the amide I band frequency as indicator, 1643 cm−1 so far represents the optimum threshold for discrimination of the classes with an accuracy of 92%, a sensitivity of 95%, and specificity of 90%. The according receiver operator characteristic (ROC) curve depicts an area under curve (AUC) of 0.93 (FIG. 9B).
example 3
on for the Analysis of Aß Peptide Structure in EDTA-Stabilized Blood Plasma of 35 AD and 61 Control Patients
[0127]As with CSF, the average conformation of Aß peptides detected in blood plasma exhibited a higher amide I band frequency in the control than the AD group (FIG. 10A). This indicated the same disease influence on the blood-borne Aß peptide fraction. Again, 1643 cm−1 represents the optimum frequency threshold for discrimination of the classes with an accuracy of 89%, a sensitivity of 80%, and specificity of 93%. The according ROC curve depicts an AUC of 0.85 (FIG. 10B).
[0128]In Examples 2 and 3 CSF samples of 37 AD and 63 control patients, and blood plasma samples of 35 AD and 61 control patients were analysed.
[0129]The according histogram and box plots confirmed the findings with well differentiated maxima of the distributions (FIG. 11). All classes were well approximated with a Gaussian normal distribution. The average band positions of the CSF control and AD classes did n...
PUM
 Abstract
Description
Claims
Application Information
 - R&D
- Intellectual Property
- Life Sciences
- Materials
- Tech Scout
- Unparalleled Data Quality
- Higher Quality Content
- 60% Fewer Hallucinations
Browse by: Latest US Patents, China's latest patents, Technical Efficacy Thesaurus, Application Domain, Technology Topic, Popular Technical Reports.
© 2025 PatSnap. All rights reserved.Legal|Privacy policy|Modern Slavery Act Transparency Statement|Sitemap|About US| Contact US: help@patsnap.com


