

Methods for comparative metagenomic analysis
a metagenomic analysis and comparative technology, applied in the field of metagenomic analysis, can solve the problems of large data volume and time-consuming analysis using traditional sequence comparison methods, unable to scale for large studies, and consuming local resources such as memory and disk, unable to achieve the effect of large-scale studies
- Summary
- Abstract
- Description
- Claims
- Application Information
AI Technical Summary
Benefits of technology
Problems solved by technology
Method used
Image

Examples
example 1
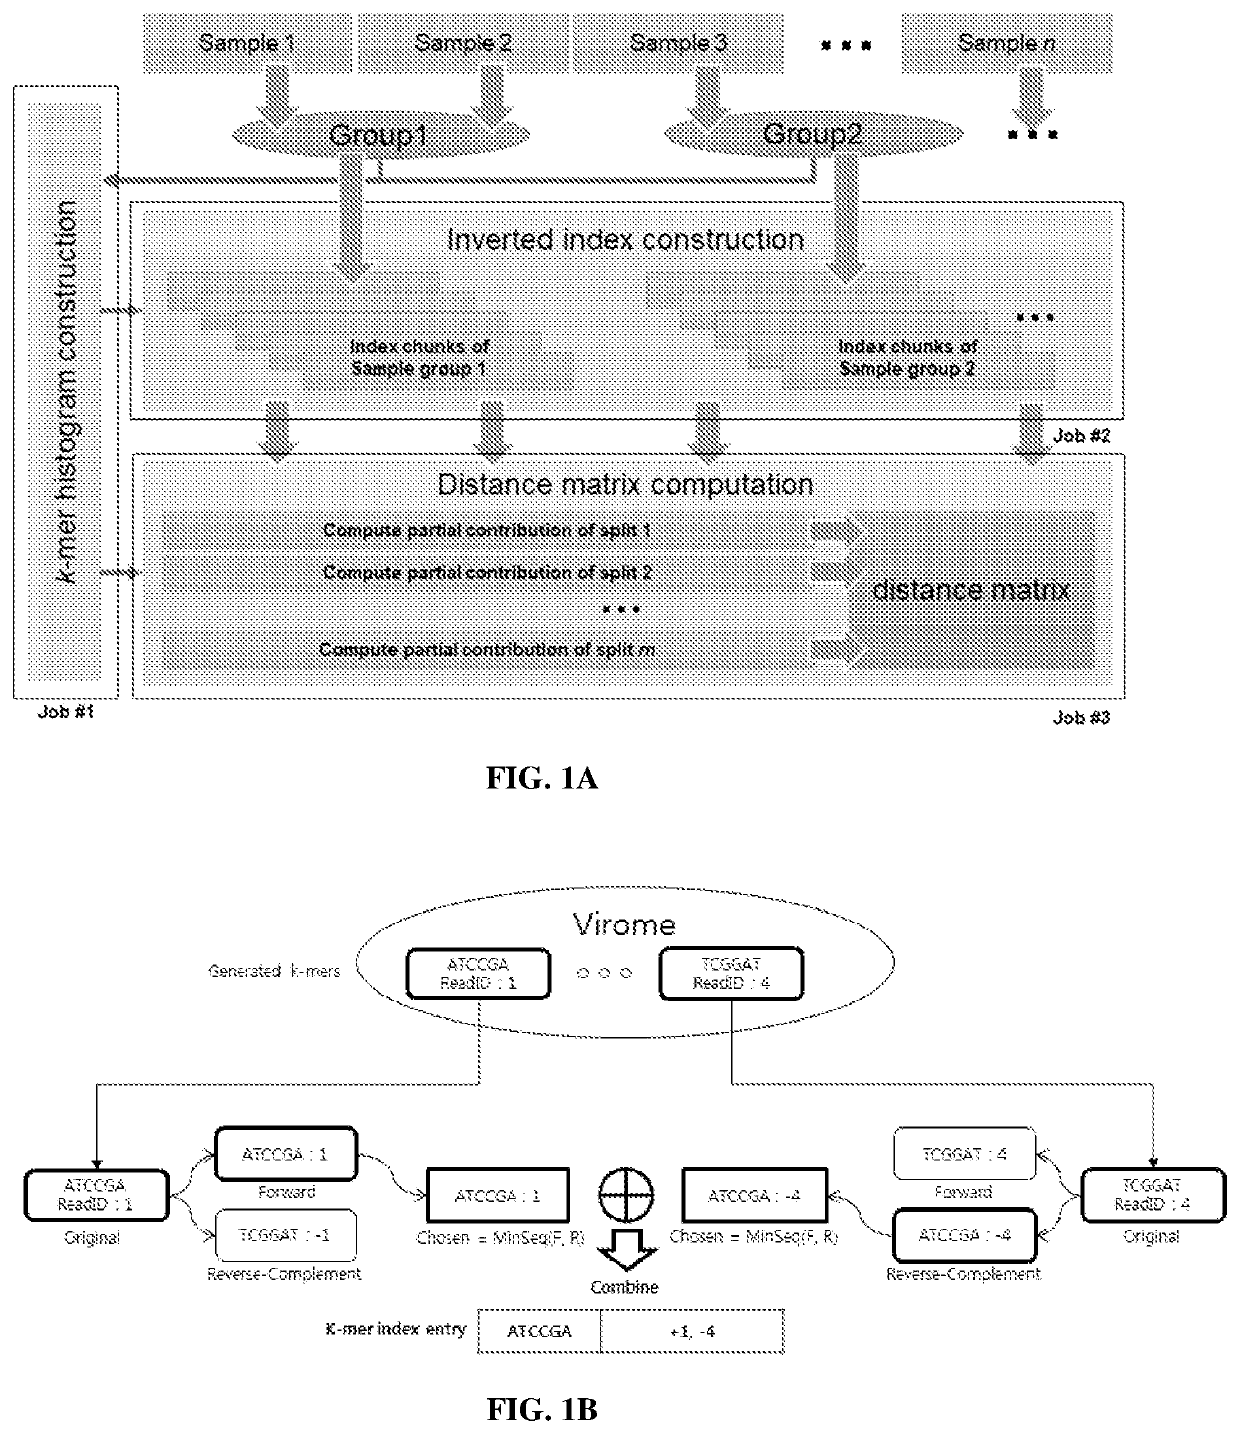
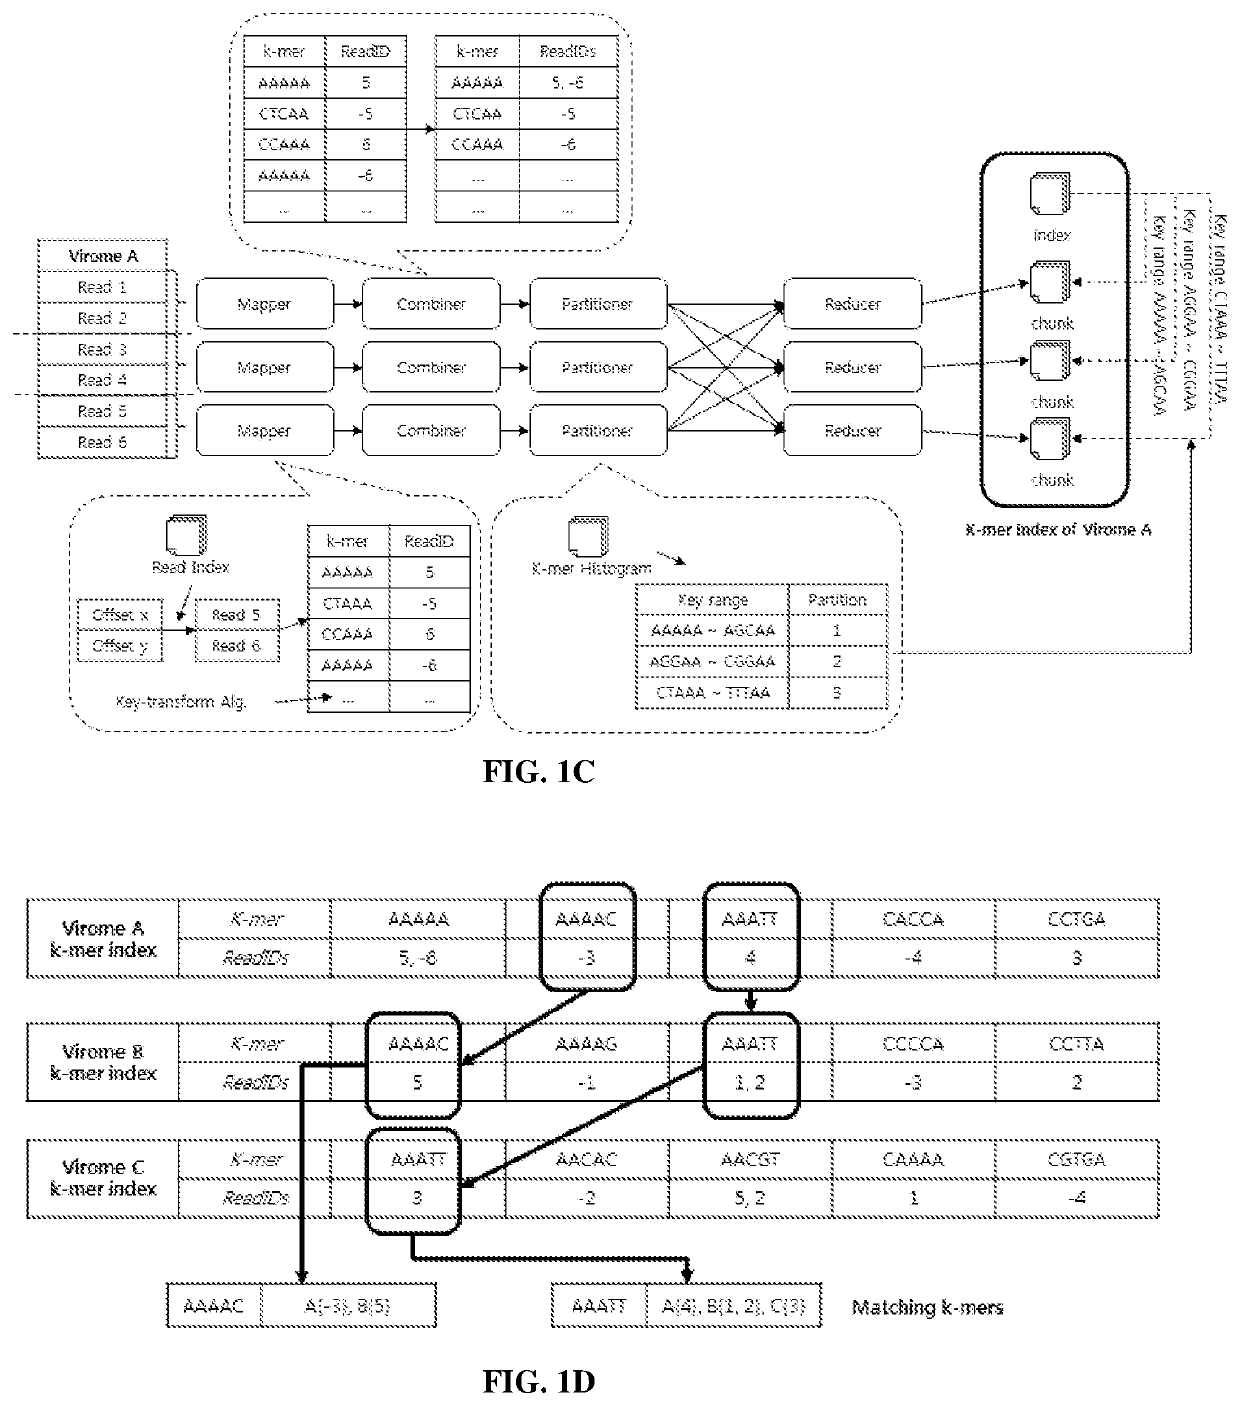
putational Strategy
Materials and Methods
[0172]Experiment Environment Description
[0173]Hadoop Cluster Configuration.
[0174]The Libra experiments described below were performed on a Hadoop cluster consisting of 10 physical nodes (9 MapReduce worker nodes). Each node contains 12 CPUs and 128 GB of RAM, and is configured to run a maximum of 7 YARN containers simultaneously with 10 GB of RAM per container. The remaining system resources are reserved for the operating system and other Hadoop services such as Hive or Hbase.
[0175]Libra Algorithm Description.
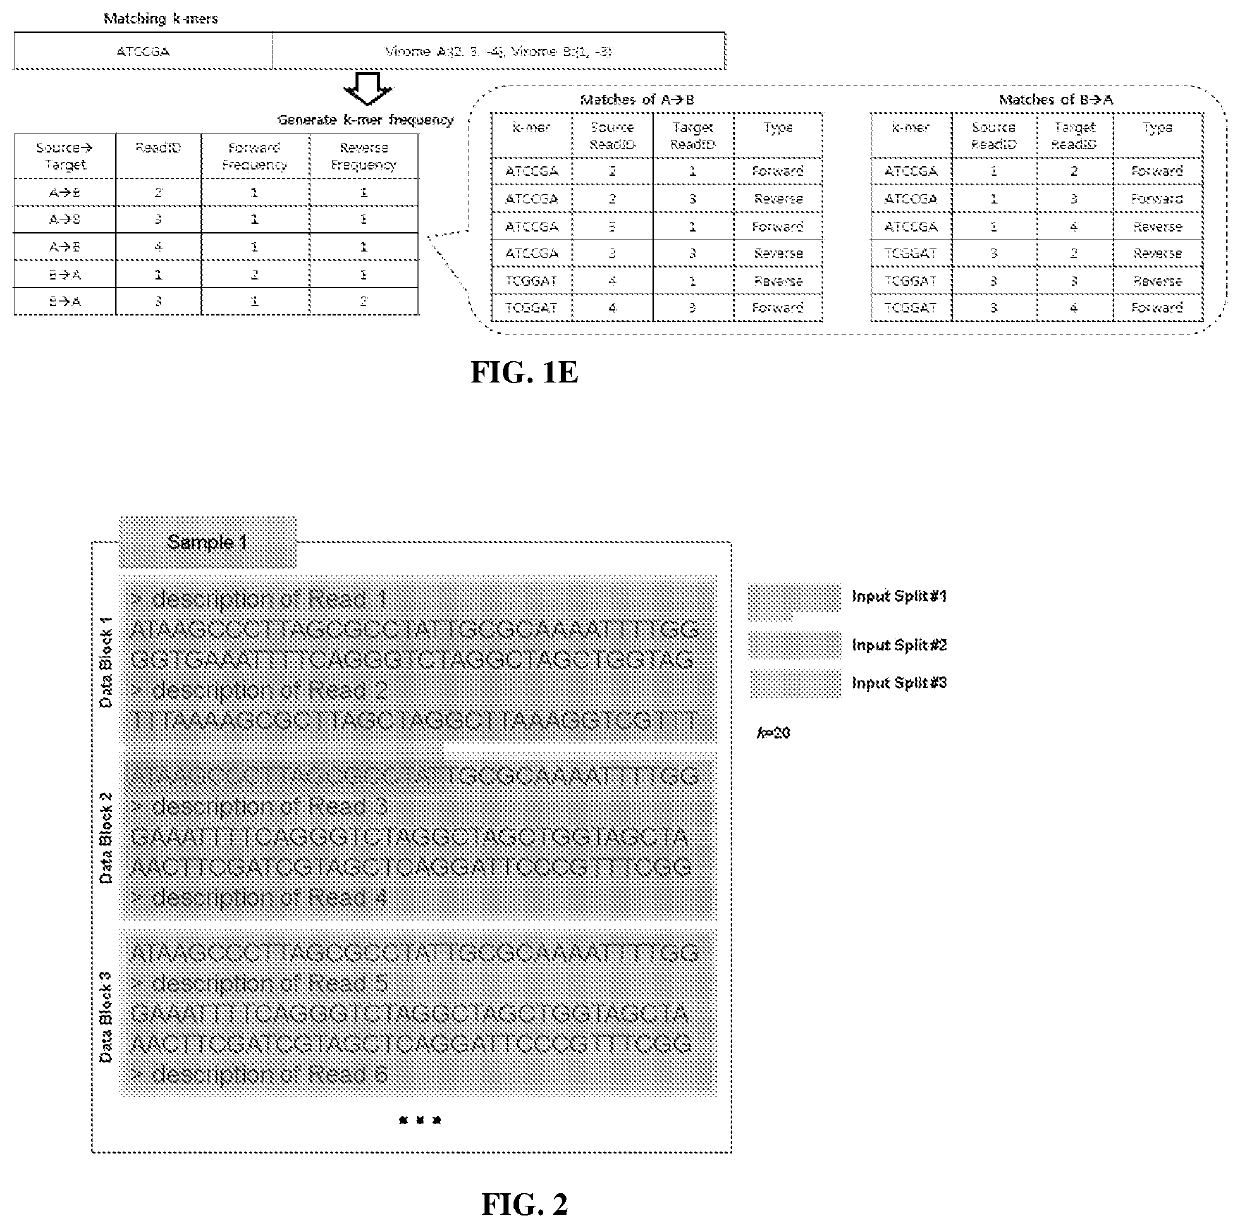
[0176]K-Mer Size.
[0177]There are several considerations for choosing the k-mer size k. Larger values of k result in fewer matches due to sequencing errors and fragmentary metagenomic data. However, smaller values of k give less information about the sequence similarities. In Libra, k is a configurable parameter chosen by the user. For the analysis in experiments described below, k was set to equal 20. This value has been determined in the...
example 2
Genetic Distance Between Simulated Metagenomes
Materials and Methods
[0209]Staggered Mock Community.
[0210]Given that the above mixtures represented just two bacteria and most metagenomes are more complex, DNA from a staggered mock community obtained from the Human Microbiome Consortium were also sequenced. The staggered mock community is comprised of genomic DNA from a variety of genera commonly found on or within the human body, consisting of 1,000 to 1,000,000,000 16S rRNA gene copies per organism per aliquot. The resulting DNA was subjected to whole genome sequencing as described below under WGS sequencing. The sequence data comprised of ˜80 million reads have been deposited to the NCBI Sequence Read Archive under accession: SRP115095 under project accession PRJNA397434.
[0211]Simulated Data Derived from the Staggered Mock Community.
[0212]The resulting sequence data from the staggered mock community (˜80 million reads) were used to develop simulated metagenomes to test the effects o...
example 3
Distinguish Controlled Mixtures of Bacteria by Genetic Composition and Abundance
Materials and Methods
[0217]Binary Mixtures of Bacteria.
[0218]To determine the sensitivity of Libra binary mixtures were created from purified bacterial DNA purchased from American Type Culture Collection (ATCC) isolated from: 1) Escherichia coli (ATCC 25922D-5) and Staphylococcus saprophyticus (15305D-5); 2) Streptococcus pyogenes (ATCC 12344D-5) and Staphylococcus saprophyticus (15305D-5); 3) Escherichia coli (ATCC 25922D-5) and Shigella flexneri (ATCC 29903D-5); and 4) methicillin-sensitive Staphylococcus aureus (MSSA, ATCC BAA-1718D-5) and methicillin-resistant S. aureus (MRSA, ATCC BAA-1717D-5). Bacterial mixtures represent phylogenetically diverse bacteria from least to most similar. DNA was resuspended in sterile phosphate buffered saline, quantitated from absorption at 260 nanometers using a NanoDrop ND-1000 spectrophotometer, and used to create binary mixtures of the following ratios by mass: 0.1...
PUM
 Abstract
Description
Claims
Application Information