Nucleic acid memory (NAM) / digital nucleic acid memory (DNAM)
Pending Publication Date: 2022-01-27
BOISE STATE UNIVERSITY
0 Cites 0 Cited by
AI-Extracted Technical Summary
Problems solved by technology
Detection of individual nucleotide molecules using SRM is routinely limited by incomplete staple s...
Benefits of technology
[0010]In another aspect, error-correcting algorithms are used to ensure error-free data recovery. Detection of individual nucleotide molecules using SRM is routinely limited by incomplete staple strand incorporation, defective imager strands, fluorophore bleaching, and background fluorescence. In one embodiment, the signal-to-noise ratio is improved by averaging multiple images of identical structures. In a more preferred embodiment, encoding and decoding algorithms that combine fountain codes with bi-level, parity-based, and orientation-invariant error detection scheme may be utilized. Fountain codes enable transmission of data over noisy channels. They work by dividing a data file into smaller units called droplets and then sending the droplets at random to a receiver. Droplets can be read in any order and still ...
Abstract
Compositions and methods for encoding and retrieving data into nucleic acid memory for storage. More specifically, data is encoded into spatial locations within a nucleic acid architecture, which allows the data to be retrieved using super resolution microscopy. The data is then interrogated for errors, the errors corrected, and the data is then decoded.
Application Domain
Microbiological testing/measurementDigital storage +1
Technology Topic
Molecular biologyNucleic acid structure +4
Image
Examples
- Experimental program(1)
Example
Example 1
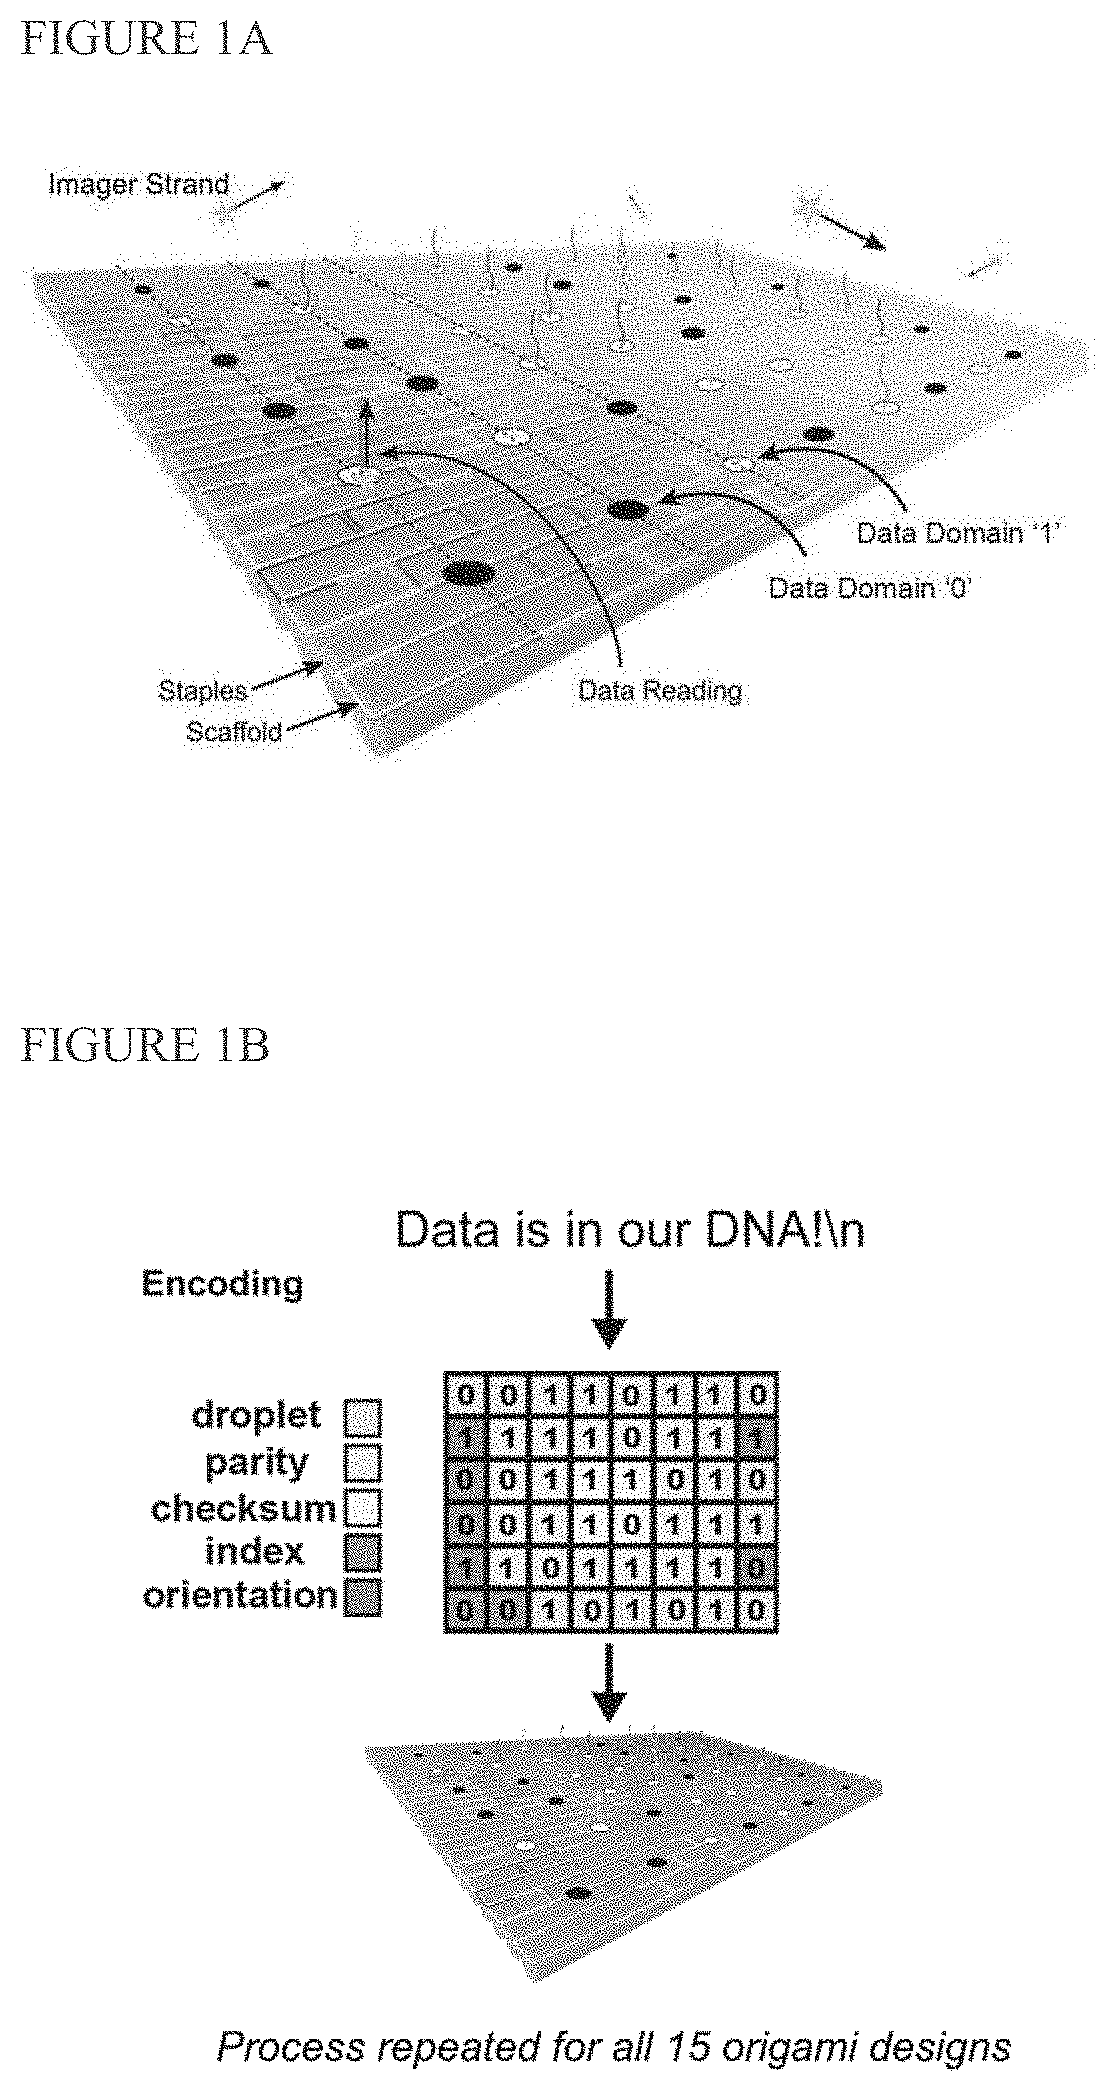
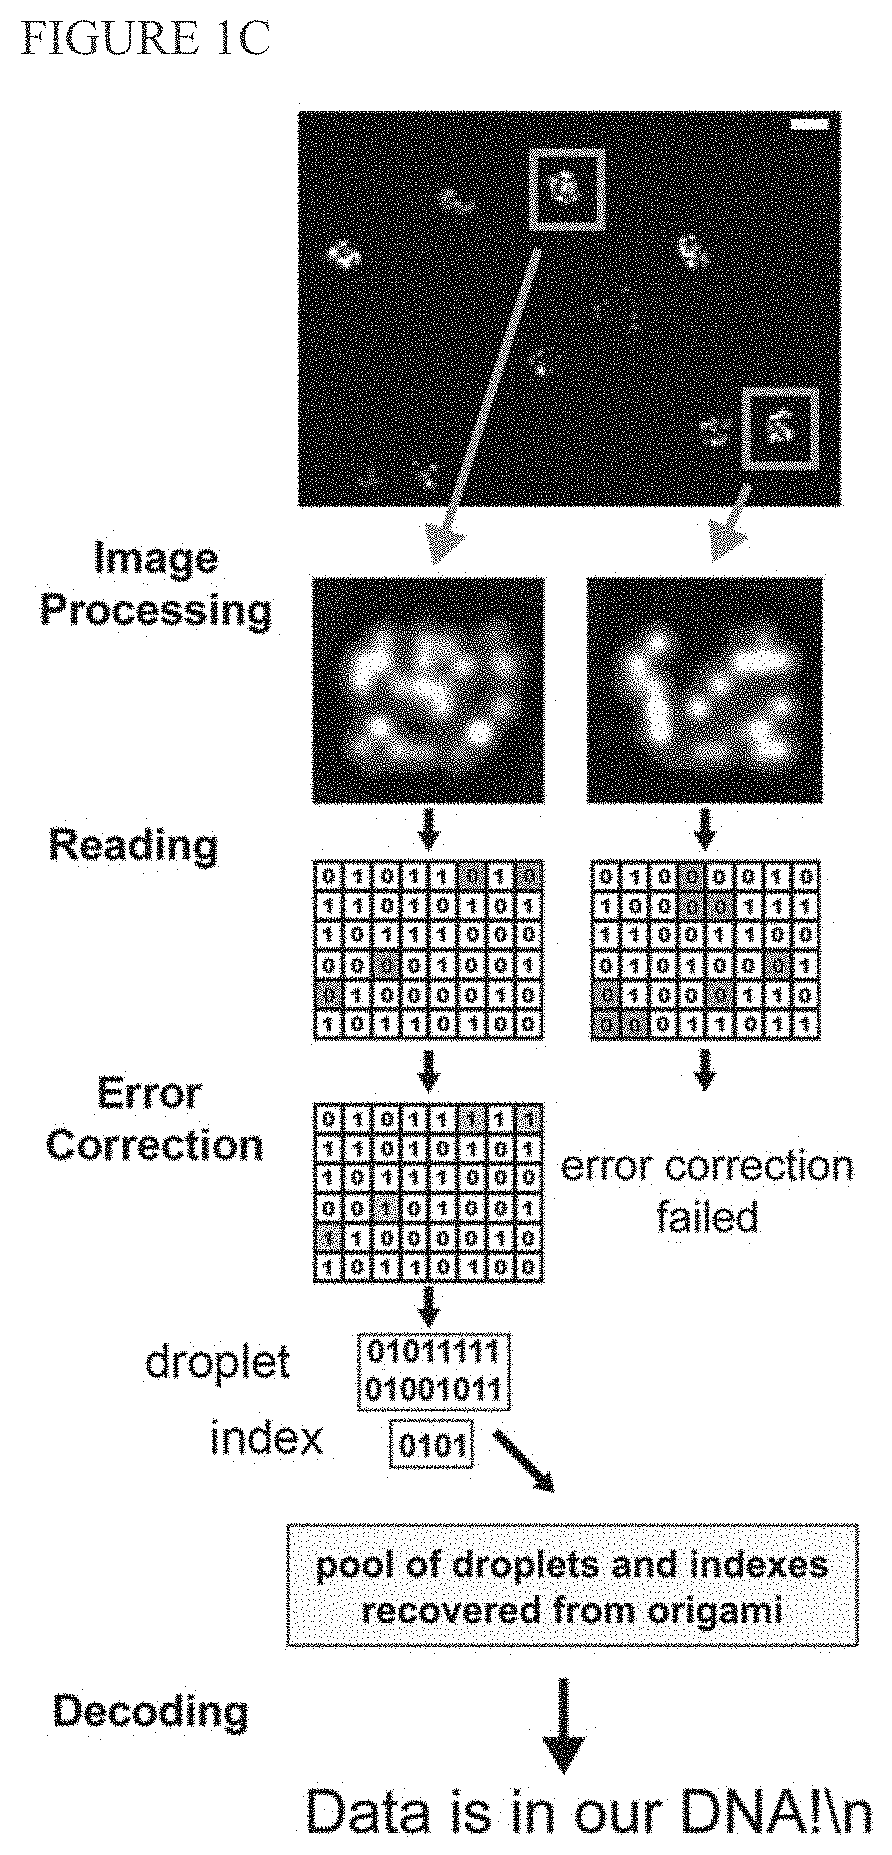
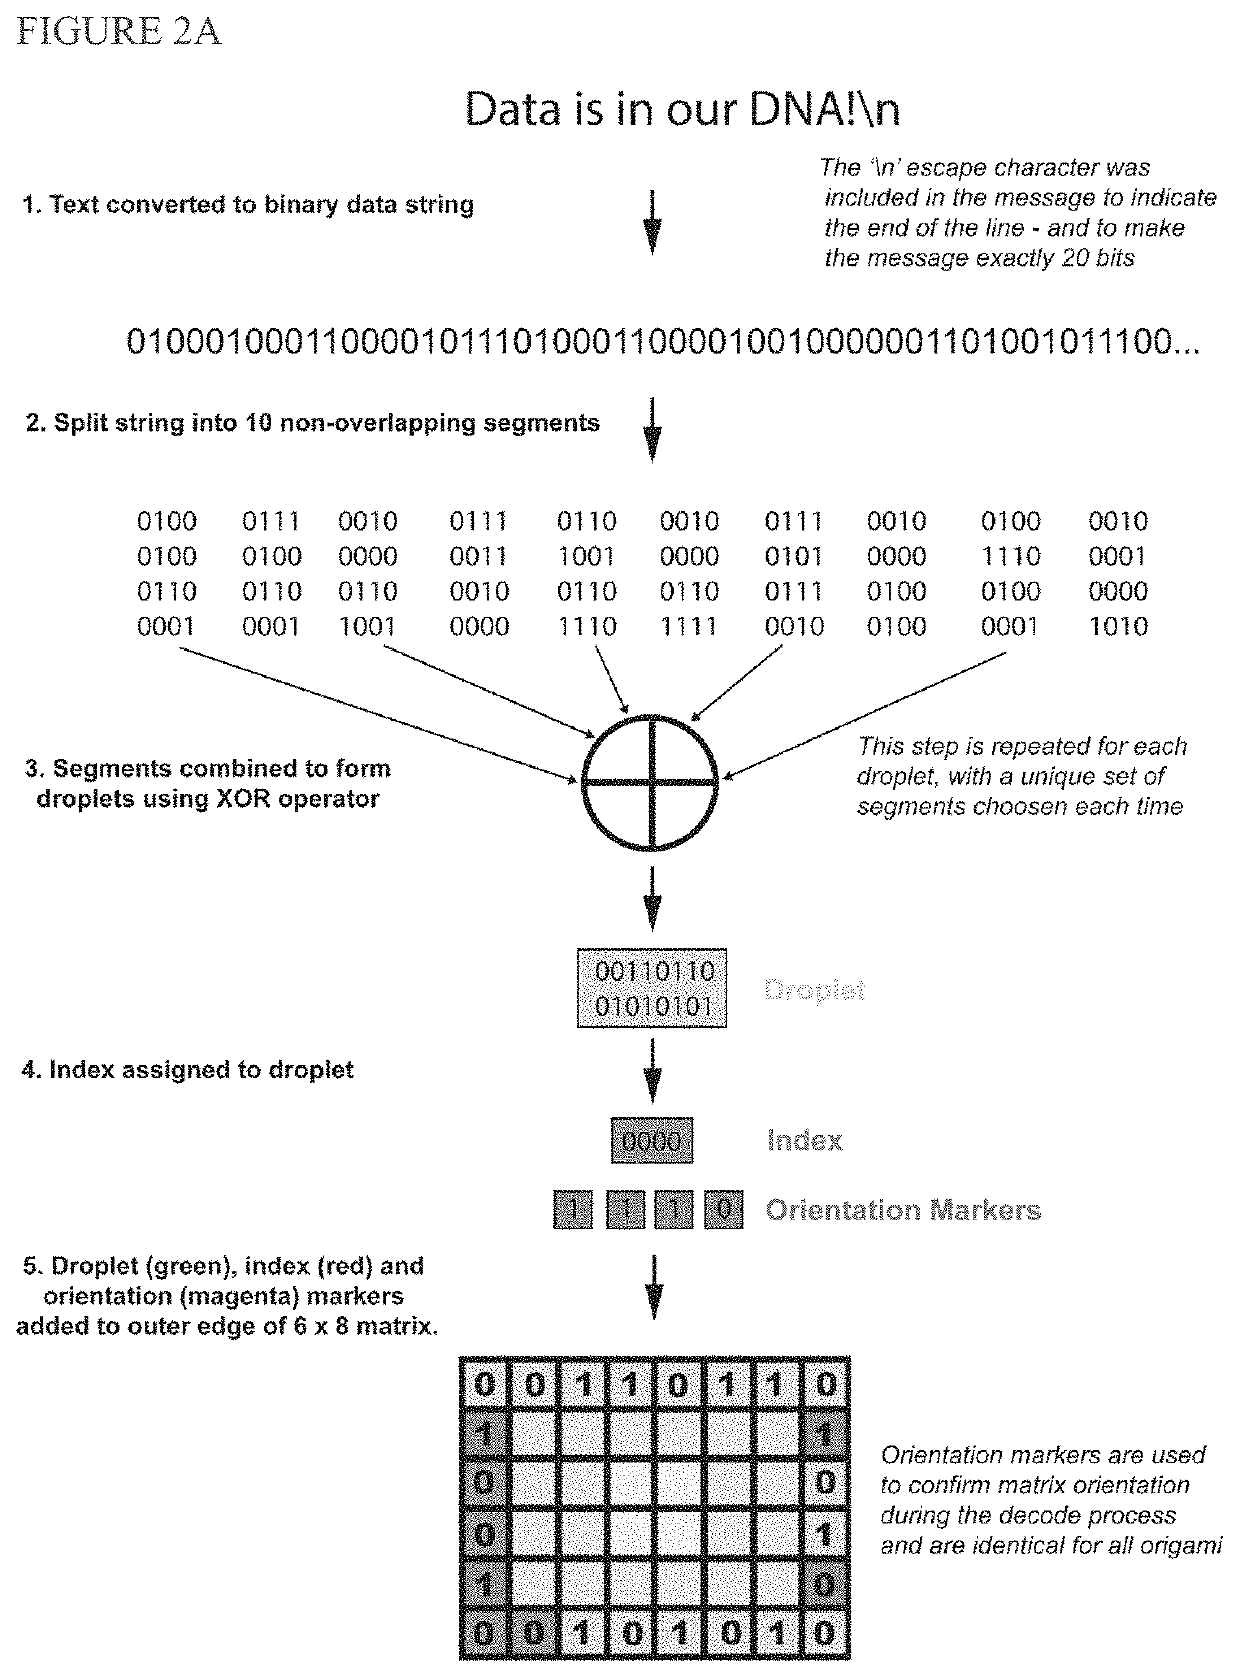
[0148]We report digital Nucleic Acid Memory (dNAM), a novel approach to DNA-based data storage. In dNAM, data is encoded by selecting specific combinations of single-stranded DNA possessing (1) or lacking (0) docking site domains. When combined with scaffold DNA these staple strands form DNA-origami optical breadboards from which data is read by monitoring binding of fluorescent imager probes using DNA-PAINT super-resolution microscopy. To enhance data retention, we created a multi-layer error correction scheme that combines fountain codes with bi-level parity codes. As a prototype, 15 origami were encoded with ‘Data is in our DNA!\n’, with each origami encoding a unique data droplet. Our error-correction algorithms ensured that we recovered 100% of the message even when individual docking sites, or entire origami, were missing. Unlike other DNA-based data storage systems, reading dNAM does not require sequencing. As such, it offers a new pathway to harness the advantages of DNA as an emerging memory material.
Introduction
[0149]As outlined by the Semiconductor Research Corporation, archival memory materials are quickly approaching their physical and economic limits1,2. Motivated by the rapid growth of the global datasphere3, and its environmental impacts, new non-volatile memory materials are needed. As a sustainable alternative, DNA is a viable option because of its vast information density, significant retention time, and low energy of operation4. While synthesis and sequencing cost curves drive innovations in the field5, divergent approaches to nucleic acid memory (NAM) have been limited by the focus on using sequencing to recover stored digital information6,7,8,9,10,11,12,13,14.
[0150]Here, we report an alternative approach to DNA memory via the creation of digital nucleic acid memory (dNAM)—which is inspired by innovations in DNA nanotechnology15 and made possible by recent advancements in super-resolution microscopy (SRM)16. In dNAM, non-volatile information is digitally encoded into specific combinations of single-stranded DNA, commonly known as staple strands, that can form DNA origami nanostructures when combined with a scaffold strand. When formed into DNA origami, the staple strands are arranged at addressable locations (FIGS. 1A-1C) that define an indexed array of digital information. This site-specific localization of digital information is enabled by designing staple strands with nucleotides that extend from the origami. Extended staple strands have two domains: the first domain forms a sequence-specific double helix with the scaffold and determines the address of the data within the origami; the second domain extends above the origami and, if present, provides a docking site for fluorescently labelled single-stranded DNA imager strands. Binary states are defined by the presence (1) or absence (0) of the data domain, which is read with a super-resolution microscopy technique called DNA-Points Accumulation for Imaging in Nanoscale Topography (DNA-PAINT)17. Unique patterns of binary data are encoded by selecting which staple strands have and do not have data domains. As an integrated memory platform, data is entered into dNAM when the staple strands encoding 1 or 0 are selected for each addressable site. The staple strands are then stored directly, or self-assembled into DNA-origami and stored. Editing data is achieved by replacing specific strands or the entire content of a stored structure. To read the data, the origami are optically imaged below the diffraction limit of light using DNA-PAINT (FIGS. 4A-4D).
[0151]Key design features of dNAM, that ensure error-free data recovery, are our error-correcting algorithms. Detection of individual DNA molecules using DNA-PAINT is routinely limited by incomplete staple strand incorporation, defective imager strands, fluorophore bleaching, and background fluorescence18. Although it is possible to improve the signal-to-noise ratio by averaging multiple images of identical structures18, this approach comes at a significant cost to the read speed and information density. To overcome these challenges, we created dNAM-specific information encoding and decoding algorithms that combine fountain codes with a custom, bi-level, parity-based, and orientation-invariant error detection scheme. Fountain codes enable transmission of data over noisy channels19. They work by dividing a data file into smaller units called droplets and then sending the droplets at random to a receiver. Droplets can be read in any order and still be decoded to recover the original file20, so long as a sufficient number of droplets are sent to ensure that the entire file is received. We encode each droplet onto a single origami and add additional bits of information for error correction to ensure that individual droplets will be recovered, in the presence of high noise, from individual origami. Together, the error correction and fountain codes increase the probability that the message is fully recovered while minimizing the number of DNA origami that must be observed.
[0152]In this report, we describe the first working prototype of dNAM. As a proof of concept, we encoded the message ‘Data is in our DNA!\n’ into origami and recovered the message using DNA-PAINT. We divided the message into 15 digital droplets, each encoded by a separately synthesized origami with addressable staple strands that space data domains approximately 10 nm apart. A single DNA-PAINT recording recovered the message from 20 femtomoles of origami, with approximately 750 origami needing to be read to reach a 100% probability of full data retrieval. By combining the spatial control of DNA nanotechnology with our error correction algorithms, we demonstrate dNAM as a massively parallel optical technology for archival memory applications.
Results
[0153]Recovery of a Message Encoded into dNAM
[0154]To test our dNAM concept, we encoded the message ‘Data is in our DNA!\n’ into 15 distinct DNA-origami nanostructures (FIG. 1A). Each origami was designed with a unique 6×8 data matrix that was generated by our encoding algorithm with data domains positioned ˜10 nm apart. For encoding purposes, the message was converted to binary code (ASCII) and then segmented into 15 overlapping data droplets that were each 16 bits. Inspired in part by digital encoding formats like QR-codes, the 48 addressable sites on each origami were used to encode one of the 16-bit data droplets, as well as information used to ensure the recovery of each data droplet. Specifically, each origami was designed to contain a 4-bit binary index (0000 -1110), twenty bits for parity checks, four bits for checksums, and four bits allocated as orientation markers (FIG. 1B). To fully recover the encoded message, we synthesized each origami separately, deposited an approximately equal mixture of all 15 designs (˜20 femtomoles of total origami) onto a glass coverslip, and recorded 40,000 frames from a single field of view using DNA-PAINT (˜4500 origami identified in 2,982 μm2). Super-resolution images of the hybridized imager strands were reconstructed from signal blinks identified in the recording to map the positions of the data domains on each origami (FIG. 1C). Using a custom localization processing algorithm, the signals were translated to a 6×8 grid and converted back to a 48-bit binary string—which was passed to the decoding algorithm for error correction, droplet recovery, and message reconstruction. The process enabled successful recovery of the dNAM encoded message from a single super-resolution recording.
Quality Control of dNAM
[0155]We evaluated all of the origami structures in order to confirm that the 15 different designs were successfully synthesized, with data domains in the intended addresses. Automated image processing algorithms were developed to identify, orient and average multiple images of each origami from the DNA-PAINT recording of the mixture (FIGS. 3A-3B). Although the edges of origami were more sensitive to data strand insertion failures (FIGS. 8A-8C), the results confirmed that all of the data domains, in each of the origami designs, were detectable in each of three separate experiments. Each individual origami synthesis was visualized and validated by atomic force microscopy (AFM). The AFM images further confirmed that the general shapes of all 15 origami designs were as expected with properly positioned data domains (FIG. 5). The results indicate that the extended staple strands do not substantially inhibit the synthesis of the 15 unique origami designs.
Further AFM Analysis of dNAM Origami
[0156]As an additional quality control step, we also used AFM to examine origami deposited onto a glass coverslip immediately following SRM imaging. We were not able to resolve individual docking sites in these images, most likely due to the increased roughness of glass, as compared to mica. However, it was possible to count the number of origami in a field of view for comparison with SRM. The densities of origami estimated from the images were 2.4 and 1.4 origami/μm2 for AFM and SRM respectively, suggesting that ˜60% of the total origami deposited have their docking sites facing away from the coverslip and available for imager strand binding. To further investigate the variance in error rates between origami designs, we resynthesized the most error prone origami (origami-2). DNA-PAINT imaging indicated that the fresh original batch showed 9.7±2 false negative errors per origami, consistent with the original experiment, while the second batch showed 7.1±2 false negative errors. This suggests that at least a portion of the variance in error rates is independent of origami design and may be caused by variations in mixing, folding, and purification conditions.
Data Encoding/Decoding Strategy for dNAM
[0157]Our encoding approach added 24 error-correction bits of data to every origami structure so that data droplets can be determined from individual origami even when data domains are incorrectly resolved, and the entire message recovered if some droplets are missed entirely. To evaluate the performance of the decoding algorithm, we examined the frequency and types of errors in the DNA-PAINT images and the effect of these errors on our decoding outcomes. We used a template matching strategy where each of the 15 origami grid designs were considered a template, and each individual origami in the field of view was compared to these designs to find a best match. We identified the total number of origami that matched, or did not match, each design (FIGS. 9A-9B). We then determined the number of each design identified by the decoding algorithm when recovering the message (FIG. 9C)—a process independent of template matching and blind to the droplet data contained in the DNA origami. We observed a clear negative correlation between the number of errors detected in a specific design and the number of corresponding data droplets that were successfully decoded by the algorithm (FIG. 9D). The results indicate that, even though there was a low relative abundance of several origami in the deposition mixture (particularly origami-2) and a mean false negative rate of 7.3±1.2% across the different designs, our error-correction scheme enabled successful message recovery. False positives were much less common in our experiments, with a mean of 1.7±0.5% (FIG. 9B). Furthermore, the mean number of errors overcome by the decoding algorithm (5.5±0.1) was lower than the mean number of errors observed across all the origami (7.7±0.1), demonstrating the challenge of decoding origami when several fluorescent signals are missing (FIG. 9E). Nevertheless, the ability of our data encoding and decoding strategy to recover the message despite errors in individual origami is very promising, and the results provide useful guidelines for evaluating and optimizing origami performance for future dNAM designs.
Sampling Analysis of dNAM
[0158]Given the observed frequency of missing data points, we used a random sampling approach to determine the number of origami needed to decode the ‘Data is in our DNA!\n’ message under our experimental conditions. We started with all the decoded binary output strings that were obtained from the single-field-of-view recordings and took random subsamples of 50-3000 binary strings. We passed each random subsample of strings through the decoding algorithm and determined the number of droplets that were recovered (FIG. 10). Based on the algorithmic settings used in the experiment, we found that only ˜750 successfully decoded origami were needed to recover the message with near 100% probability. This number is largely driven by the presence of origami in our sample that were prone to high error rates and thus rarely decoded correctly (i.e., origami-2).
Simulations of dNAM
[0159]Simulations were run to determine the size efficiency of the encoding scheme, as well as its ability to recover from errors. As shown in FIG. 11A, the number of origami required to encode a message of length n increases roughly at a linear rate up to n=5000 bytes of data. Larger message sizes require more bits to be devoted to indexing, decreasing the number of available data bits per origami, creating a practical limit of 64 kilobytes of data for the prototype described in this work. This limit can be increased, however, by increasing the number of bits per origami. To determine the ability of the decoding and error correction algorithm to recover information in the presence of increasing error rates, in silico origami that encoded randomly generated data, were subjected to increasing bit error rates. The decoding algorithm robustly recovers the entire message for all tested message sizes when the average number of errors per origami is less than 7.4 (FIG. 11B). At 7.4 errors per origami, the message recovery rate drops to 97.5%, and as expected decreases rapidly with higher error rates (55% recovery at 8.2 errors per origami, and 7.5% at 9 errors per origami). An important feature of our algorithm is that the origami recovery rate can be very low (as low as 63%) and still recover the entire message 100% of the time.
Discussion
[0160]Our results demonstrate a proof of concept for writing, editing, storing and reading of digital information encoded in DNA origami structures. Because of the durability of DNA, dNAM is well suited for archival information storage. Currently, the most widely used material for this purpose is magnetic tape. Recent advancements in magnetic tape report a two-dimensional areal information density up to 31 Gbit/cm2,21 though the current commercially available material typically has lower density9. Although relevant only for reading throughput, not storage, the information density of tape can be compared to the dNAM origami, which contain data domains spaced at 10 nm intervals to achieve an areal density of about 1000 Gbit/cm2. Even after accounting for using ˜2/3 of the bits for indexing and error correction, this still results in an areal data density of 330 Gbit/cm2. It is possible to increase dNAM areal density by placing a data domain at every turn in the DNA helix (˜3.5 nm spacing), a distance that has been resolved by SRM22. Other avenues to increasing density are also available, such as previously reported multiplexing techniques with multiple fluorophores and orthogonal binding sequences with different binding kinetics33, and incorporation of each of these approaches is expected to impact reading throughput. In terms of durability, typical magnetic tape lasts for 10-30 years, while double stranded DNA is estimated to be stable for millions of years under optimal environmental conditions8.
[0161]With our current microscope setup and origami deposition protocol we can image the 7,500 unique origami designs needed to store 5 kB of data (FIG. 5), albeit in several recordings. We conservatively estimate it would take ˜30 recordings to ensure a 100% probability of successful data recovery given the error rates we observed. While it is possible to use dNAM, as described here, to store up to 64 kB the number of origami designs required to meet the increased indexing demands make this impractical. To efficiently handle larger datasets, it is necessary to improve the indexing capacity of individual origami. This could be achieved by engineering larger origami or by simply increasing data density—either by placing data sites closer together or by using multiplexing techniques to augment bit depth at each site. Improvements in read speed could be achieved by depositing origami at higher concentrations, making simultaneous recordings, and by optimizing dNAM to work with shorter, faster binding, imager strands. Our previous work24 shows close-packing of origami is possible on boron-implanted silicon substrates, demonstrating a potential route forward for reducing reading times.
[0162]Our results also indicate that advancements in origami-based information storage and reading will require a coordinated effort between improvements in origami synthesis, substrate deposition, DNA-PAINT, and coding algorithms. For example, our subsampling approach (FIG. 10) showed that a decoding algorithm that corrected up to nine errors easily recovered our entire message, while algorithms that corrected only five or fewer errors are much less computationally expensive but rarely recovered our full message. This makes sense, given that most of the origami detected had more than five errors (FIG. 9E). We anticipate that reducing the number of errors by improving origami design and/or imager strand performance would allow more efficient algorithms for data recovery, which would in turn decrease the number of bits dedicated to error correction and thus increase information density.
[0163]Our fountain code algorithm is exceedingly robust to randomly lost packets of information, as long as the receiver receives K+£ packets, where K is the minimum number of packets required to encode the file under perfect conditions (i.e., K is equal to the file size) and is the number of additional packets received. The probability of being able to decode the file is then (1−δ), where δ is upper-bounded by 2{circumflex over ( )}(−Kε).25 This equation implies that all things being equal, the larger the file size the greater the likelihood of successfully recovering the file at the receiver. Normally, the transmitter continues to transmit droplets in a fountain code until the receiver acknowledges successful file recovery. In the case of dNAM, this is not possible since the number of droplets must be fixed ahead of time to equal the number of origami. Reducing the error rates, or improving error correction/detection, would have the added benefit of reducing the number of droplets and hence origami discarded by the fountain code. These improvements would make it easier to determine the minimum number of droplets/origami needed to ensure robust file recovery while increasing information density even further.
[0164]The lower abundance and higher error rate of origami-2 (FIG. 9) indicates that some designs have defects that we could not detect by AFM or SRM alone. Careful defect analysis indicates that incorporated but inactive data domains play a greater role in producing errors than unincorporated staple strands26. Future dNAM research should focus on sequence optimization to minimize variation in hybridization rates and the formation of off-target structures27. It should also include the use of larger DNA origami and increased bit depth through multiplexing.
Conclusion
[0165]DNA is an emerging material for data storage due to its high information density, high durability, low energy of operation, and the declining costs of synthesis1. The traditional approach in the field is to design and synthesize unique oligos that encode data directly into their sequence. This data is recovered by reading the pool of oligos using sequencing. In contrast, dNAM takes advantage of another property of DNA—its programmability. By encoding binary data into DNA origami and reading it as spatially and temporally distinct hybridization events, dNAM decouples information recovery from sequencing. Editing the data is trivial through the inclusion or exclusion of sequence extensions from a library of staple strands. Data strands can be stored directly or incorporated into origami and then stored; separating the 3D storage density from the 2D reading density. In addition, dNAM is a massively parallel process because the large optical field of view affords tens of thousands of origami to be imaged simultaneously, and the number of optical read heads is proportional to the concentration of the imager strands. Rather than averaging thousands of DNA-PAINT images together, to resolve the digital data″, individual origami were read here using custom encoding, decoding, and error-correction algorithms. Our algorithms combined fountain codes with bi-level parity codes to significantly enhance our data retention—creating a multi-layer error correction scheme that encoded index, orientation, parity, and checksum bits into the origami. As a proof of concept, several bytes of data were recovered in a single DNA-PAINT recording. Even when the DNA origami recovery rate was poor (as low as 63%) the message was recovered 100% of the time. As a technology platform, dNAM offers a new pathway to harnessing the advantages of DNA as a material for information storage.
Materials and Methods
[0166]The materials purchased for this study, and their respective vendors, are outlined below. All other reagents were obtained from Sigma.
Materials Purchased Vendor DNA Staple Strands Integrated DNA Technologies M13 bacteriophage single-stranded Bayou Biolabs DNA scaffolds (M13mp18) Cy3B-labeled DNA oligonucleotide Bio-Synthesis, Inc. (M1 Imager strand: CTAGATGTAT-Cy3B) 150 nm diameter silanized gold Nanopartz nanoparticles (AuNPs) Glass coverslips Ted Pella, Inc. Sticky-Slide flow cells Ibidi (sticky-Slide I 0.2 Luer) Liquinox Pollardwater, Inc. MilliporeSigma MilliporeSigma Protocatechuate 3,4-dioxygenase MilliporeSigma pseudomonas (PCD) (+−)-6-hydroxy-2,5,7,8-tetra- MilliporeSigma methylchromane-2-carboxylic acid (Trolox) MgCl2 MilliporeSigma Nuclease-free water Thermo Fisher Scientific Tris-borate-EDTA (TBE) Thermo Fisher Scientific Tris-Acetate-EDTA (TAE) Thermo Fisher Scientific
Buffers
[0167]As previously described18, two buffers were used to prepare and image DNA origami: a deposition buffer and an imaging buffer. The deposition buffer contained 0.5×TBE and 18 mM MgCl2. The imaging buffer contained the deposition buffer with the supplement of 60 nM PCD, 1 mM Trolox, 3 nM imager strands, and 10 mM PCA. PCA was added to the imaging buffer immediately before the start of a DNA-PAINT recording.
Encoding Algorithm
[0168]The encoding algorithm used a multi-layer error correction scheme to encode message data bits along with index, orientation, and error correction bits onto multiple origami (FIG. 2).
[0169]At the message level, the algorithm used a fountain code to encode the data. Let m be a message string composed of a sequence of n bits. The fountain code algorithm first divides m into k equally sized and non-overlapping substrings s1, s2, . . . , sk, where the concatenation s1s2. . . sk=m, and then systematically combines one to many segments using the binary XOR operation to form multiple data blocks called droplets. The number of segments d used to form each droplet are typically drawn from a distribution based on the Soliton distribution:
p ( 1 ) = 1 / k p ( d ) = 1 d ( d - 1 ) for d = 2 , 3 , … , k . ( 1 )
The Soliton distribution ensures that the algorithm encodes the optimal number of single segment droplets necessary for the decode step. Once the number of segments d for a droplet is determined, the droplet is formed by XOR'ing d randomly selected, unique segments from m, with each segment being selected with probability 1/k.
[0170]For our experiments, we divided the message ‘Data is in our DNA!\n’ into 10 segments of 16 bits each. The segments were then combined via an XOR in different combinations using the fountain code algorithm to form the 15 droplets. While the theoretical minimum number of 16-bit droplets required to decode the message is 10, the redundancy provided by the additional droplets ensured that the message would be recoverable in all cases involving the loss of one droplet, and in some cases with the loss of up to five droplets (FIG. 10).
[0171]After generating the droplets using fountain codes, the encoding algorithm encoded each droplet onto 15 6×8 matrixes, and sequentially added index and orientation marker bits, computed and added checksum bits, and then added parity bits (FIG. 1B). These matrixes were used to construct 15 origami structures, with a one-to-one mapping between the matrixes and the origami.
[0172]FIG. 1A shows the layout of how droplet information was encoded onto each origami, composed of 16 bits of droplet data (green coloring in FIG. 1A), four indexing bits (red), four orientation bits (magenta), four checksum bits (yellow), and twenty parity bits (blue). It is important to note that the layout of the data, orientation, and index bits relative to the corresponding parity and checksum bits is invariant to rotation, which made it possible for the error correction algorithm to perform error detection and recovery before determining the orientation (FIGS. 2B-2C). This led to more robust data recovery.
DNA Origami Folding
[0173]Rectangular DNA origami structures (˜90×70 nm) were designed based on previous work by Rafat et al.28 with 48 potential docking strand sites arranged in a 6×8 matrix with 10 nm spacing. Then, using the protocol described by Schnitzbauer et al.18 a mixture of extended and unmodified staple strands were selected to fold the M13 scaffold into the designed shape, with extended strands located at the ‘1’ positions described in the design matrix (SI Table 51). As described in the introduction, an extended staple strand has a binding site for the M1 imager strand, unmodified strands bind solely to the scaffold DNA to induce folding. Using this method, 15 origami designs were created that matched the 15 matrixes output by the encoding algorithm.
[0174]We assembled individual origami designs by combining 22 nM M13mp18 with 10× unmodified stands, 50× extended strands, lx TAE and 18 mM MgCl2 (in nuclease free water; 100 μL total volume) and folding in a Mastercycler nexus thermal cycler (Eppendorf) using the following heating cycle: [1 min 90° C., 2 min 80° C., then from 80° C. to 25° C. over 12 h]. We purified the origami by running them on an in ice-cooled 0.8% agarose gel containing 0.5×TBE and 8 mM MgCl2, excising the single sharp band and collecting the exudate of the crushed gel piece. Sharp triangle origami used as fiducial markers were prepared similarly, as previously described29. All purified origami was stored in the dark at 4° C. until use.
Glass Coverslip Preparation
[0175]Borosilicate glass coverslips (25×75 and 22×22 mm, #1 Gold Seal Coverglass) were sonicated in 0.1% (v/v) Liquinox and nano-pure water (1 min in each) to remove contaminants and dried at 40° C. for at least 30 min. Fiducial markers (200 μL of 0.2 pM AuNPs) were deposited onto the coverslips for 10 min at room temperature. The labelled coverslips were rinsed with methanol and nano-pure water and stored at 40° C. prior to use.
DNA-Origami Deposition onto Coverslips
[0176]The glow discharge technique previously described by Green26 was used to deposit DNA origami onto glass coverslips using an air-plasma vacuum glow-discharge system. Briefly, coverslips that had been cleaned and labelled with fiducial markers were exposed to glow discharge generated using an electrode coupled 115 V Electro-Technic BD-10A High Frequency Generator under 2 Torr of vacuum for 75 s. For DNA-PAINT analysis, a sticky-Slide flow cell (˜50 μL channel volume) was glued to the coverslip DNA origami deposited by introducing 200 μL of 0.05 nM origami (a mixture of dNAM origami, and sharp triangle origami29 added as additional fiducial markers, in deposition buffer) into the flow chamber and incubated for 30 min at room temperature. After deposition, the flow chamber was rinsed with 1 mL of deposition buffer (no DNA origami) and refilled with imaging buffer.
[0177]When performing AFM measurements on samples previously used for DNA-PAINT, a custom fluid chamber, modified from Jungmann et al.30, was used. A 22×22 mm coverslip was glued to a microscope slide using double-sided sticky tape with the addition of a thin layer of gel sealant—to both seal any gaps and weaken the binding of tape to the glass. Once DNA-PAINT imaging had been performed the sealant allowed the coverslip to be easily removed for further AFM analysis.
Fluorescence Microscopy
[0178]DNA origami were imaged below the diffraction-limit of light via DNA-PAINT18 using an inverted Nikon Eclipse Ti2 microscope from Nikon Instruments in total internal reflectance fluorescence (TIRF) mode. The images were acquired using an: integrated Perfect Focus System from Nikon Instruments; an oil-immersion CFI Apochromat 100×TIRF objective, with a 1.49 numerical aperture, plus an extra 1.5× magnification from Nikon Instruments; and a 405/488/561/647 nm Laser Quad Band Set TIRF filter cube from Chroma. A 561 nm laser source excited fluorescence from the DNA-PAINT imager strands within an evanescent field extending a few hundred nanometers above the surface of the glass coverslip. The emitted fluorescence was imaged onto the full chip with 512×512 pixels (1 pixel=16 μm) using a ProEM EMCCD camera from Princeton Instruments at a 300 ms exposure time (˜3 frames/s). During an experimental recording, each of the individual data strands, within a dNAM origami's matrix, transiently and repeatedly bound an imager strand, to emit a signal, creating a series of blinks. Images with blinking events were recorded into a stack (typically 40,000 frames per recording) using Nikon NIS-Elements version 5.20.00 from Nikon Instruments prior to processing and analysis.
DNA-PAINT Fluorophore Localization
[0179]After recording a DNA-PAINT stack, the center position of signals (a.k.a localizations) emitted by imager probes, transiently binding to DNA-origami docking strands, were identified using the ImageJ ThunderSTORM plugin31. The localizations were rendered and then drift corrected using the Picasso-Render software package, as described by Schnitzbauer et al.18. Data visualization and peak fitting of image data for PSF analysis were performed using OriginPro Version 2019b32.
Localization Data Processing
[0180]A custom algorithm was developed for identifying clusters of localizations, determining the maximum likelihood position of the emitters, and generating binary matrix data. The algorithm selected localization clusters at random from the localization list. To do this, it sampled random points in the scene, found the average position of nearby localizations, and counted the localizations within a radius (R) and the localizations within a band R
[0181]The algorithm then fit the cluster localizations to a grid of emitters. An idealized grid was created using the average DNA-PAINT image produced by several thousand individual origami structures of the same architecture used in this work. The algorithm performed fitting using a maximum likelihood estimation for the likelihood function:
L ( I , x c , y c , θ , Δ x g 2 , B ) = ∏ i ( ∑ k I k a exp ( - ( x i - x k ( x c , y c , θ ) ) 2 + ( y i - y k ( x c , y c , θ ) ) 2 Δ x i 2 + Δ x g 2 ) ) * B A * P ( N , I , B ) ( 2 )
[0182]Where Ik is the intensity of the kth emitter, (xc, y¬c) is the center position of the grid, θ is the rotation angle of the grid, Δxg is the global lateral uncertainty caused by error in drift correction, B is the background, Δxi is the lateral position uncertainty of localization i reported by the ThunderSTORM analysis described above, (xi, yi) is the position of the ith localization, (xk,yk) is the position of the kth emitter, as a function of the center position and rotation of the grid, A is the area of the cluster, and N is the number of localizations found in the cluster. a is a normalization constant given by:
α=2π(Δxi2+Δxg2) (3)
P(N,I,B) is the probability of finding N localizations given the intensity of each grid point and the background intensity, determined from the Poisson distribution of mean value N. This likelihood function determines the probability of finding localizations at all of the observed sites given a set of point emitters at the grid sites with intensity Ik and background intensity B. The optimization utilized the L-BFGS-B method of the minimize function provided by Scipy33 to minimize -log(L) subject to the constraint that all intensities are positive. Signals that did not align to the 6×8 grid were filtered to minimize fragmented origami and to reduce inadvertent assimilation of the triangular origami fiducial markers into the results.
[0183]The algorithm then assigned the emitters a binary value (1 or 0) using an empirically derived threshold value. This binary matrix data was decoded using the decoding algorithm described below.
[0184]In parallel with this blind cluster analysis, the processing algorithm also carried out a template matching step to more reliably identify individual origami and analyze their errors. This additional step used the known origami designs as templates, matching the observed origami to the best fit, based on the total number of errors. This method was more robust to higher error rates than the blind cluster analysis and allowed more origami to be identified for image averaging and error analysis (see FIGS. 9D-9E). It should be noted, however, that the template matching method cannot be considered as a data reading method because it requires a priori knowledge of the data being analyzed. For this reason, none of the analysis of the recovery rates or data density discussed here used data obtained from pattern matching.
Decoding Algorithm
[0185]The decoding algorithm (FIG. 6) utilized a multi-layer error correction/encoding scheme to recover the data in the presence of errors. The algorithm first works at the dNAM origami level (Step 1, below), using the parity and checksum bits, to attempt to identify and correct errors and recover the correct matrix. After recovery, the algorithm uses binary operations to recover the original data segments from the droplets (Step 2, below).
Decoding Algorithm: Step 1—Error Correction
[0186]Given raw binary matrix data M for a single dNAM origami, output from the localization data processing step, the matrix decoding algorithm determined which, if any, bits were associated with checksum and parity errors by calculating the bi-level matrix parity and checksum values, as described in FIGS. 2B-2C. Any discrepancies between the calculated parity and checksum values and the values recovered from the origami were noted, and a weight for each of the bits associated with the errant parity/checksum calculation was deduced. If no parity/checksum errors were detected for a particular matrix, then the data was assumed to be accurate, and the algorithm proceeded to extract the message data.
[0187]To determine the site(s) of likely errors, the decoding algorithm first determined a weight for every cell in M, beginning with data cells (the cells containing droplet, index, or orientation bits) and proceeding to parity and checksum cells. Let Pc ij be the set of parity functions calculated over a given data cell cij. Then for each data cell cij:
x i j = Σ f c p q ∈ P c ij | c p q - f c p q ( M ) | ( 4 )
Where cpq is the parity cell where the expected binary value off is stored.
[0188]The weight for each parity cell cij was then calculated based on the number of non-zero weights greater than 1 for the data cells associated with it. More formally, let cij be a parity cell and Dc ij be the set of data cells used in the calculation of cij. Then the weight xij for each parity cell cij is:
x i j = ∑ c p q ∈ D c i j ⩓ x p q 1 s g n ( x p q ) ( 5 )
The higher the weight value, the higher the probability that the corresponding cell had an error. An overall score for the matrix was then calculated by summing over all xi,j and normalizing by the sum of the correctly matched parity bits. This value was designated as the overall weight of the matrix. Higher values of this weight correspond to matrixes with more errors.
Overall matrix weight = ∑ i = 0 6 ∑ j = 0 8 x i j # number of matched parity bits ( 6 )
The algorithm then performed a greedy search to correct the errors using a priority queue ordered by the overall matrix weight (FIG. 7). The algorithm began by iteratively altering each of the probable site errors and computing the overall matrix weight of the modified matrix for each, placing each potential bit flip into a priority queue where the flips that produced the lowest overall weights had the highest priority. At each step, the algorithm selected the bit flip associated with the highest priority in the queue and then repeated this process on the resulting matrix. This process was continued until the algorithm produced a matrix with no mismatches or until it reached the maximum number of allowed bit flips (9 for our simulation/experiment). If it reached the maximum number of flips, it returned to the queue to pursue the next highest priority path. If the algorithm found a matrix with no mismatches, it then checked the orientation bits and oriented the matrix accordingly. The droplet and index data were then extracted and passed to the next step. If the queue was emptied without finding a correct matrix, the algorithm terminated in failure.
Decoding Algorithm: Step 2—Fountain Code Decoding
[0189]After extracting the droplet and index data from multiple matrixes the algorithm attempted to recover the full message (FIG. 12). Once decoded, each droplet had one or multiple segments XORed in it. Using the recovered indexes, the algorithm determined how many and which segments were contained in each droplet. To decode the message, the algorithm maintained a priority queue of droplets based on the number of segments they contained (their degree), with the lowest degree droplets having the highest priority. The algorithm looped through the queue, removing the lowest degree droplet, attempting to use it to reduce the degree of the remaining droplets using XOR operations, and re-queuing the resulting droplets. Upon finding a droplet of ‘degree one’ it stored it as a segment for the final message. If all segments were recovered, the algorithm terminated successfully.
Data Simulation Test
[0190]To test the robustness of our encoding and decoding algorithms, origami data were simulated with randomly generated messages and errors. First, random binary messages of size m were created (for m=160 to 12,800 bits, at 320-bit intervals). These messages were then divided into m/b equally sized segments, where b is the number of data bits to be encoded onto an individual origami. For fixed-size origami, larger messages necessitated a smaller b, as more bits had to be dedicated to the index. In these cases, b varied between eight (for m=12,800) and twelve (for m=160). After determining message segments, droplets were formed using the fountain code algorithm and encoded onto origami, along with the corresponding index, orientation, and error-correcting bits. Ten in silico copies of each unique origami were created, and 0-9 bits flipped at random to introduce errors. The origami were decoded as described above.
Code Availability
[0191]DNA-PAINT images were analyzed using custom and publicly available codes (as indicated). The encoding/decoding algorithms were written in-house using Python, version 3.7.334. The source codes for the encoding, decoding and localization algorithms are available on GitHub at https://github.com/gmortuza/dnam.
[0192]The schematics in FIGS. 1A-1B of digital Nucleic Acid Memory were derived from a model created using Nanodesign (www.autodeskresearch.com/projects/nanodesign).
AUTHOR CONTRIBUTIONS
[0193] W. L. H. conceived the concept. E. J. H., T. A., W. K., E. G., R. Z., and W. L. H. designed the study. C. W., E. J. H., T. A., W. K., E. G., and W. L. H. supervised the work. C. W. managed the research project. G. D. D. and L. synthesized the DNA origami and performed DNA-PAINT imaging. L. P. carried out AFM imaging and analysis. T. A. and G. M. M developed the encoding-decoding algorithms and necessary software, performed data processing, and generated the simulations. G. D. D. and W. C. developed the image-analysis software and analyzed the DNA-PAINT recordings. C. M. G. performed preliminary experiments and contributed critical suggestions to experimental design. All authors prepared the manuscript.
REFERENCES
[0194] 1. Victor Zhirnov. 2018 Semiconductor Synthetic Biology Roadmap. 36 (2018) doi:10.13140/RG.2.2.34352.40960. [0195] 2. ITRS. International Technology Roadmap for Semiconductors, 2015 Results. Itrpv 0, 1-37 (2016). [0196] 3. Reinsel, D., Gantz, J. & Rydning, J. The Digitization of the World—From Edge to Core. IDC White Pap. U.S. Pat. No. 44,413,318 (2018). [0197] 4. Zhirnov, V., Zadegan, R. M., Sandhu, G. S., Church, G. M. & Hughes, W. L. Nucleic acid memory. Nat. Mater. 15, 366-370 (2016). [0198] 5. Carlson, R. Time for New DNA Sequencing And Synthesis Cost Curves. 1-31 https://synbiobeta.com/time-new-dna-synthesis-sequencing-cost-curves-rob-carlson/(2014). [0199] 6. Organick, L. et al. Random access in large-scale DNA data storage. Nat. Biotechnol. 36, 242-248 (2018). [0200] 7. Goldman, N. et al. Towards practical, high-capacity, low-maintenance information storage in synthesized DNA. Nature 494, 77-80 (2013). [0201] 8. Grass, R. N., Heckel, R., Puddu, M., Paunescu, D. & Stark, W. J. Robust chemical preservation of digital information on DNA in silica with error-correcting codes. Angew. Chemie—Int. Ed. 54, 2552-2555 (2015). [0202] 9. Bornholt, J. et al. A DNA-Based Archival Storage System. ACM SIGARCH Comput. Archit. News 44, 637-649 (2016). [0203] 10. Shipman, S. L., Nivala, J., Macklis, J. D. & Church, G. M. Molecular recordings by directed CRISPR spacer acquisition. Science (80). 353, (2016). [0204] 11. Erlich, Y. & Zielinski, D. DNA Fountain enables a robust and efficient storage architecture. Science (80). 355, 950-954 (2017). [0205] 12. Blawat, M. et al. Forward error correction for DNA data storage. Procedia Comput. Sci. 80, 1011-1022 (2016). [0206] 13. Yazdi, S. M. H. T., Gabrys, R. & Milenkovic, O. Portable and Error-Free DNA-Based Data Storage. Sci. Rep. 7, 1-6 (2017). [0207] 14. Lee, H., Kalhor, R., Goela, N., Bolot, J. & Church, G. Enzymatic DNA synthesis for digital information storage. bioRxiv 348987 (2018) doi:10.1101/348987. [0208] 15. Wang, P., Meyer, T. A., Pan, V., Dutta, P. K. & Ke, Y. The Beauty and Utility of DNA Origami. Chem 2, 359-382 (2017). [0209] 16. Nieves, D. J., Gaus, K. & Baker, M. A. B. DNA-based super-resolution microscopy: DNA-PAINT. Genes (Basel). 9, 1-14 (2018). [0210] 17. Jungmann, R. et al. Single-molecule kinetics and super-resolution microscopy by fluorescence imaging of transient binding on DNA origami. Nano Lett. 10, 4756-4761 (2010). [0211] 18. Schnitzbauer, J., Strauss, M. T., Schlichthaerle, T., Schueder, F. & Jungmann, R. Super-resolution microscopy with DNA-PAINT. Nat. Protoc. 12, 1198-1228 (2017). [0212] 19. Luby, M. LT Codes. in Proceedings of the 43rd Annual IEEE Symposium on Foundations of Computer Science (IEEE, 2002) 271-280 (2002). [0213] 20. MacKay, D. J. C. Fountain codes. IEE Proc.—Commun. 152, 1062-1068 (2005). [0214] 21. Greengard, S. The future of data storage. Commun. ACM 62, 12-12 (2019). [0215] 22. Gwosch, K. C. et al. MINFLUX nanoscopy delivers 3D multicolor nanometer resolution in cells. Nat. Methods 17, (2020). [0216] 23. Wade, 0. K. et al. 124-Color Super-resolution Imaging by Engineering DNA-PAINT Blinking Kinetics. Nano Lett. 19, 2641-2646 (2019). [0217] 24. Takabayashi, S. et al. Boron-implanted silicon substrates for physical adsorption of DNA origami. Int. J. Mol. Sci. 19, (2018). [0218] 25. Langari, S. M. M., Yousefi, S. & Jabbehdari, S. Fountain-code aided file transfer in vehicular delay tolerant networks. Adv. Electr. Comput. Eng. 13, 117-124 (2013). [0219] 26. Green, C. Nanoscale Optical and Correlative Microscopies for Quantitative Characterization of DNA Nanostructures. Journal of Chemical Information and Modeling vol. 53 (Boise State University, 2019). [0220] 27. Hata, H., Kitajima, T. & Suyama, A. Influence of thermodynamically unfavorable secondary structures on DNA hybridization kinetics. Nucleic Acids Res. 46, 782-791 (2018). [0221] 28. Aghebat Rafat, A., Pirzer, T., Scheible, M. B., Kostina, A. & Simmel, F. C. Surface-assisted large-scale ordering of DNA origami tiles. Angew. Chemie—Int. Ed. 53, 7665-7668 (2014). [0222] 29. Rothemund, P. W. K. Folding DNA to create nanoscale shapes and patterns. Nature 440, 297-302 (2006). [0223] 30. Dai, M., Jungmann, R. & Yin, P. Optical imaging of individual biomolecules in densely packed clusters. Nat. Nanotechnol. 11, 798-807 (2016). [0224] 31. Ovesný, M., Kř{hacek over (i)}žek, P., Borkovec, J., Svindrych, Z. & Hagen, G. M. ThunderSTORM: A comprehensive ImageJ plug-in for PALM and STORM data analysis and super-resolution imaging. Bioinformatics 30, 2389-2390 (2014). [0225] 32. OriginLab Corporation. OriginPro Version 2019b. [0226] 33. Oliphant, T. E. Python for scientific computing. Comput. Sci. Eng. 9, 10-20 (2007). [0227] 34. Python Software Foundation. Python Language Reference, version 3.7.3. http://www.python.org.
Supplemental Materials and Methods
Encoding/Decoding Algorithms
[0228]See attached diagrams and flowcharts for graphical representation of the main steps of the algorithms. Table S1 lists the different designs generated by the encoding algorithm for the message ‘Data is in our DNA!\n’.
TABLE S1 Origami Designs Binary Matrix Binary Matrix Binary Matrix Index Index Droplet Design Index Index Droplet Design Index Index Droplet Design 0 0000 00110110 00110110 5 0101 01011111 01011111 10 1010 01101110 01101110 01010101 11110111 01001011 11010101 00000101 11010101 00111010 10111000 00000110 00110111 00101001 11011110 11011110 11000010 11111100 00101010 10110100 01101000 1 0001 00100110 00100110 6 0110 00010000 00010000 11 1011 00010001 00010001 01100000 10101001 01101001 11101011 00001010 11100111 10110100 00011010 10011010 00011101 11100011 10000000 11111100 10000110 10101110 00000001 10100101 01010100 2 0010 01011111 01011111 7 0111 01010100 01010100 12 1100 01001110 01001110 00111010 11011001 00001000 10100001 01000110 11001101 00011100 11100000 01000100 10111100 11011000 00000001 11100100 11011000 11000100 00010111 10000100 11011000 3 0011 00100001 00100001 8 1000 00100000 00100000 13 1101 01010010 01010010 01010110 10000101 01101001 10111111 01110110 10011111 10011110 01000100 11001100 10010001 01010011 01010011 11100010 11100100 11001110 00011010 01100101 11011011 4 0100 00011010 00011010 9 1001 00100000 00100000 14 1110 00001010 00001010 00010010 11111011 01101111 11011011 01111101 11010101 00111110 10101100 01101100 00010000 00010011 10001011 11011000 11010000 10010100 10010010 01111101 11101111
The binary data droplets and data strings associated with each origami index are shown.
[0229]Atomic Force Microscopy
[0230]AFM analysis was conducted on freshly cut mica substrates or glass coverslips (prepared as described above). 4 μL of a dNAM origami sample was deposited onto the substrate for 5 min and then 100 μL of deposition buffer added to form a droplet on top of the sample. AFM imaging was performed with a Dimension-FastScan system from Bruker set to amplitude modulation mode. Imaging was carried out in liquid with a set-point ratio between the free amplitude and imaging amplitude of ˜0.7. The FastScan D cantilever was supplied by Bruker, with a nominal spring constant of 0.25 N/m. Sub-nanometer amplitude was used to image DNA docking strand positions on every origami structure following the method of l. Tilt correction (line or plane flattening) was performed using WSxM software package2 (Nanotec Electronica, Madrid, Spain) and a low-pass filter applied to remove noise. Further filtering, using inverse FFT band rejection, was added to visually highlight the docking strands.
Supplemental Results
DNA-PAINT Resolution
[0231]To evaluate the resolution of the DNA-PAINT experiments, FWHM values were derived by taking transect measurements centered on binding sites in rendered images (with 1-pixel blur applied) of either individual or ‘averaged’ dNAM origami (FIGS. 4A-4D). In both cases at least ten binding sites were examined for each structure using with horizontally or vertically aligned positioned transects (FIGS. 4A-4B). FWHM values of 6.6 nm±1.6 SD (single origami images, n=124) and 7.2 nm±0.3 SD (averaged origami images, n=47) were calculated from Gaussian fits to plots of the transect data (FIGS. 4C-4D).
Proximity Error Analysis
[0232]Analysis of our error locations (FIGS. 8A-8C) showed slightly higher false negative error rates around the edges of dNAM origami, but there was no pattern of error locations in the origami that would explain the variance in error rates between different origami designs. There is a correlation between a higher number of 1-bits and a higher number of false negatives, as would be expected, but this does not explain most of the observed variance between origami. The phenomenon of higher errors near the edges of the origami has been observed previously3 and was interpreted as reflecting a difference in staple strand incorporation efficiencies. To investigate this and other sources of potential sources of error in our array designs, we performed atomic force microscopy (AFM) imaging on individual origami deposited on mica (FIG. 5). From the averaged SRM images in FIG. 3, it can be seen that every data strand was recorded at least once for all expected positions in all arrays. This suggests that there were no systematic failures in strand incorporation or data strand binding domains. This is further substantiated by the AFM images, in which origami were typically both well formed (lacking holes and having the expected dimensions) and appeared to have incorporated the majority of their data strands. Although it was possible to resolve the majority of data strands positions (FIG. 5), a strict analysis on missing data strands using AFM would not be completely reliable since tip-sample interactions could easily promote strand compression and displacement. However, our previous correlative defect analysis of DNA origami, combining AFM and DNA-PAINT, indicated that strand incorporation plays a role in origami site yields and defects are likely due to the unavailability of incorporated staple strands. Further, DNA-PAINT itself may locally increase the susceptibility of DNA origami to damage during imaging4. This is in keeping with our results and suggests that further optimization of the DNA-PAINT imaging protocol will help reduce the false negative error rate.
SUPPLEMENTAL REFERENCES
[0233] 1. Miller, E. J. et al. Sub-nanometer resolution imaging with amplitude-modulation atomic force microscopy in liquid. J. Vis. Exp. 2016, 1-10 (2016). [0234] 2. Horcas, I. et al. WSXM: A software for scanning probe microscopy and a tool for nanotechnology. Rev. Sci. Instrum. 78, (2007). [0235] 3. Strauss, M. T., Schueder, F., Haas, D., Nickels, P. C. & Jungmann, R. Quantifying absolute addressability in DNA origami with molecular resolution. Nat. Commun. 9, 1-7 (2018). [0236] 4. Green, C. Nanoscale Optical and Correlative Microscopies for Quantitative Characterization of DNA Nanostructures. Journal of Chemical Information and Modeling vol. 53 (Boise State University, 2019).
PUM
Property | Measurement | Unit |
Length | m | |
Nanoscale particle size | nm | |
Temperature |
Description & Claims & Application Information
We can also present the details of the Description, Claims and Application information to help users get a comprehensive understanding of the technical details of the patent, such as background art, summary of invention, brief description of drawings, description of embodiments, and other original content. On the other hand, users can also determine the specific scope of protection of the technology through the list of claims; as well as understand the changes in the life cycle of the technology with the presentation of the patent timeline. Login to view more.
Similar technology patents
Beamforming apparatus and method in mobile communication system
Owner:SAMSUNG ELECTRONICS CO LTD +1
Fiber optic negative pressure wave-based oil and gas pipeline leakage monitoring positioning system and method
Owner:LASER RES INST OF SHANDONG ACAD OF SCI
Built-in-coding-information-based single sensing flexible angle-domain averaging method
Owner:XI AN JIAOTONG UNIV
Static CT (computed tomography) scanner and scattering X-photon correction method thereof
Owner:SUZHOU INST OF BIOMEDICAL ENG & TECH
Equipment and method for detecting temperature coefficient of remanence
Owner:CENT IRON & STEEL RES INST
Classification and recommendation of technical efficacy words
- high noise
- improve signal-to-noise ratio
Bowel sound analysis method and system
InactiveUS20160199020A1high noisereduce medical cost
Owner:CHI MEI MEDICAL CENT
System for generating thermographic images using thermographic signal reconstruction
Owner:THERMAL WAVE IMAGING
Embedded touch-screen LCD (liquid crystal display) device and control method
Owner:SHANGHAI TIANMA MICRO ELECTRONICS CO LTD
Touch display device and manufacturing method thereof
Owner:SHANGHAI TIANMA MICRO ELECTRONICS CO LTD
Ethernet connection of airborne radar over fiber optic cable
Owner:ROCKWELL COLLINS INC
Overlay error detection
Owner:KLA TENCOR CORP