Method for remote sensing analysis be decorrelation statistical analysis and hardware therefor

a statistical analysis and decorrelation technology, applied in the field of remote sensing analysis, can solve the problems of difficult identification of point source targets, complex issues, and severe limitations in quality and quantity

Inactive Publication Date: 2000-01-25
APPLIED SPECTRAL IMAGING
View PDF10 Cites 73 Cited by
  • Summary
  • Abstract
  • Description
  • Claims
  • Application Information

AI Technical Summary

Problems solved by technology

Although information can be derived from monoscopic imagery, there are severe limitations to its quality and quantity.
For passive systems such as thermal infrared and thermal microwave, these issues are more complex than for the active systems.
In general, the more cluttered the scene, for any type of sensor, the more difficult the identification of point source targets.
These equations showed that it was no longer possible to consider an electric field and a magnetic field as separate and isolated components.
), however, the amount of energy emitted is below the threshold level of either a photographic emulsion, or the eye.
Darker tones in the lows can also be caused by moist soil, and can lose heat faster.
Also, infrared cannot penetrate the overburden to reveal the presence of the void.
When the sun...

Method used

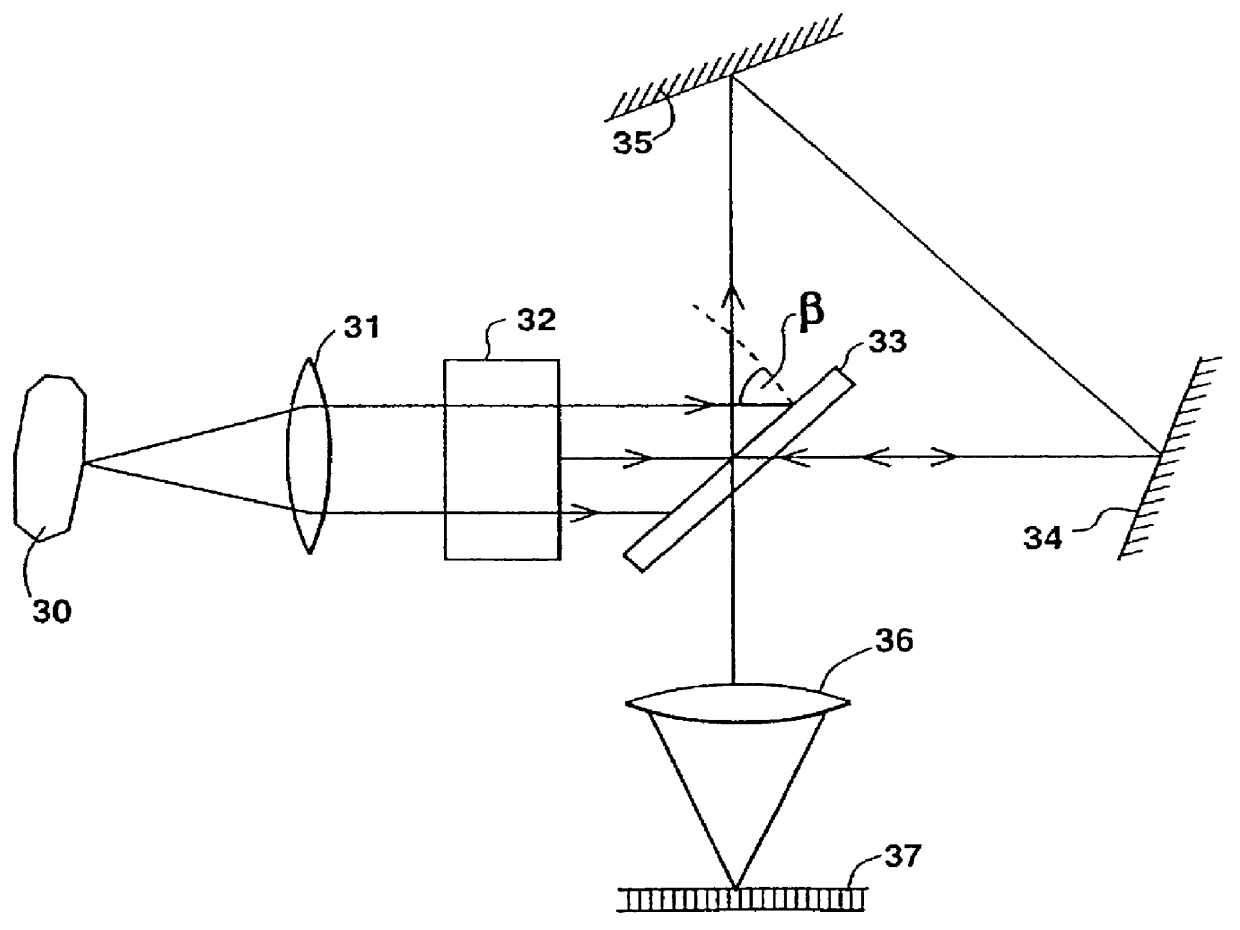
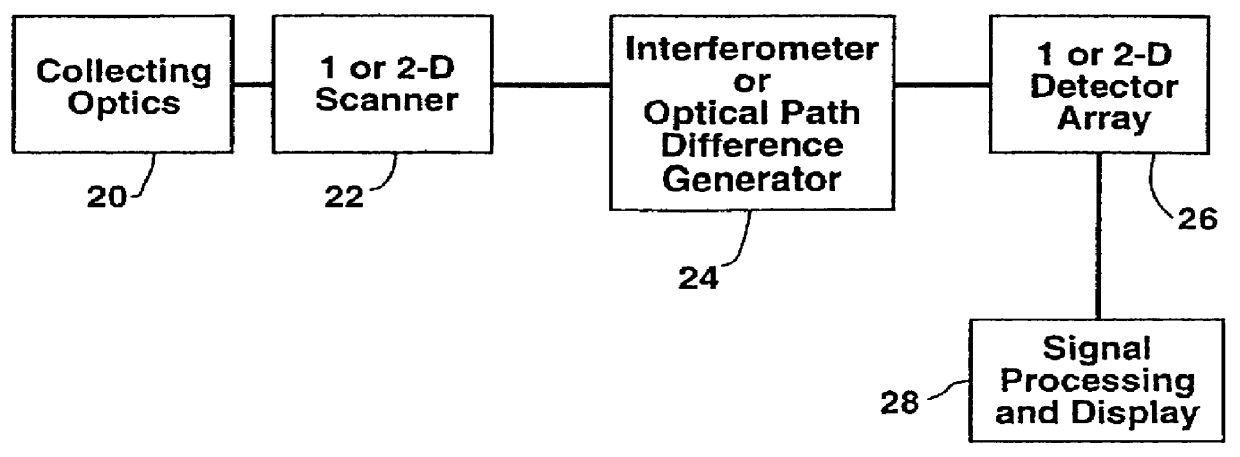

Image

  • Method for remote sensing analysis be decorrelation statistical analysis and hardware therefor
  • Method for remote sensing analysis be decorrelation statistical analysis and hardware therefor
  • Method for remote sensing analysis be decorrelation statistical analysis and hardware therefor

Examples


example 2

Decorrelation Statistical Analysis for Chromosome Classification and for Designing Decorrelation Matched Filters.

Decorrelation statistical analysis is directed at extracting decorrelated data out of a greater amount of data, and average over the correlated portions thereof. There are a number of related statistical decorrelation methods. Examples include but not limited to principal component analysis (PCA), canonical variable analysis and singular value decomposition, etc., of these methods PCA is perhaps the more common one, and its use for decorrelation of spectral data, as this term is defined above, is hereinafter described.

However, considering the fact that all decorrelation statistical methods including those listed above are related to one another, there is no intention to limit the scope of the invention to use of any specific decorrelation statistical method.

Specifically, there is no intention to limit the scope of the present invention to use of principal component analys...

example 3

The Basic Data Set

The results of the spectral measurements of the stained chromosomes sample are stored in a spectral cube in any convenient format. In order to be able to access, for analysis purposes, each spectral cube, a conversion is typically needed. The conversion can be performed by a dedicated software able to read each pixel in each spectral slice and write it into another file in a format suitable to the user. Alternatively, a commercial software, sold under the name ENVI (environment for visualizing images) by Research Systems Inc., Boulder Colo., USA, can be used. ENVI can read a spectral cube and write, on request, each spectral slice into a standard *.GIF format which can be read by a large number of routines. ENVI can be used in a different mode called the BSQ format. The later writes the cube in a binary sequential manner, starting at the spectral slice possessing the highest wave number, wherein each slice is written column after column.

All this can be done also wi...

example 4

Pre-Processing for Classification

For pre-processing, the k (e.g., twenty) spectral slices above are first used to find the decorrelated (and therefore orthogonal) principal components vectors of each chromosome type (L types in a species, 24 types in human), then the projection of each chromosome in each relevant principal component direction is calculated. This is equivalent to find the position of each chromosome template in the principal component space. This is performed by first identifying the chromosomes via conventional chromosome classification techniques, e.g., G-banding, R-banding or color karyotyping as described in E. Schroeck et al. (1996) Multicolor spectral karyotyping of human chromosomes, Science, 273, 494-497. It should be noted that the method described in Science magazine can be performed post G-banding or simultaneously to R-banding without affecting the measured spectral results.

As each of the chromosomes is labeled with a different fluorophore or a different ...


PUM

PropertyMeasurementUnit
Nanoscale particle sizeaaaaaaaaaa
Coloraaaaaaaaaa

Abstract

A method for remote scenes classification comprising the steps of (a) preparing a reference template for classification of the remote scenes via (i) classifying a set of reference scenes via a conventional classification technique for obtaining a set of preclassified reference scenes; (ii) using a first spectral imager for measuring a spectral cube of the preclassified reference scenes; (iii) employing a principal component analysis for extracting the spectral cube for decorrelated spectral data characterizing the reference scenes; and (vi) using at least a part of the decorrelated spectral data for the preparation of the reference template for remote scenes classification; (b) using a second spectral imager for measuring a spectral cube of analyzed remote scenes, such that a spectrum of each pixel in the remote scenes is obtained; (c) employing a decorrelation statistical method for extracting decorrelated spectral data characterizing the pixels; and (d) comparing at least a part of the decorrelated spectral data extracted from the pixels of the remote scenes with the reference template.

Description

FIELD AND BACKGROUND OF THE INVENTIONThe present invention relates to remote sensing. More particularly, the present invention relates to a method for classification of remote scenes by decorrelation statistical analysis of spectra systematically derived from the scenes. The invention further relates to hardware for such classification, the hardware is dedicated or tunable according to parameters derived from the decorrelation statistical analysis.A thorough tutorial concerning the evolution, methods, strategies, devices and applications of remote sensing is given in J. N. Rinker "Remote Sensing Tutorial--Multiband, Multispectral and Hyper spectral" U.S. Army Topographic Engineering Center, Fort Belvoir, Va. 22060-5546, USA, which is incorporated by reference as if fully set forth herein. The following background reconstructs the highlights of this publication.From the standpoint of image analysis, an image provides two sources of information. One is shape, and the other is intensit...

Claims


Application Information

Patent Timeline
IPC IPC(8): C12Q1/68G01N33/569G01N33/50G01J3/45G01J3/12G01N21/64G01J3/453G01N33/58G01J3/26G01J3/28G01J3/44G06K9/74G06K9/00G06K9/76G01J3/02G01J3/00G06T1/00G06V10/88G06V20/13
CPCG01J3/12G01J3/1256G01J3/26G01J3/2823G01J3/4406G01J3/453G01N21/6428G01N21/6458G01N33/5005G01N33/56966G01N33/582G06K9/00127G06K9/00201G06K9/0063G06K9/76G01J3/02G01J2003/2866G06V20/69G06V20/64G06V20/13G06V10/88
Inventor CABIB, DARIO
Owner APPLIED SPECTRAL IMAGING
Why Eureka
Try Eureka