Methods of evaluating protein formulation stability and surfactant-stabilized insulin formulations derived therefrom
a technology of protein formulation and physical stability, which is applied in the direction of peptides, drug compositions, inorganic non-active ingredients, etc., can solve the problems of long test runs of 20 or more days, high degree of thermomechanical stress on the protein formulation to be delivered, and high cost of time and resources for the development of new formulations
- Summary
- Abstract
- Description
- Claims
- Application Information
AI Technical Summary
Benefits of technology
Problems solved by technology
Method used
Image
Examples
example 1
An example of the calculations using Prism software, for example, is as follows. In the X columns, the times to start aggregation (e.g. t.sub.50) are entered. If a particular sample did not aggregate, the time when the run ended is entered. In the Y columns, the number 1 is entered for the rows where the sample aggregated and 0 for the rows where the sample did not aggregate at a given time. Thus, using this method, a calculation of the survival fractions at each data collection time point and survival fraction vs. time are generated. For comparison between the formulation of interest and the reference batch, the log rank test, which is equivalent to the Mantel-Haenszel test, is performed. This test generates a P value testing the null hypothesis that the survival curves are identical in the overall populations. In general if the P value is less than 0.05, the difference between the two sets of data being compared are statistically significant. In other words, the physical stability...
example 2
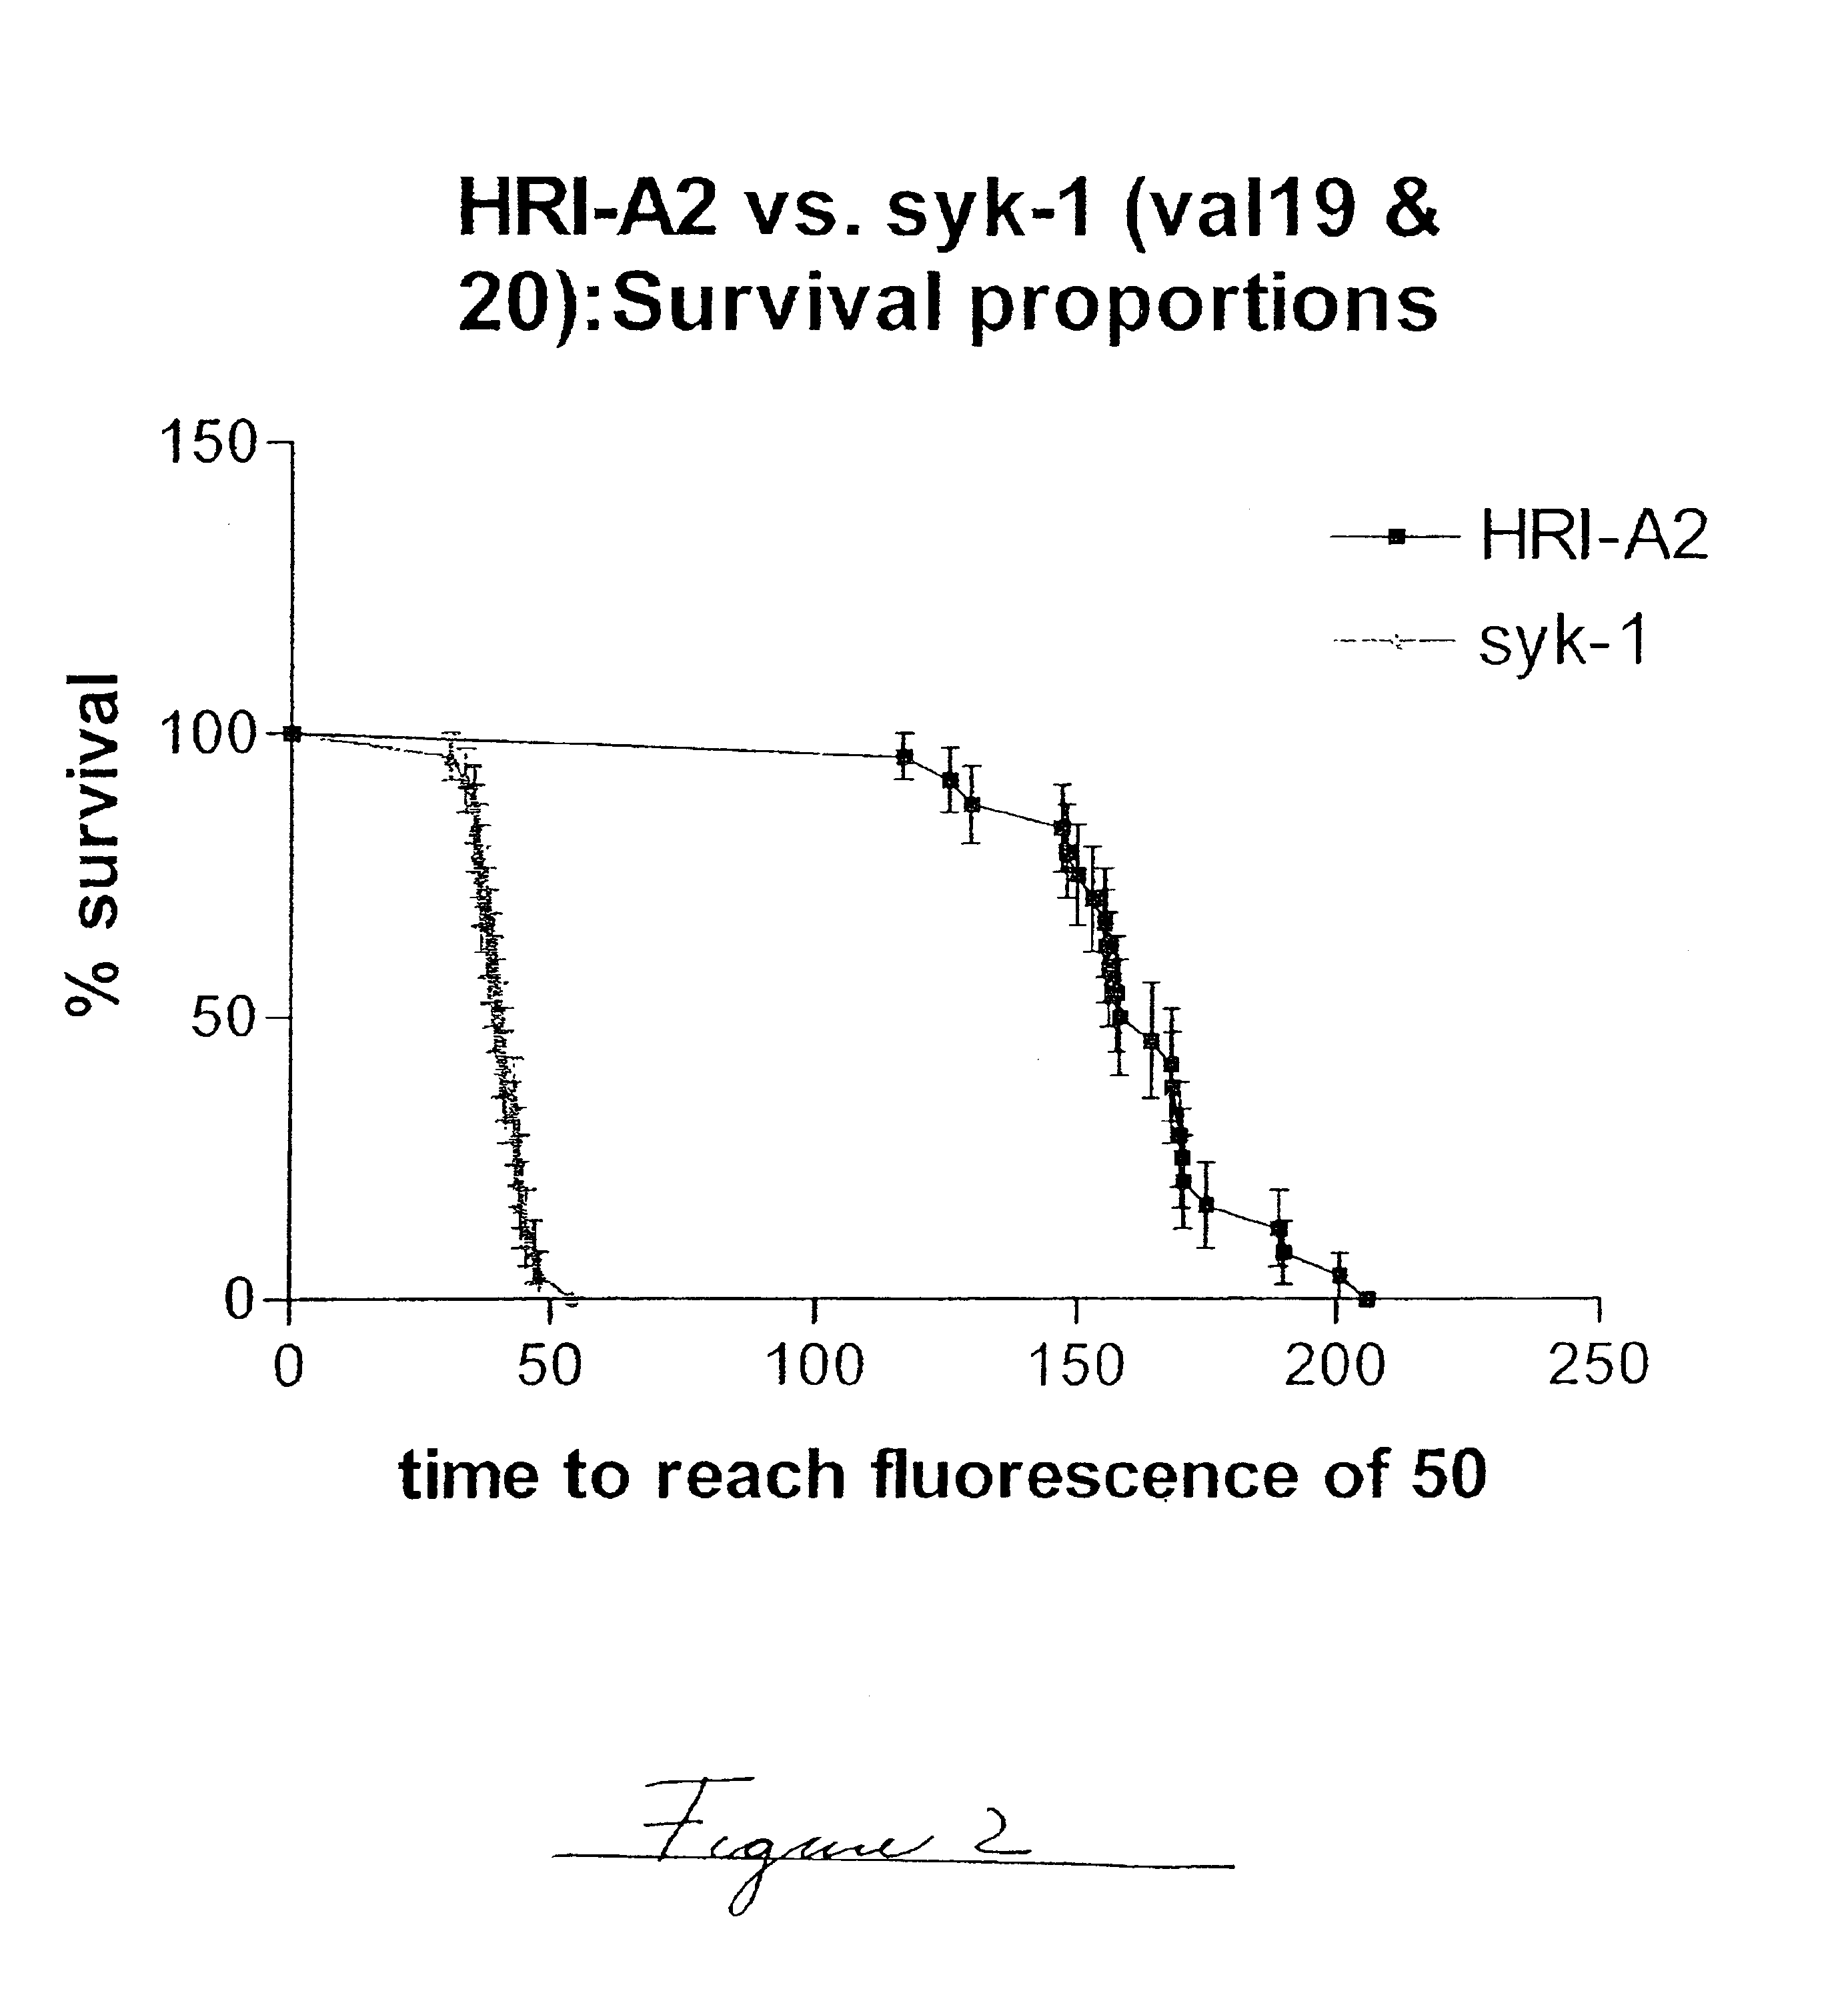
The example, shown in FIG. 2, is a graphic display of the experimental data of % survival. The statistical evaluation of the data was performed using commercial software (GraphPad). A comparison of the survival curve statistical data of the plot shown in FIG. 2 is shown in Table 2.
Based on the above information, it is concluded that the difference in the estimated relative physical stability of the two formulations under evaluation is statistically significant and that the median time to a fixed fluorescence is approximately 4 times longer for HRI-A2 as for syk-1. When the same set of sample types were repeatedly tested, the statistical error or standard deviation of the median survival ratio is between 11 and 20% (see Examples 3 and 4 below).
example 3
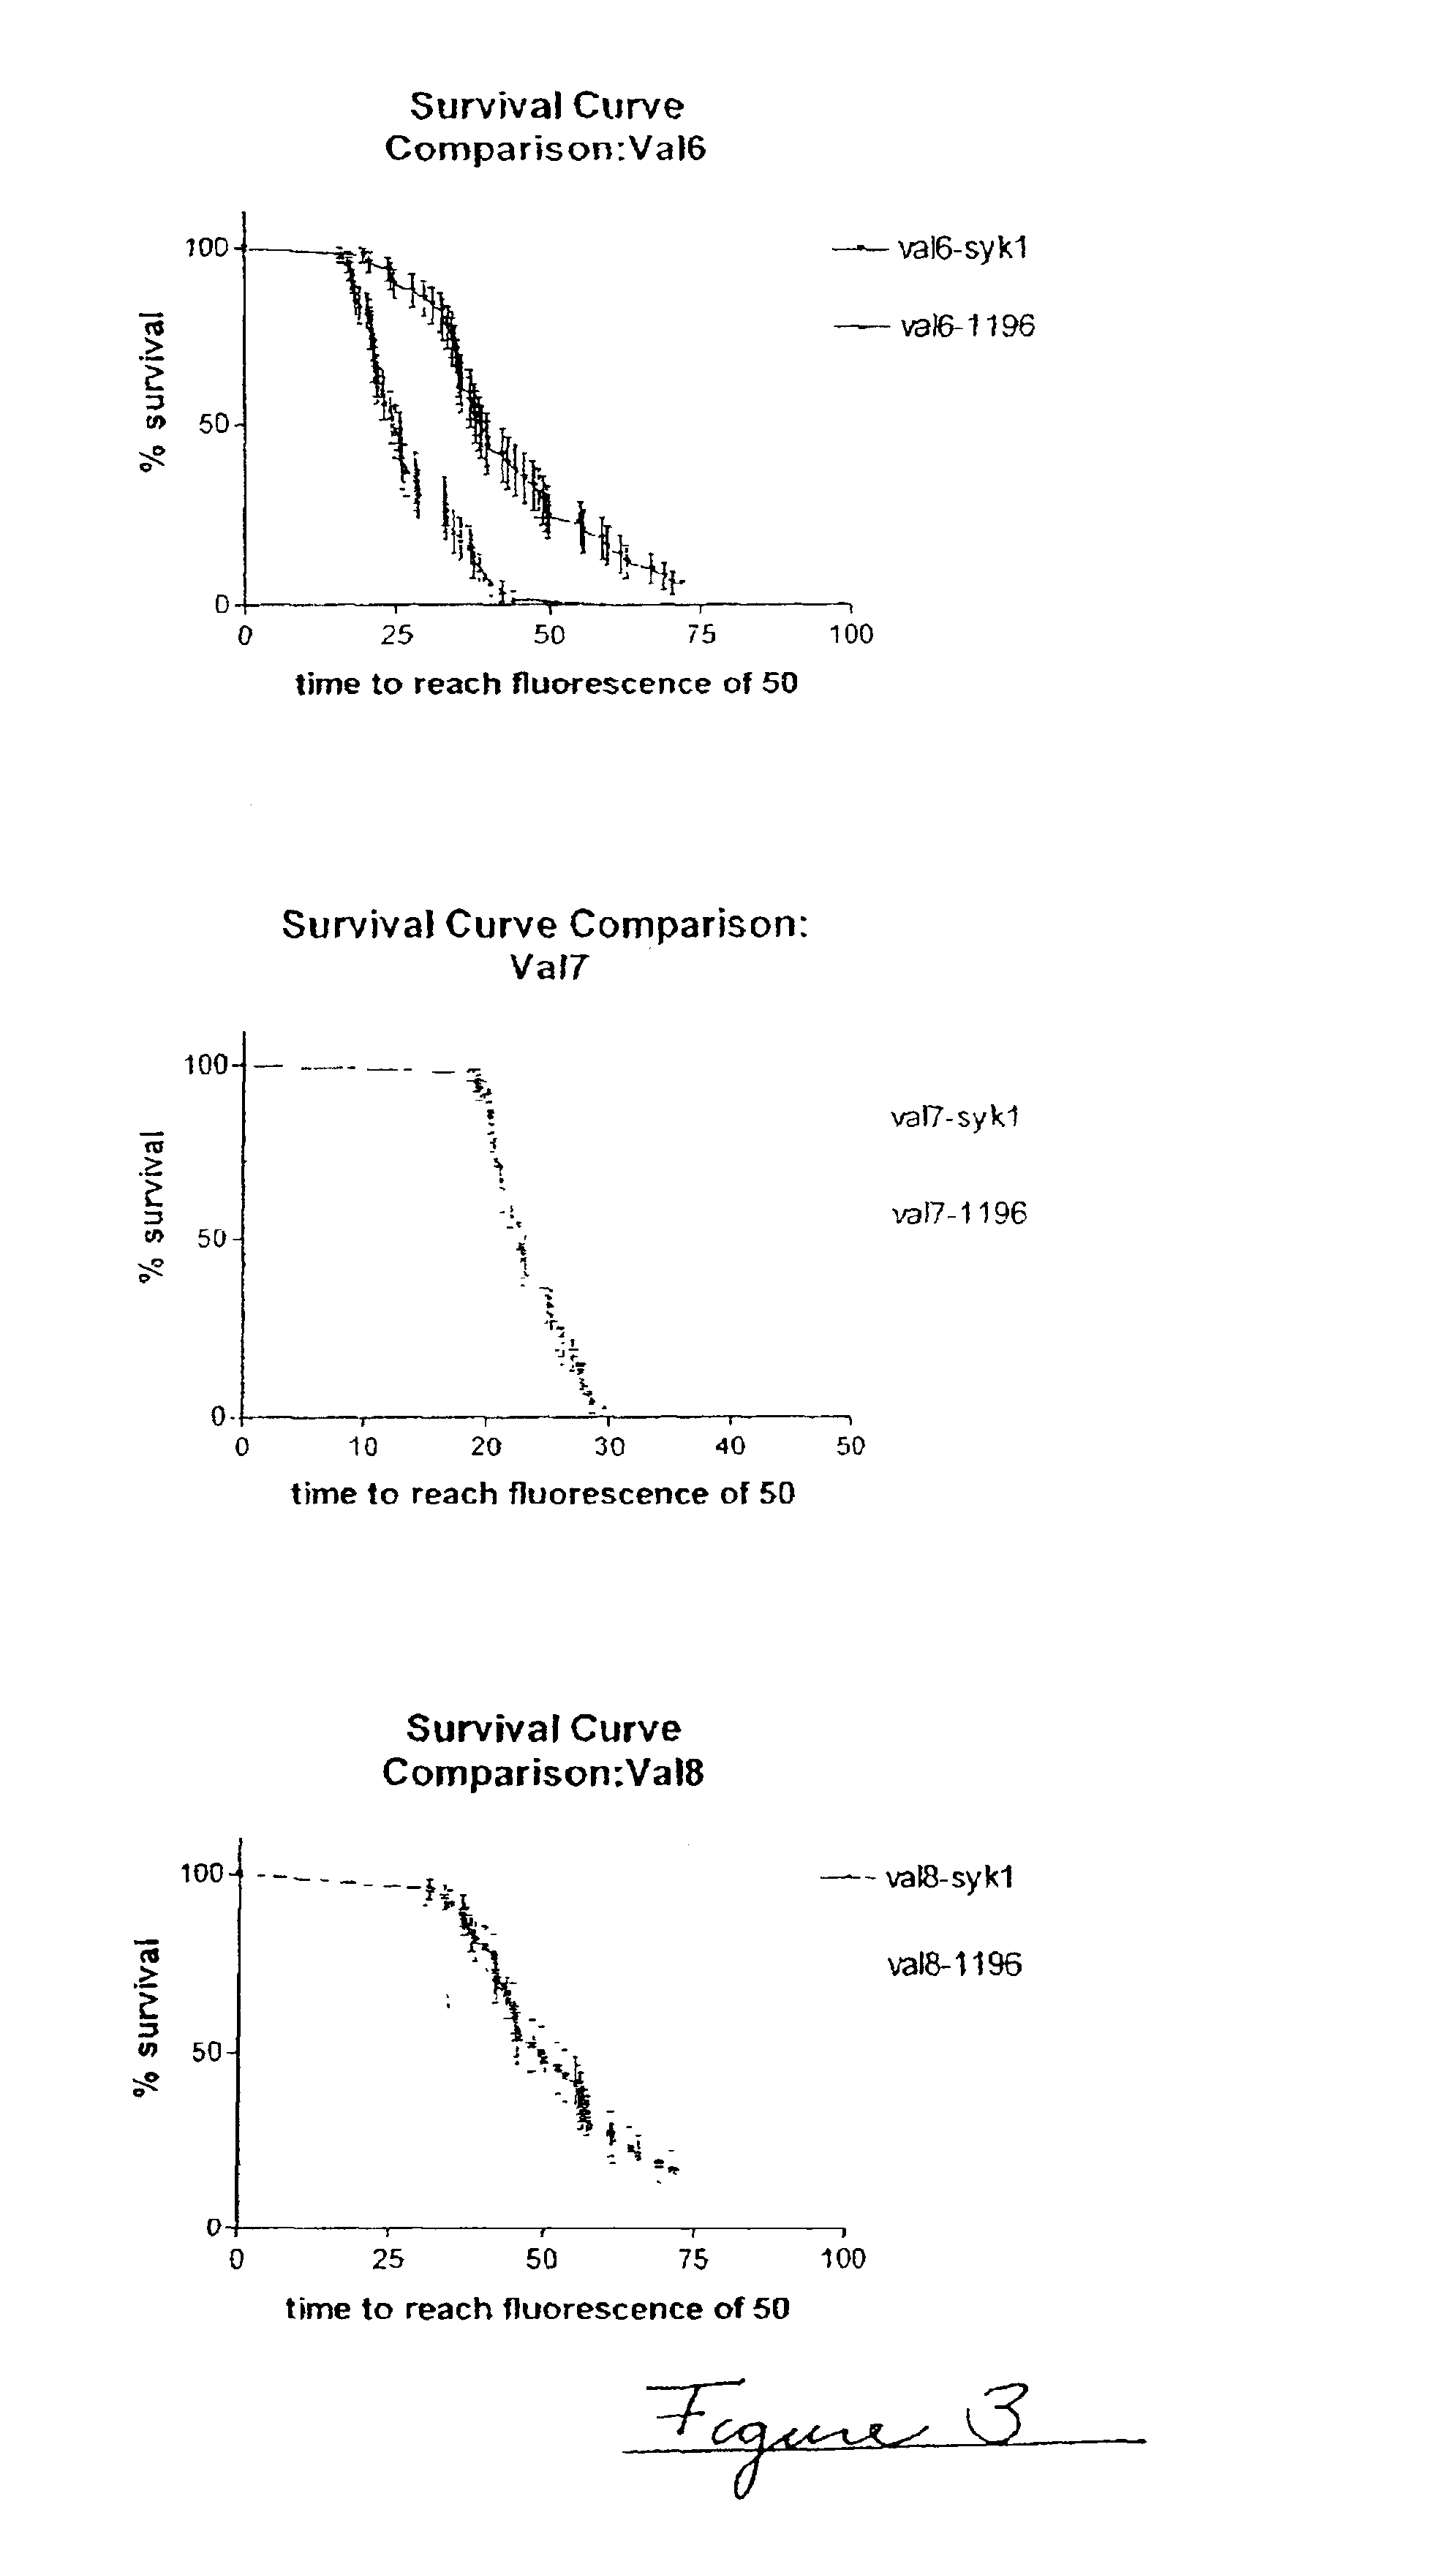
In this example, three experimental runs were conducted to validate the accelerated physical stability method, referred to as Val 6, Val 7 Val 8 (n=3). In these experimental runs, there are 48 samples per sample type (N=48). Each experimental run compares two formulations, one formulation using Diosynth semi-synthetic insulin and the other formulation using Aventis semi-synthetic insulin. Table 3 gives the composition of the protein formulations compared. FIG. 3 shows survival curve analyses for the three runs. Table 4 gives the survival curve analysis for the three different runs.
TABLE 4
PUM
| Property | Measurement | Unit |
|---|---|---|
| volume | aaaaa | aaaaa |
| volume | aaaaa | aaaaa |
| volume | aaaaa | aaaaa |
Abstract
Description
Claims
Application Information
 - R&D
- Intellectual Property
- Life Sciences
- Materials
- Tech Scout
- Unparalleled Data Quality
- Higher Quality Content
- 60% Fewer Hallucinations
Browse by: Latest US Patents, China's latest patents, Technical Efficacy Thesaurus, Application Domain, Technology Topic, Popular Technical Reports.
© 2025 PatSnap. All rights reserved.Legal|Privacy policy|Modern Slavery Act Transparency Statement|Sitemap|About US| Contact US: help@patsnap.com


