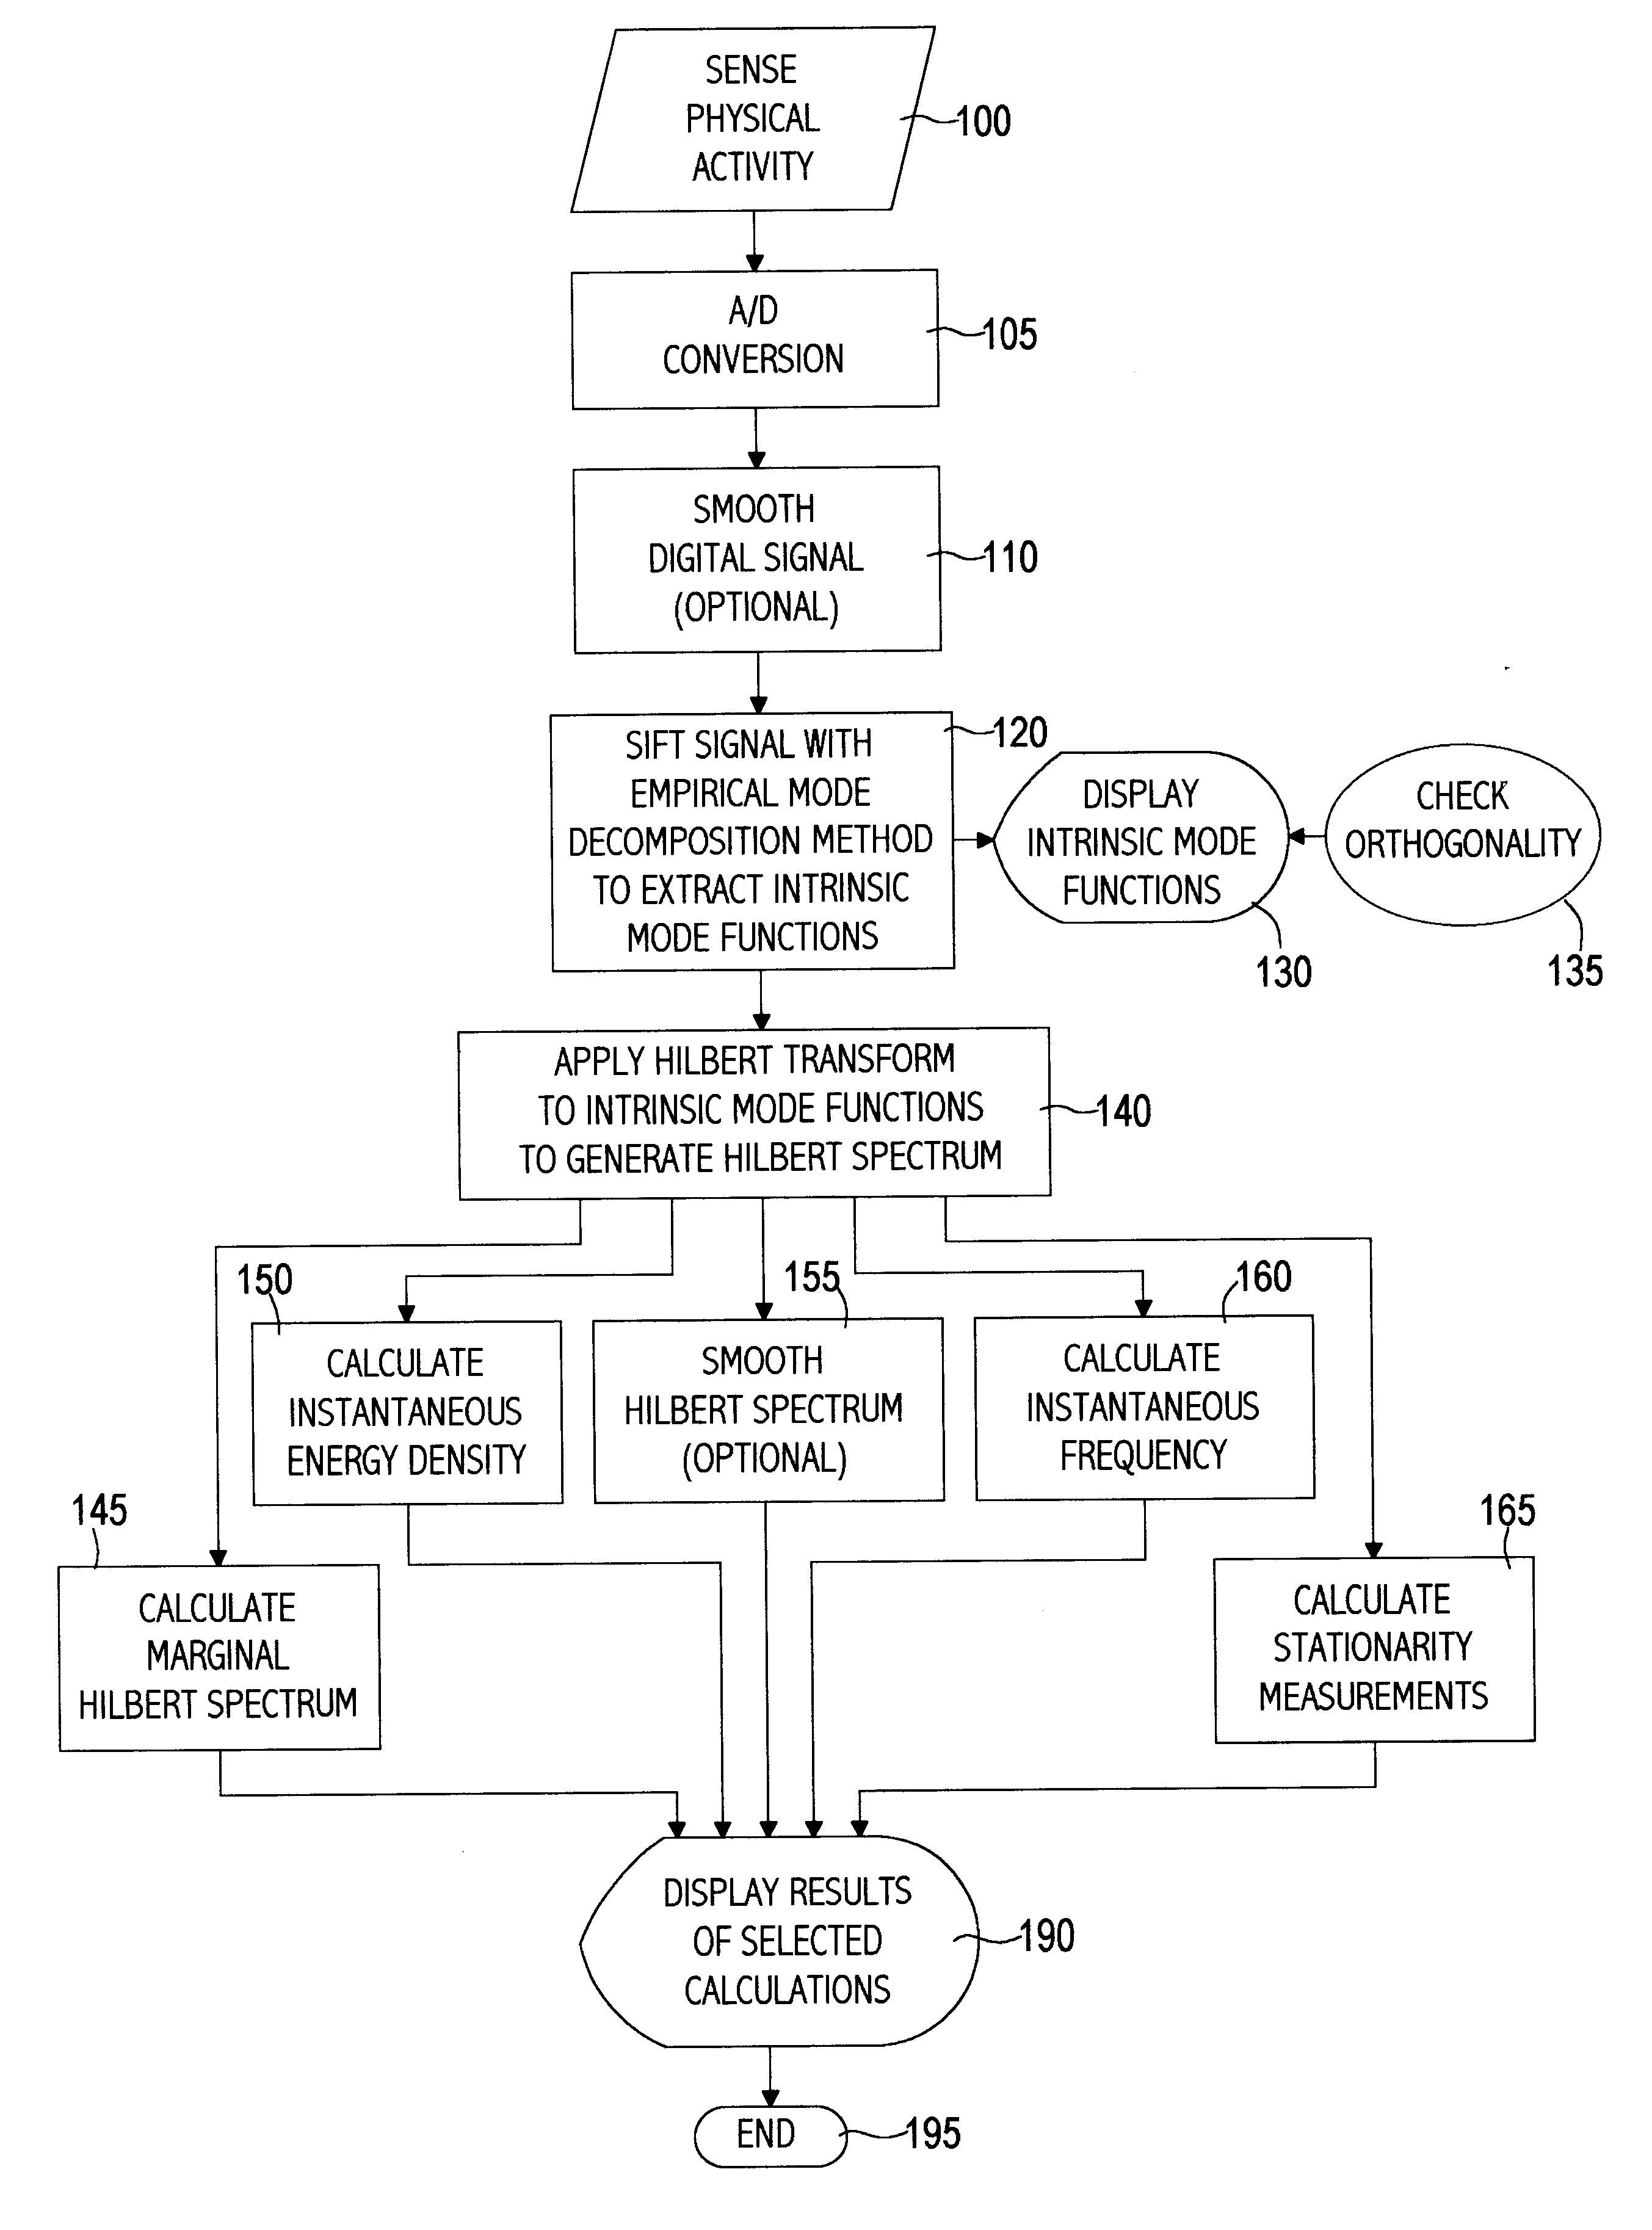
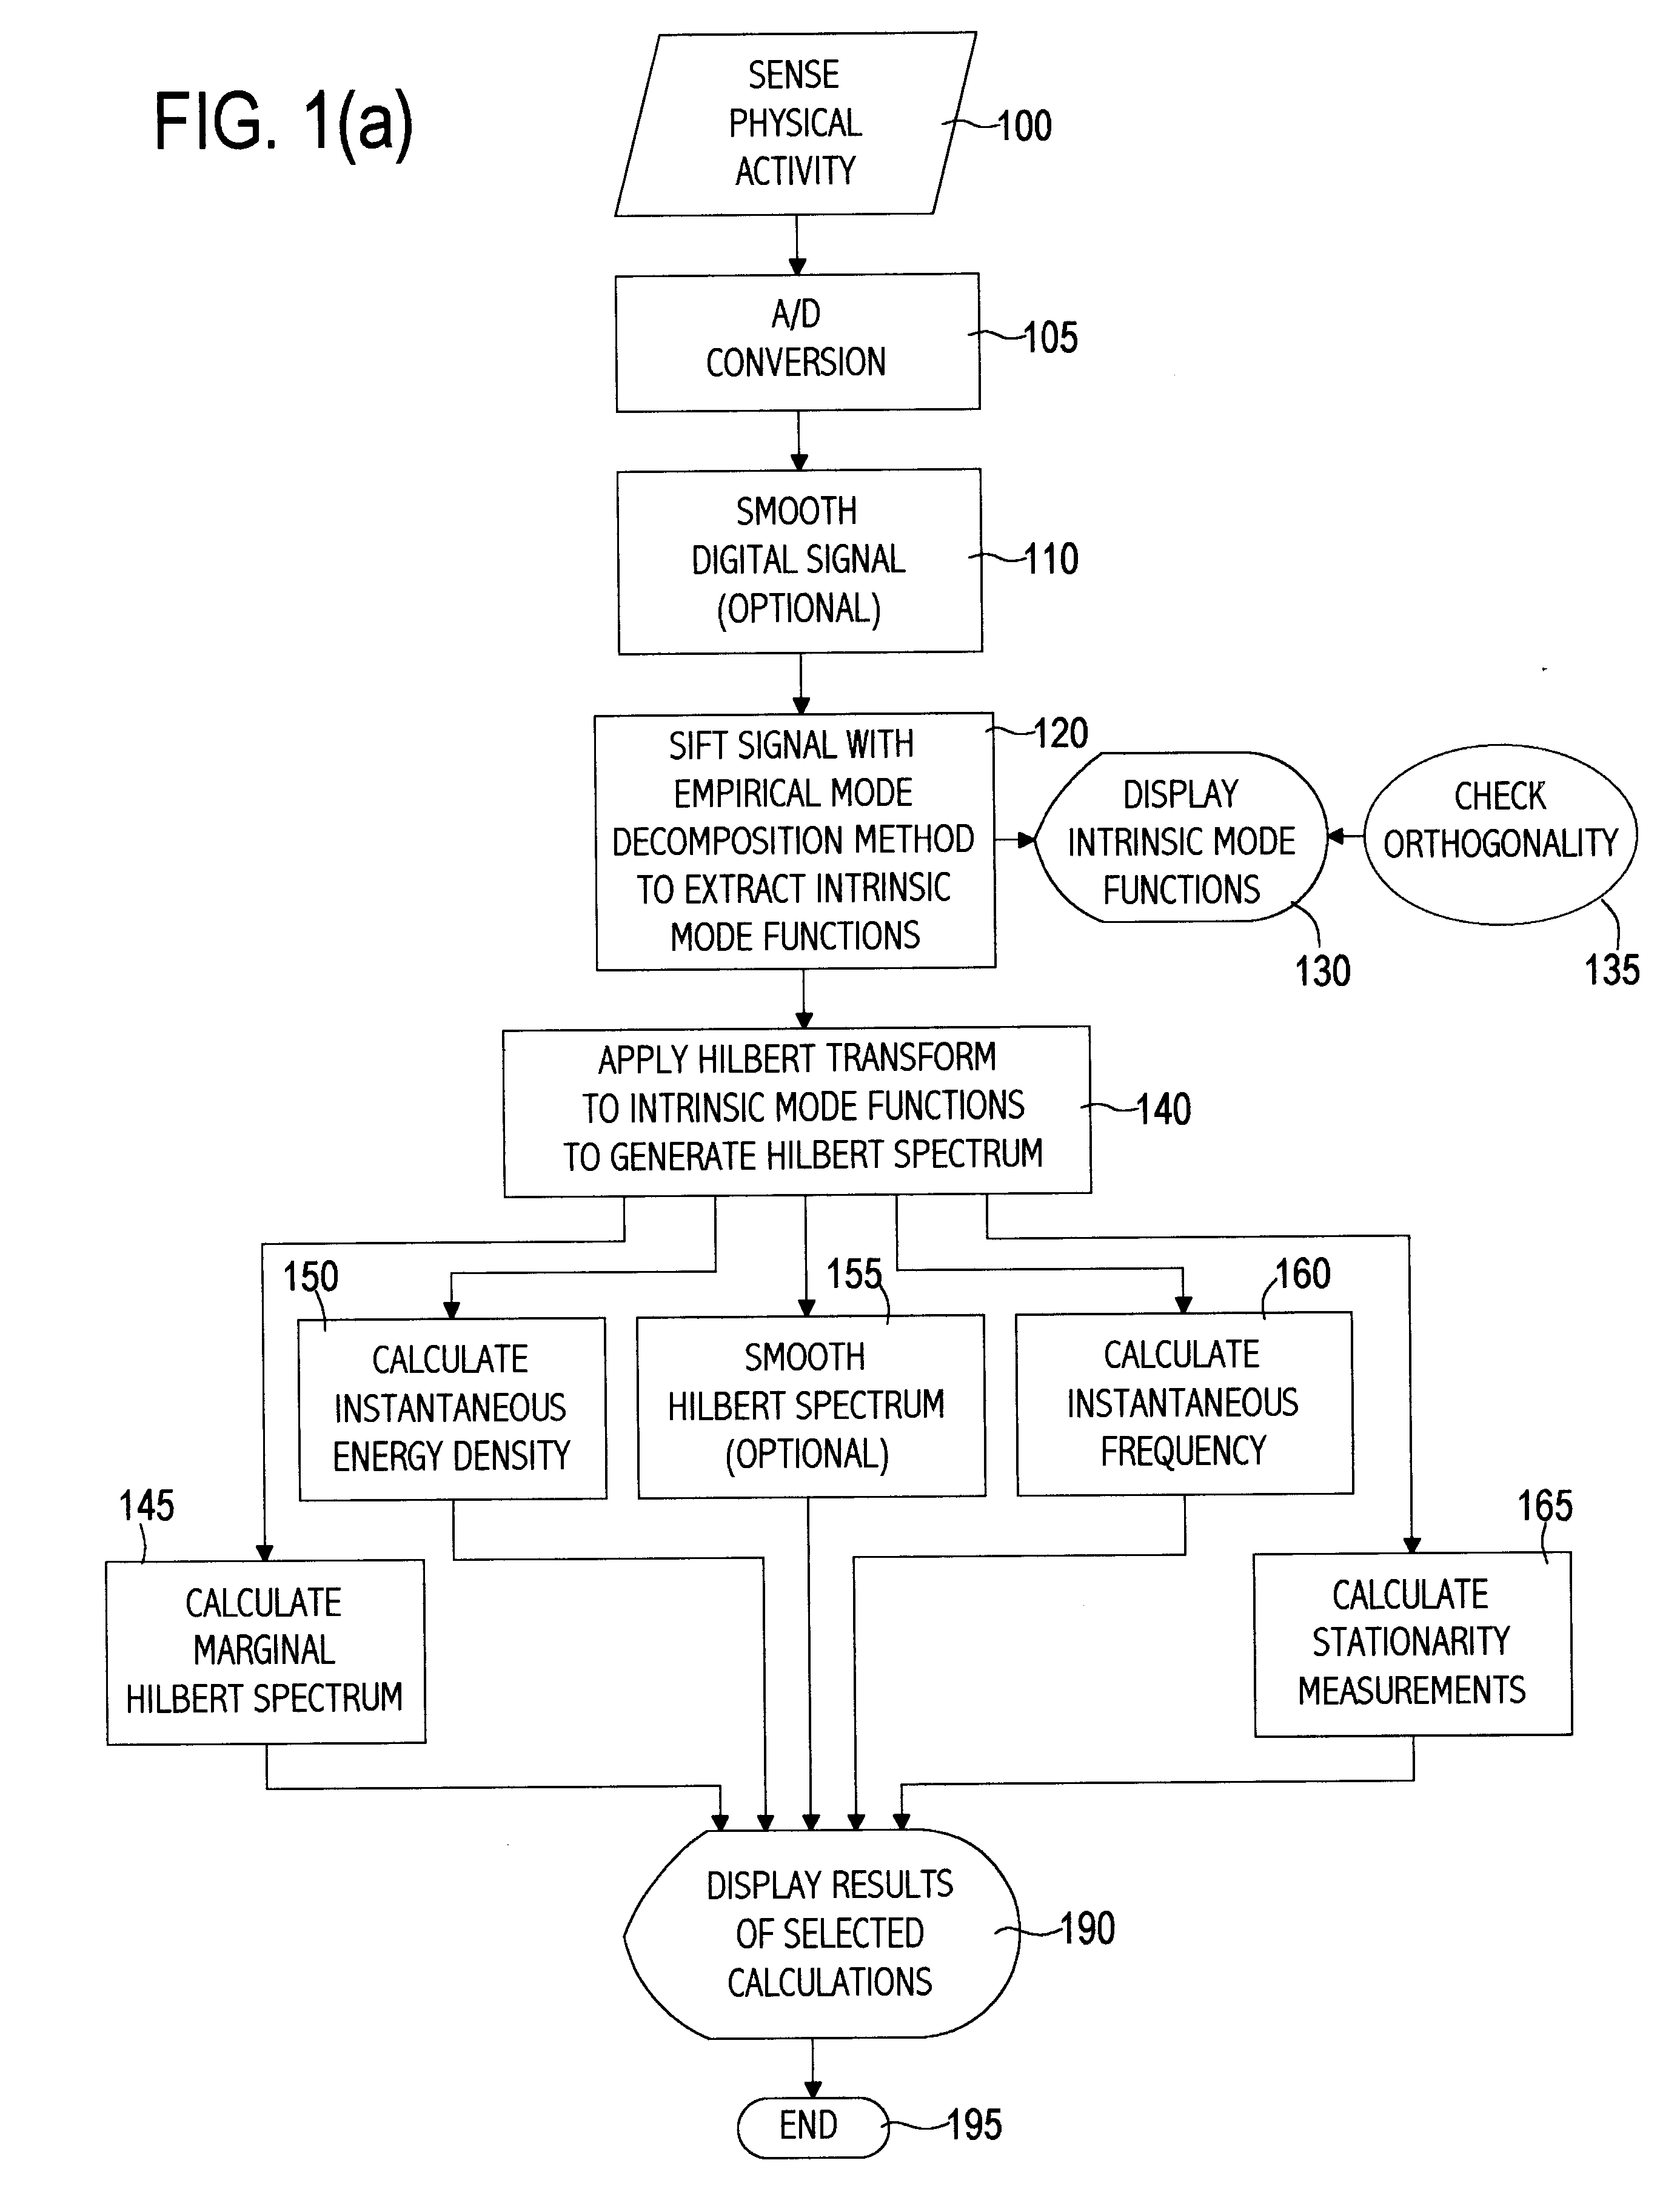
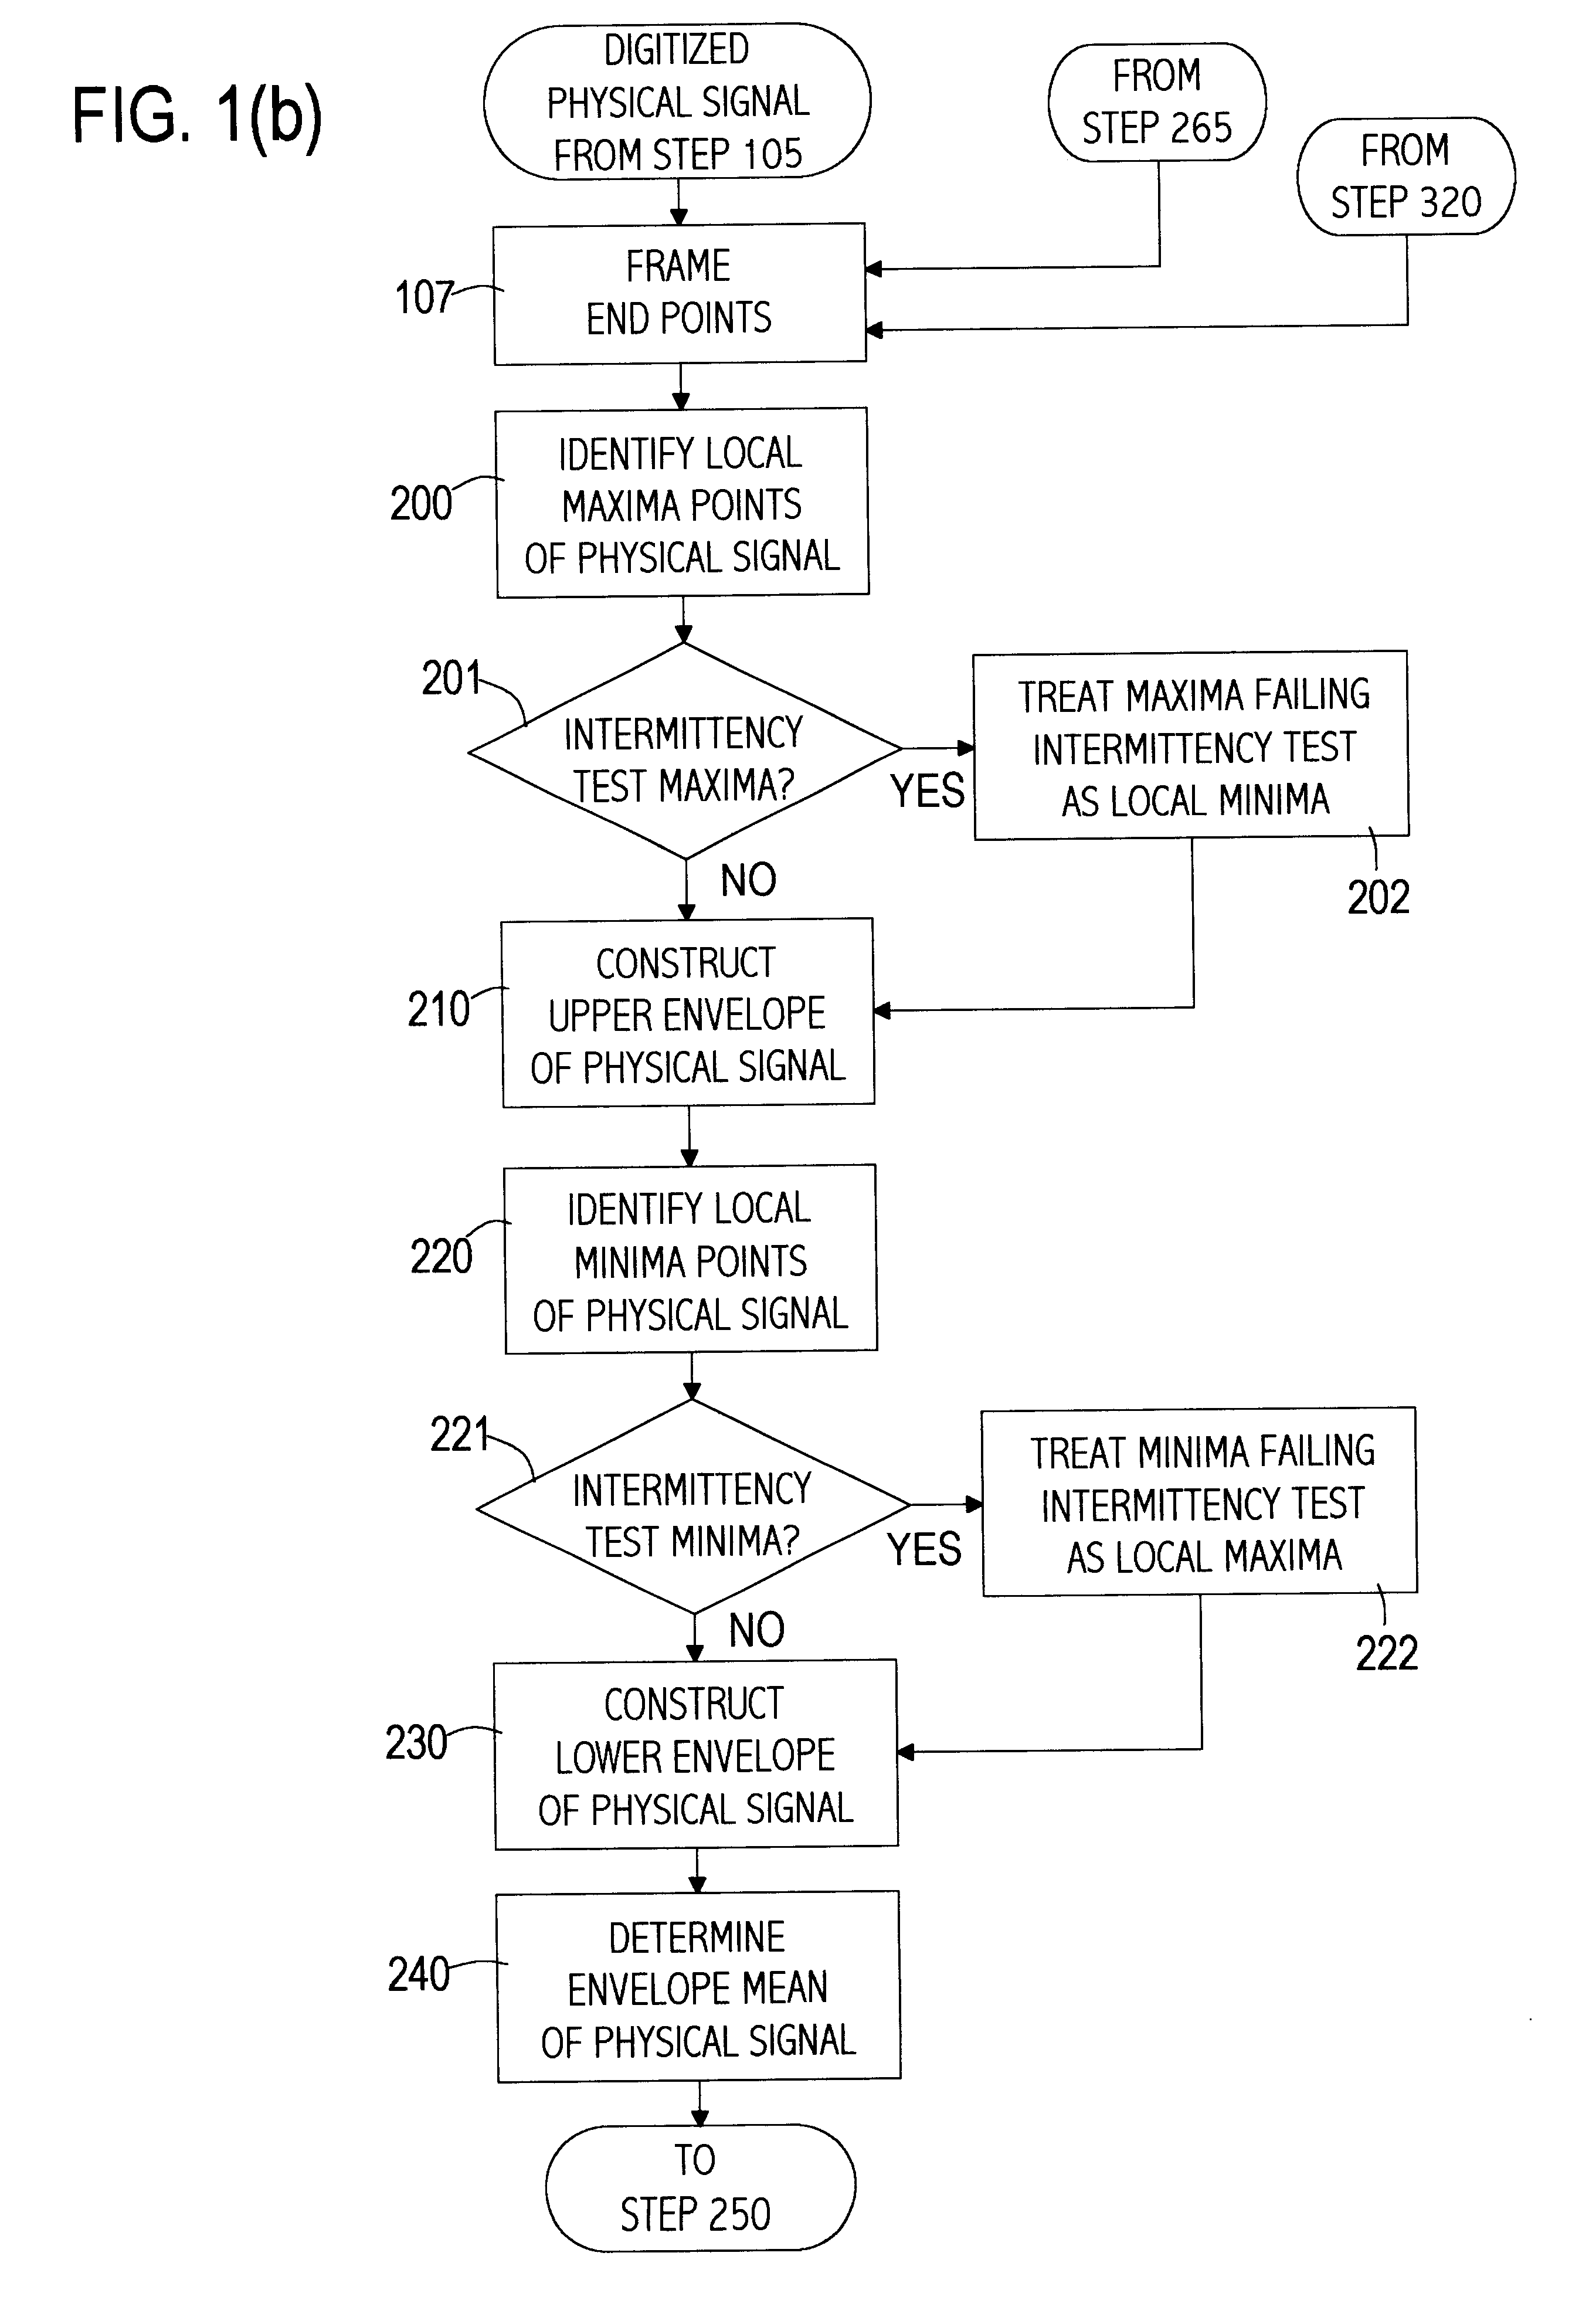
Previously, analyzing signals, particularly those having nonlinear and / or nonstationary properties, was a difficult problem confronting many industries.
Unfortunately, previous methods have not yielded results which are physically meaningful.
(a) The total data span is too short;
(b) The data are nonstationary; and
(c) The data represent nonlinear processes.
Although problems (a)-(c) are separate issues, the first two problems are related because a data section shorter than the longest time scale of a stationary process can appear to be nonstationary.
This assumption may lead to inaccurate results and incorrect interpretation of the underlying
physics as explained below.
Although the
Fourier transform that is applied by these computer implemented methods is valid under extremely general conditions, there are some crucial restrictions: the
system must be linear, and the data must be strictly periodic or stationary.
If these conditions are not met, then the resulting spectrum will not make sense physically.
Furthermore, imperfect probes / sensors and numerical schemes may contaminate data representative of the phenomenon.
Under these conditions, computer implemented methods which apply Fourier
spectral analysis are of limited use.
For lack of alternatives, however, such methods still apply Fourier
spectral analysis to process such data.
In summary, the indiscriminate use of Fourier
spectral analysis in these methods and the adoption of the stationarity and
linearity assumptions may give inaccurate results some of which are described below.
Thus, the Fourier components might make mathematical sense, but they often do not make physical sense when applied.
Although no physical process can be represented exactly by a
delta function, some physical data such as the near field strong
earthquake energy signals are of extremely
short duration.
Furthermore, both nonstationarity and nonlinearity can induce spurious
harmonic components that cause unwanted energy spreading and artificial frequency smearing in the
Fourier spectrum.
In other words, the nonstationary, stochastic nature of
biological data suffers from conventional
signal processing techniques and makes the interpretation of the processed data quite difficult.
Many of the aforementioned
signal processing problems exist when biological signals are processed.
Thus, the complex biological phenomena producing such data cannot be readily understood and is, in any event, represented imprecisely.
The interpretation of the results of such conventionally processed data may, therefore, be quite difficult.
The conventional techniques also make accurate modelling of the biological phenomena very difficult and, sometimes, impossible.
With the
physical approach and the approximation adopted here, the inventive method does not always guarantee a perfect instantaneous frequency under all conditions.
Other than these theoretical difficulties, on the practical side, serious problems of the spline fitting can occur near the ends, where the cubic spline being fit can have large swings.
Left by themselves, the end swings can eventually propagate inward and corrupt the whole data span especially in the
low frequency components.
Unfortunately, the effects of the second condition, when carried to the extreme, could obliterate the physically meaningful amplitude fluctuations.
As mentioned above, fitting a curve to a signal is not always possible.
The reasons include too many data points for efficient
curve fitting and nonlinear data that does not admit an acceptable curve fit.
Although the mean can be treated as a zero reference, defining it is difficult, for the whole process is transient.
In fact, a physically meaningful mean for such data is impossible to define using
standard methods.
The components with the highest frequencies add little more energy, but they make the data look more complicated.
In fact, the highest frequency component is probably not physical, for the digitizing rate of the Pitot tube is too slow to capture the
high frequency variations.
Although the Hilbert transform can treat the monotonic trend as part of a longer oscillation, the energy involved in the residual trend could be overpowering.
Furthermore, a lower
frequency resolution saves computation time for the computer implemented method.
Such definitions are both overly stringent and useless at the same time: few data sets can satisfy the rigor of these definitions; consequently, no one even bothers using them to check stationarity of the signal.
Stationarity can be a complicated property of the process: for any signal shorter than a typical long
wave period, the process may look transient.
Such a time scale, however, is hard to define precisely for
high dimensional, nonstationary dynamic systems.
The wide fluctuations of frequency values in the FIG. 14(b)
Hilbert spectrum make any visual mean
estimation exceedingly difficult.
However, the
Hilbert spectrum clearly depicts the fluctuation of energy over frequencies without allowing the frequency of oscillation to be variable in the whole time window.
However, there is no definitive way to
handle this overwhelmingly complex data to reveal the underlying physiological variations.
This is a common condition in which the
airway is temporarily obstructed during sleep causing the subject to eventually gasp for air.


