Optimal windows for obtaining optical data for characterization of tissue samples
a tissue sample and optical data technology, applied in the field of spectroscopic methods, can solve problems such as the optimal time period, and achieve the effect of improving the sensitivity and specificity of optical diagnostic screening
- Summary
- Abstract
- Description
- Claims
- Application Information
AI Technical Summary
Benefits of technology
Problems solved by technology
Method used
Image

Examples
example 1
Analysis of the Temporal Evolution of Spectral Data from Reference Samples with Known States of Health.
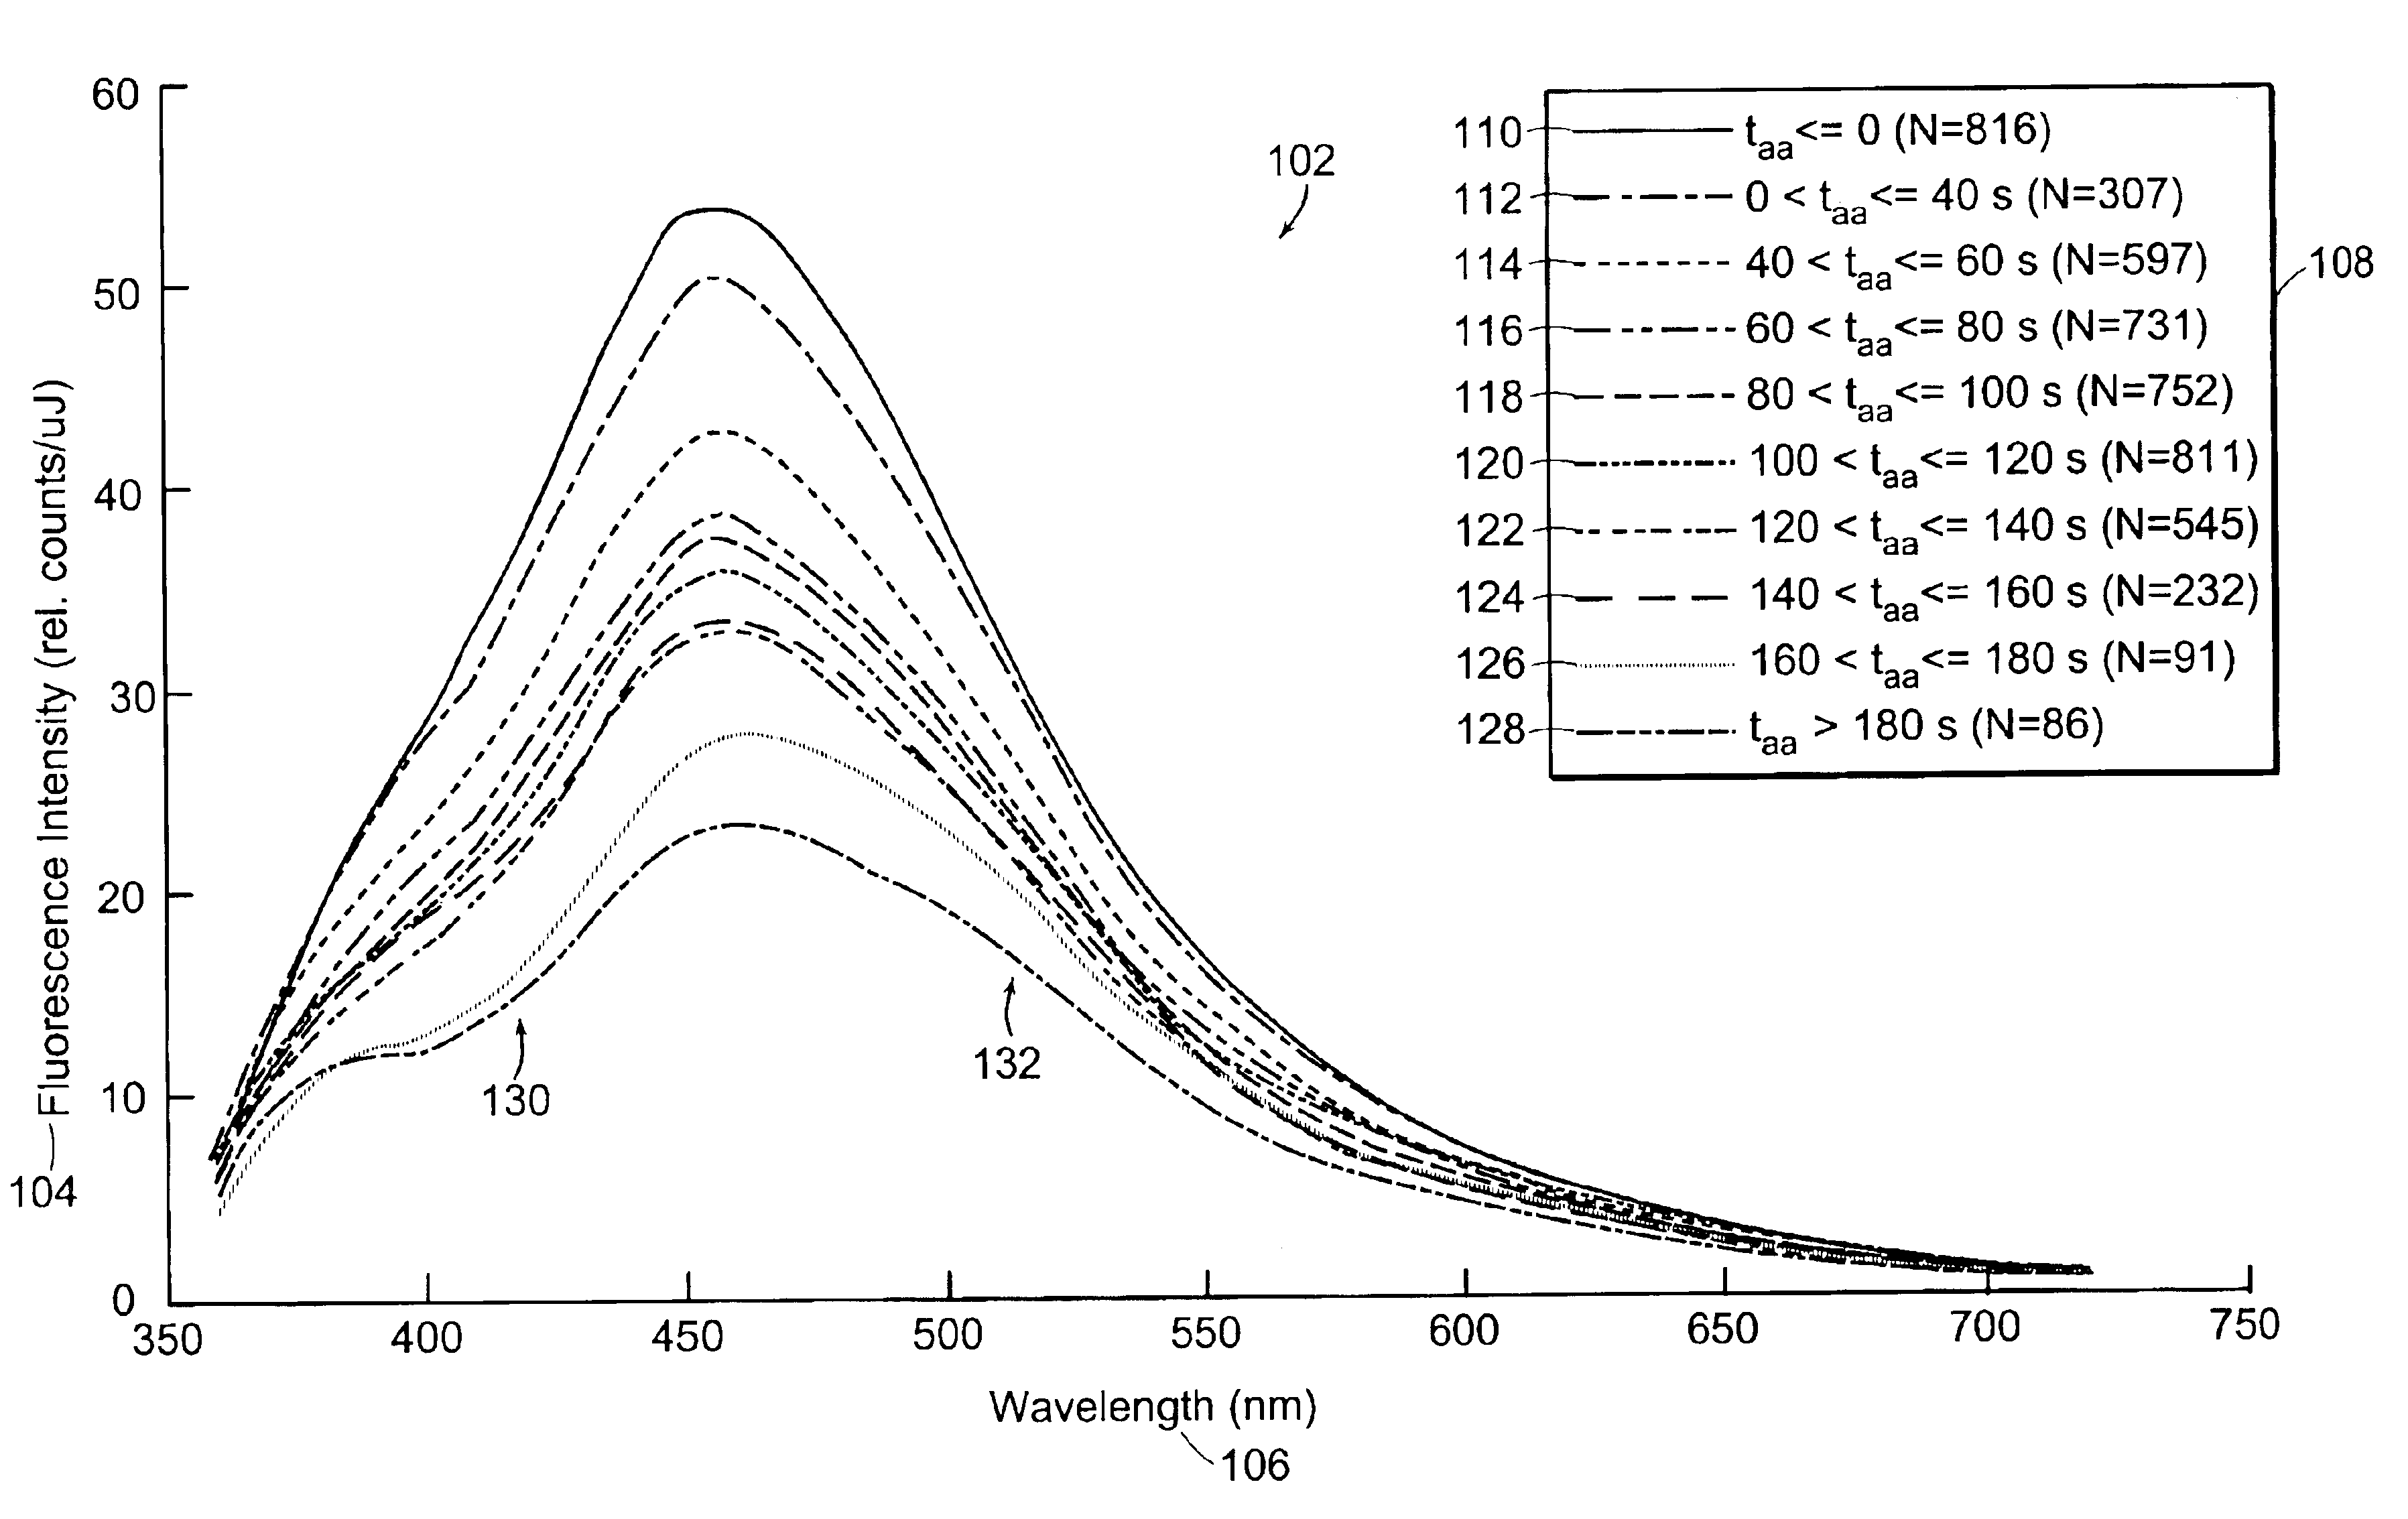
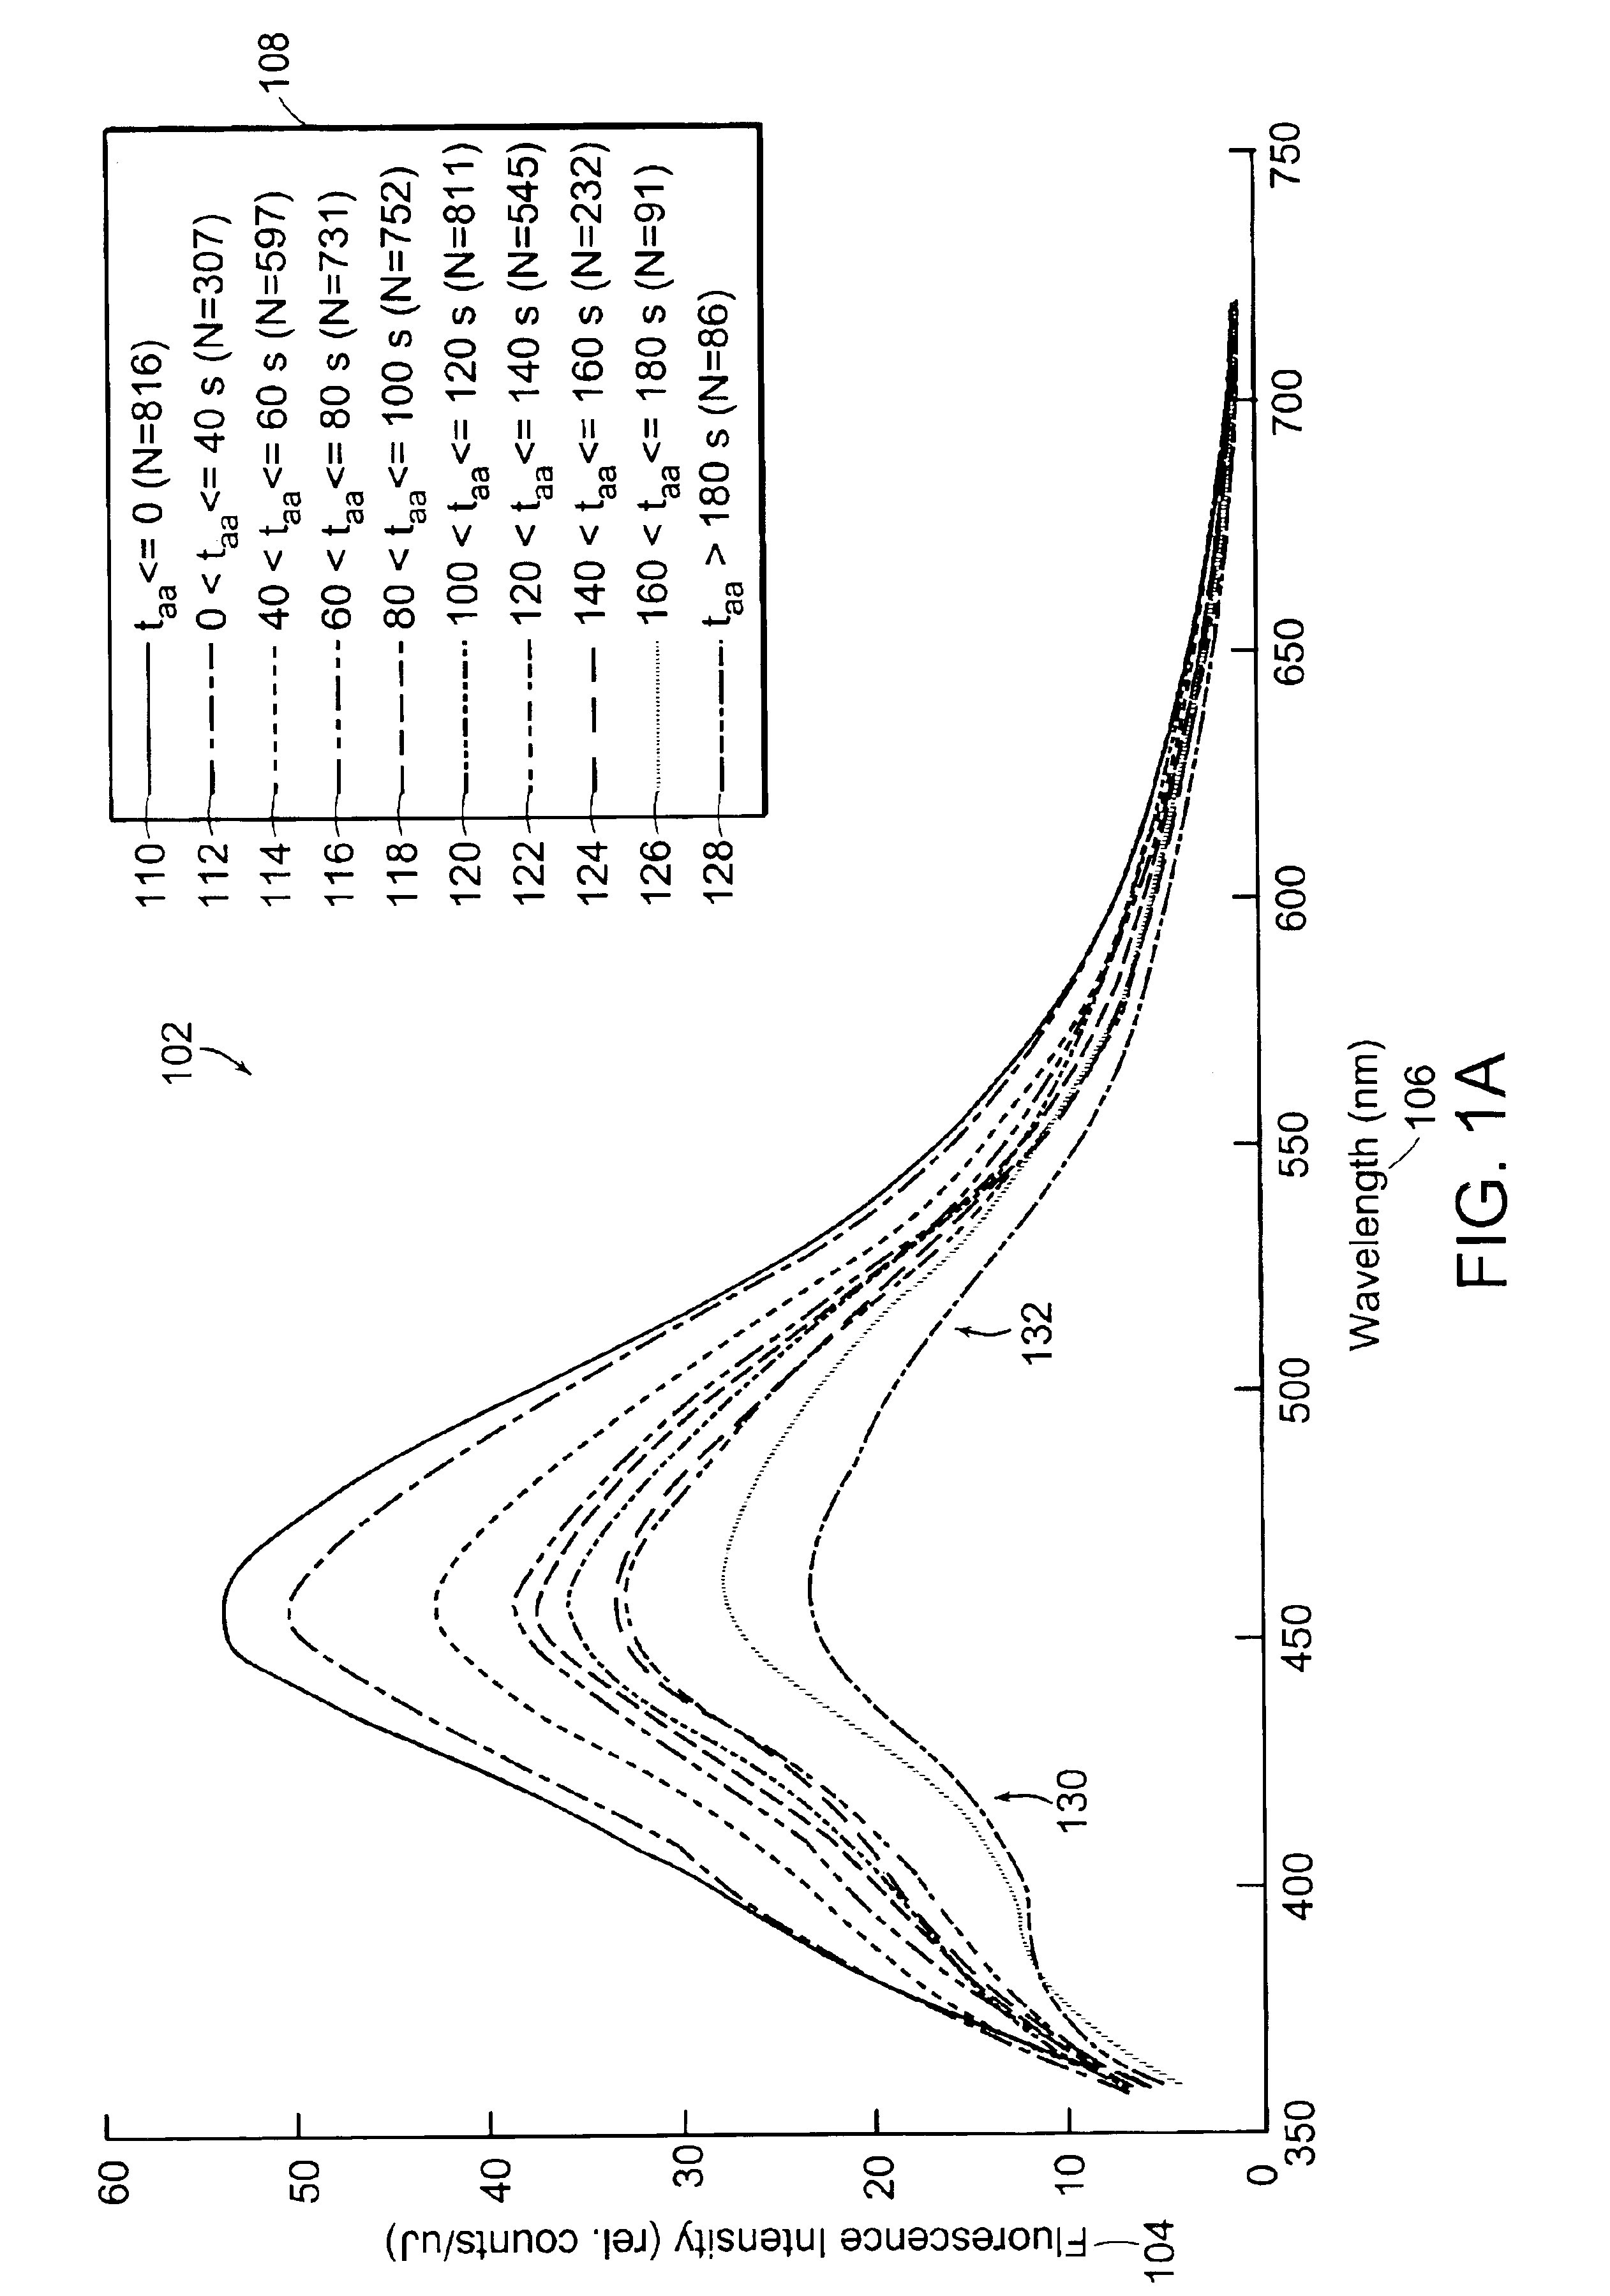
[0042]Diffuse reflectance and / or 337-nm fluorescence emission spectra are taken from cervical tissue samples that are categorized as CIN 2 / 3 (having grades 2 and / or 3 cervical intraepithelial neoplasia), CIN 1 and NED (no evidence of disease, confirmed by pathology, including normal squamous tissue, normal columnar tissue, immature metaplasia tissue, and mature metaplasia tissue). All spectra are filtered then placed in the time bins indicated in Table 1. Data affected by arifacts such as glare, shadow, or obstructions may be removed and / of compensated for by using the technique disclosed in the co-owned U.S. patent application entitled, “Method and Apparatus for Identifying Spectral Artifacts,” filed on Sep. 13, 2002, and identified by attorney docket number MDS-033, the contents of which are hereby incorporated by reference. Means spectra and standard deviations are calculated fo...
example 2
Analysis of Optical Kinetic Data from Reference Samples with Known States of Health.
[0049]Data from FIGS. 1A, 1B, 2A, and 2B are further analyzed as shown in FIGS. 3A, 3B, 3C, and 3D. FIG. 3A shows a graph 302 depicting the time response of fluorescence intensity relative to pre-AA (fluorescence prior to application of acetic acid) 304 of NED tissue at 390, 460 and 600 nm wavelengths following application of acetic acid. FIG. 3B shows a graph 320 depicting the time response of reflectance relative to pre-AA 322 for NED tissue at 425, 500, and 630 nm wavelengths following application of acetic acid. FIG. 3C shows a graph 350 depicting the time response of fluorescence intensity relative to pre-AA 304 of CIN 2 / 3 tissue at 390, 460, and 600 nm wavelengths following application of acetic acid. FIG. 3D shows a graph 370 depicting the time response of reflectance relative to pre-AA 322 for CIN 2 / 3 tissue at 425, 500, and 630 nm wavelengths following application of acetic acid.
[0050]The fl...
example 3
Using a Discrimination Function to Determine Optimal Windows for Obtaining Diagnostic Optical Data.
[0058]An embodiment of the invention comprises determining an optimum window for obtaining diagnostic spectral data using fluorescence and / or reflectance time-response data as shown in the above figures, and as discussed above. In one embodiment, an optimum window is determined by tracking the difference between spectral data of various tissue types using a discrimination function.
[0059]In one embodiment, the discrimination function shown below in Equation (1) is used to extract differences between tissue types: D(λ)=μ(test(λ))NED PATH1-μ(test(λ))CIN23ALLσ2(test(λ)NED PATH1=σ2(test(λ))CIN23ALL(1)
The quantity μ corresponds to the mean optical signal and σ corresponds to the standard deviation. In one embodiment, the optical signal includes diffuse reflectance. In another embodiment, the optical signal includes 337-nm fluorescence emission spectra. Other embodiments use fluor...
PUM
 Abstract
Description
Claims
Application Information
PatSnap Eureka turns technology decisions into work you can execute. Powered by our Innovation Knowledge Graph, it runs expert workflows across engineering, life sciences, materials and intellectual property. Get your review-ready output in minutes.


