Differential labeling for quantitative analysis of complex protein mixtures

a technology differential labeling, which is applied in the field of differential labeling for quantitative analysis of complex protein mixtures, can solve the problems of difficult to explain the mechanism of biological processes by genomic analysis alone, and no protein analytical technology approaches the throughput and level of automation of genomic technology, and achieves high specificity

Inactive Publication Date: 2005-11-29
SYNGENTA PARTICIPATIONS AG
View PDF21 Cites 8 Cited by
  • Summary
  • Abstract
  • Description
  • Claims
  • Application Information

AI Technical Summary

Problems solved by technology

The interpretation of the data obtained by these techniques in the context of the structure, control and mechanism of biological systems has been recognized as a considerable challenge.
In particular, it has been extremely difficult to explain the mechanism of biological processes by genomic analysis alone.
At present no protein analytical technology approaches the throughput and level of automation of genomic technology.
However, the sequential manner in which samples are processed limits the sample throughput, the most sensitive methods have been difficult to automate and low abundance proteins, such as regulatory proteins, escape detection without prior enrichment, thus effectively limiting the dynamic range of the technique.
While these approaches accelerate protein identification, the quantities of the analyzed proteins cannot be easily determined, and these methods have not been shown to substantially alleviate the dynamic range problem also encountered by the 2DE / (MS).sup.n approach.
Therefore, low abundance proteins in complex samples are also difficult to analyze by the .mu.LC / MS / MS method without their prior enrichment.
It is therefore apparent that current technologies, while suitable to identify a portion of the components of protein mixtures, are neither capable of measuring the quantity nor the state of activity of the protein in a mixture.
Even improvements of the current approaches are unlikely to advance their performance sufficiently to make routine quantitative and functional proteome analysis a reality.
While these techniques are quite sensitive, they do not necessarily provide chemical separation of products and may, as a result, be difficult to use for assaying several proteins or enzymes simultaneously in a single sample.
Current methods may not distinguish among aberrant expression of different enzymes or their malfunctions which lead to a common set of clinical symptoms.

Method used


Image

  • Differential labeling for quantitative analysis of complex protein mixtures
  • Differential labeling for quantitative analysis of complex protein mixtures
  • Differential labeling for quantitative analysis of complex protein mixtures

Examples


example 1

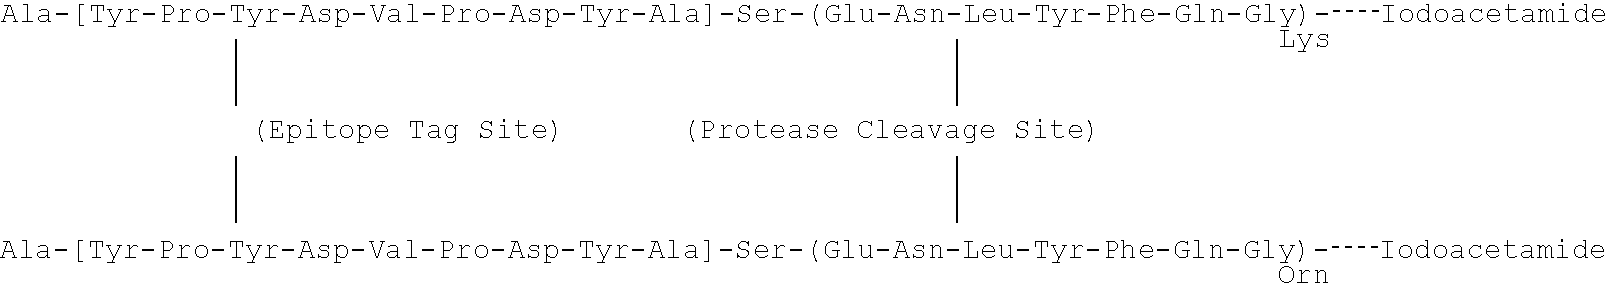
Synthesis of Peptide Labeling Moiety (or Peptide Encoded Tags. "PEPTaps")

A pair of PEPTags, described generally above, was synthesized from peptides with following sequences: Ac-AYPYDVPDYASENLYFQGK (SEQ ID NO: 39) and AYPYDVPDYASENLYFQGOrn (SEQ ID NO: 40). In dry DMF containing excess (2-3 molar equivalents) DIEA, each of the peptides was mixed with two molar equivalents of iodoacetic anhydride for 10 min at room temperature under N.sub.2 gas, to give Lys-PEPTag and Orn-PEPTag, respectively. The reaction was terminated by adding acetic acid. Solvent was removed by vacuum centrifugation, and the product was purified by reverse-phase FPLC, and analyzed by MALDI MS (TofSpec 2E, Micromass, Beverly, Mass.) and ESI MS / MS (API 3, PE Sciex, Foster City, Calif.).

In order to demonstrate that the mass spectrometric ionization efficiency of the two synthesized peptide tags was essentially equal, the two products were mixed in different ratios and analysed by LC-MS. The ratio of the measured pea...

example 2

PEPTag Qualitative Protein Analysis: Simplification of Complex Mixtures

We tested the PEPTag method, described generally herein, on Bovine Serum Albumin (BSA). 200 .mu.L BSA (0.25 mg / mL) was denatured and reduced in a solution containing 0.1% SDS, 5 mM tributyl phosphine and 50 mM Tris buffer (pH 8.5) for 3 min at 100.degree. C. and for 1 hour at 37.degree. C. The side chains of cysteinyl residues were derivatized with a tenfold molar excess of Lys-PEPTag. Tagged protein was digested by trypsin overnight at 37.degree. C. Trypsin activity was quenched with trypsin inhibitor and the peptide mixture bound to anti-HA affinity matrix for 2 hours at 4.degree. C. The anti-HA resin with bound peptides was washed in equilibration-buffer (20mM Tris, pH 7.5; 0.1 M NaCl; 0.1 mM EDTA), 3.times.10 min. at 4.degree. C. The bound peptides were cleaved from the matrix by incubation with TEV protease for 6 hours at 30.degree. C. The cleaved peptides were analyzed by either Matrix Assisted Laser Desorp...

example 3

PEPTag Quantitative Protein Analysis: Differential Labeling

We tested the PEPTag quantitative strategy on two mixtures containing the same two proteins at different concentrations. Mixture 1 had 500 pmol BSA (0.1 mg / mL) and 400 pmol .beta.-lactoglobulin (0.1 mg / mL) and was reacted with 9 nmol Lys-PEPTag. Mixture 2 had 250 pmol BSA (0.05 mg / mL) and 800 pmol .beta.-lactoglobulin (0.2 mg / mL) and was reacted with 9 nmol Orn-PEPTag. Protein denaturation, reduction, tagging, and digestion were the same as described above. The two samples were combined after tryptic digestions, and bound to anti-HA matrix. TEV digestion and MS analysis were as described in Example 2. Peptides were quantified by measuring, in the MS mode, the relative signal intensities for pairs of peptide ions of identical sequence, tagged with Lys or Orn-PEPTags, respectively. The results are shown in FIGS. 6, 7, and 8 and the following table.

Observed Expected Protein Peptide sequence identified ratio Mean .+-. S.D. ratio...


PUM

PropertyMeasurementUnit
molecular weightaaaaaaaaaa
molecular weightsaaaaaaaaaa
pHaaaaaaaaaa

Abstract

The present invention relates to a method of simultaneously identifying and determining the levels of expression of cysteine-containing proteins in normal and perturbed cells, a method for proteomic analysis, a process for preparing fusion proteins, and compounds of Formula II and III: (II) Acyl-NH--X-[Epitope Tag Site].sub.A -Y-[Protease Cleavage Site]-Z-Link (III) Acyl-NH--X-alk-O-Ph-CH.sub.2 --Z-Link and reagents related thereto.

Description

BACKGROUND OF THE INVENTIONGenomic technology has advanced to a point at which, in principle, it has become possible to determine complete genomic sequences and to quantitatively measure the mRNA levels for each gene expressed in a cell. For some species the complete genomic sequence has now been determined, and for one strain of the yeast Saccharomyces cerevisiae, the mRNA levels for each expressed gene have been precisely quantified under different growth conditions (Velculescu et al., Cell 88:243-251 (1997)). Comparative cDNA array analysis and related technologies have been used to determine induced changes in gene expression at the mRNA level by concurrently monitoring the expression level of a large number of genes (in some cases all the genes) expressed by the investigated cell or tissue (Shalon et al., Genome Res 6:639-645 (1996)). Furthermore, biological and computational techniques have been used to correlate specific function with gene sequences. The interpretation of the...

Claims


Application Information

Patent Timeline
Patent Type & Authority Patents(United States)
IPC IPC(8): G01N33/68
CPCG01N33/6803G01N2458/15G01N2550/00
Inventor HAYNES, PAULWEI, JINGYATES, JOHNANDON, NANCY
Owner SYNGENTA PARTICIPATIONS AG
Why Eureka
Try Eureka