Dynamic instrumentation event trace system and methods

a dynamic instrument and event trace technology, applied in the field of software development tools and environments, can solve the problems of difficult analysis of failure sources, many failure sources may only become apparent, intermittently and unpredictably, etc., and achieve the effect of minimizing the performance impact of the target program and maximizing the discrimination detection

Inactive Publication Date: 2006-05-16
LYNX SOFTWARE TECH
View PDF13 Cites 240 Cited by
  • Summary
  • Abstract
  • Description
  • Claims
  • Application Information

AI Technical Summary

Benefits of technology

[0015]An advantage of the present invention is that the system and methods support a dynamic instrumentation of an executing or executable program. Application programs, shared libraries, operating system kernels and device drivers can all be dynamically instrumented with no advance preparation or modification of the target program. The system and methods of the present invention do not require trace specific instrumentation code to be added to the program or operating system, which allows tracing of binary-only code.
[0016]Another advantage of the present invention is that the system and methods of the present invention are not specific to a proprietary program or useable in only a proprietary environment. Essentially any executable program can be traced provided that the trace point addresses of functions within the program are known.
[0017]A further advantage of the present invention is that the instrumentation of program code performed according to the present invention imposes only a minimal performance impact on the target program. Furthermore, the applied instrumentation does not involve or interfere with the nominal exception handlin...

Problems solved by technology

Although static analysis of program source code can identify potential problems, the most difficult to analyze failure sources are those that only occur when a target program is being executed in its intended execution environment, and even then only intermittently and unpredictably.
Such failure sources most typically occur where the program under analysis must be responsive to real-time events, are subject to resource constrains, or involve complicated interactions between co-executing programs.
Therefore, many failure sources may only become apparent when the program is executed under actual operating conditions.
Known types of failure sources include unhandled events, unexpected contention, consumption, and exhaustion of program resources, latencies and improper code operations in varied circumstances, and the like.
There are, however, a number of problems with the effective use of conventional trace tools.
In many cases, the target hardware or operating environment is not suitable for direct software development use.
However, a complicating factor, is that the program under analysis may be any program, ranging from a dedicated program executing on embedded target hardware to the operating system kernel, device driver, or user-level application program executing on a general purpose computer.
The resulting trace tools are therefore unavailing in any generic or alternate environment and inapplicable to the development of generic or alternate programs.
Another problem encountered by conventional trace tools is that their use directly and substantially affects the system behavior of the program under analysis.
Performance intrusion refers to the added execution overhead incurred whenever a trace point in the instrumented program code is encountered.
In addition to the added execution ...

Method used


Image

  • Dynamic instrumentation event trace system and methods
  • Dynamic instrumentation event trace system and methods
  • Dynamic instrumentation event trace system and methods

Examples


Embodiment Construction

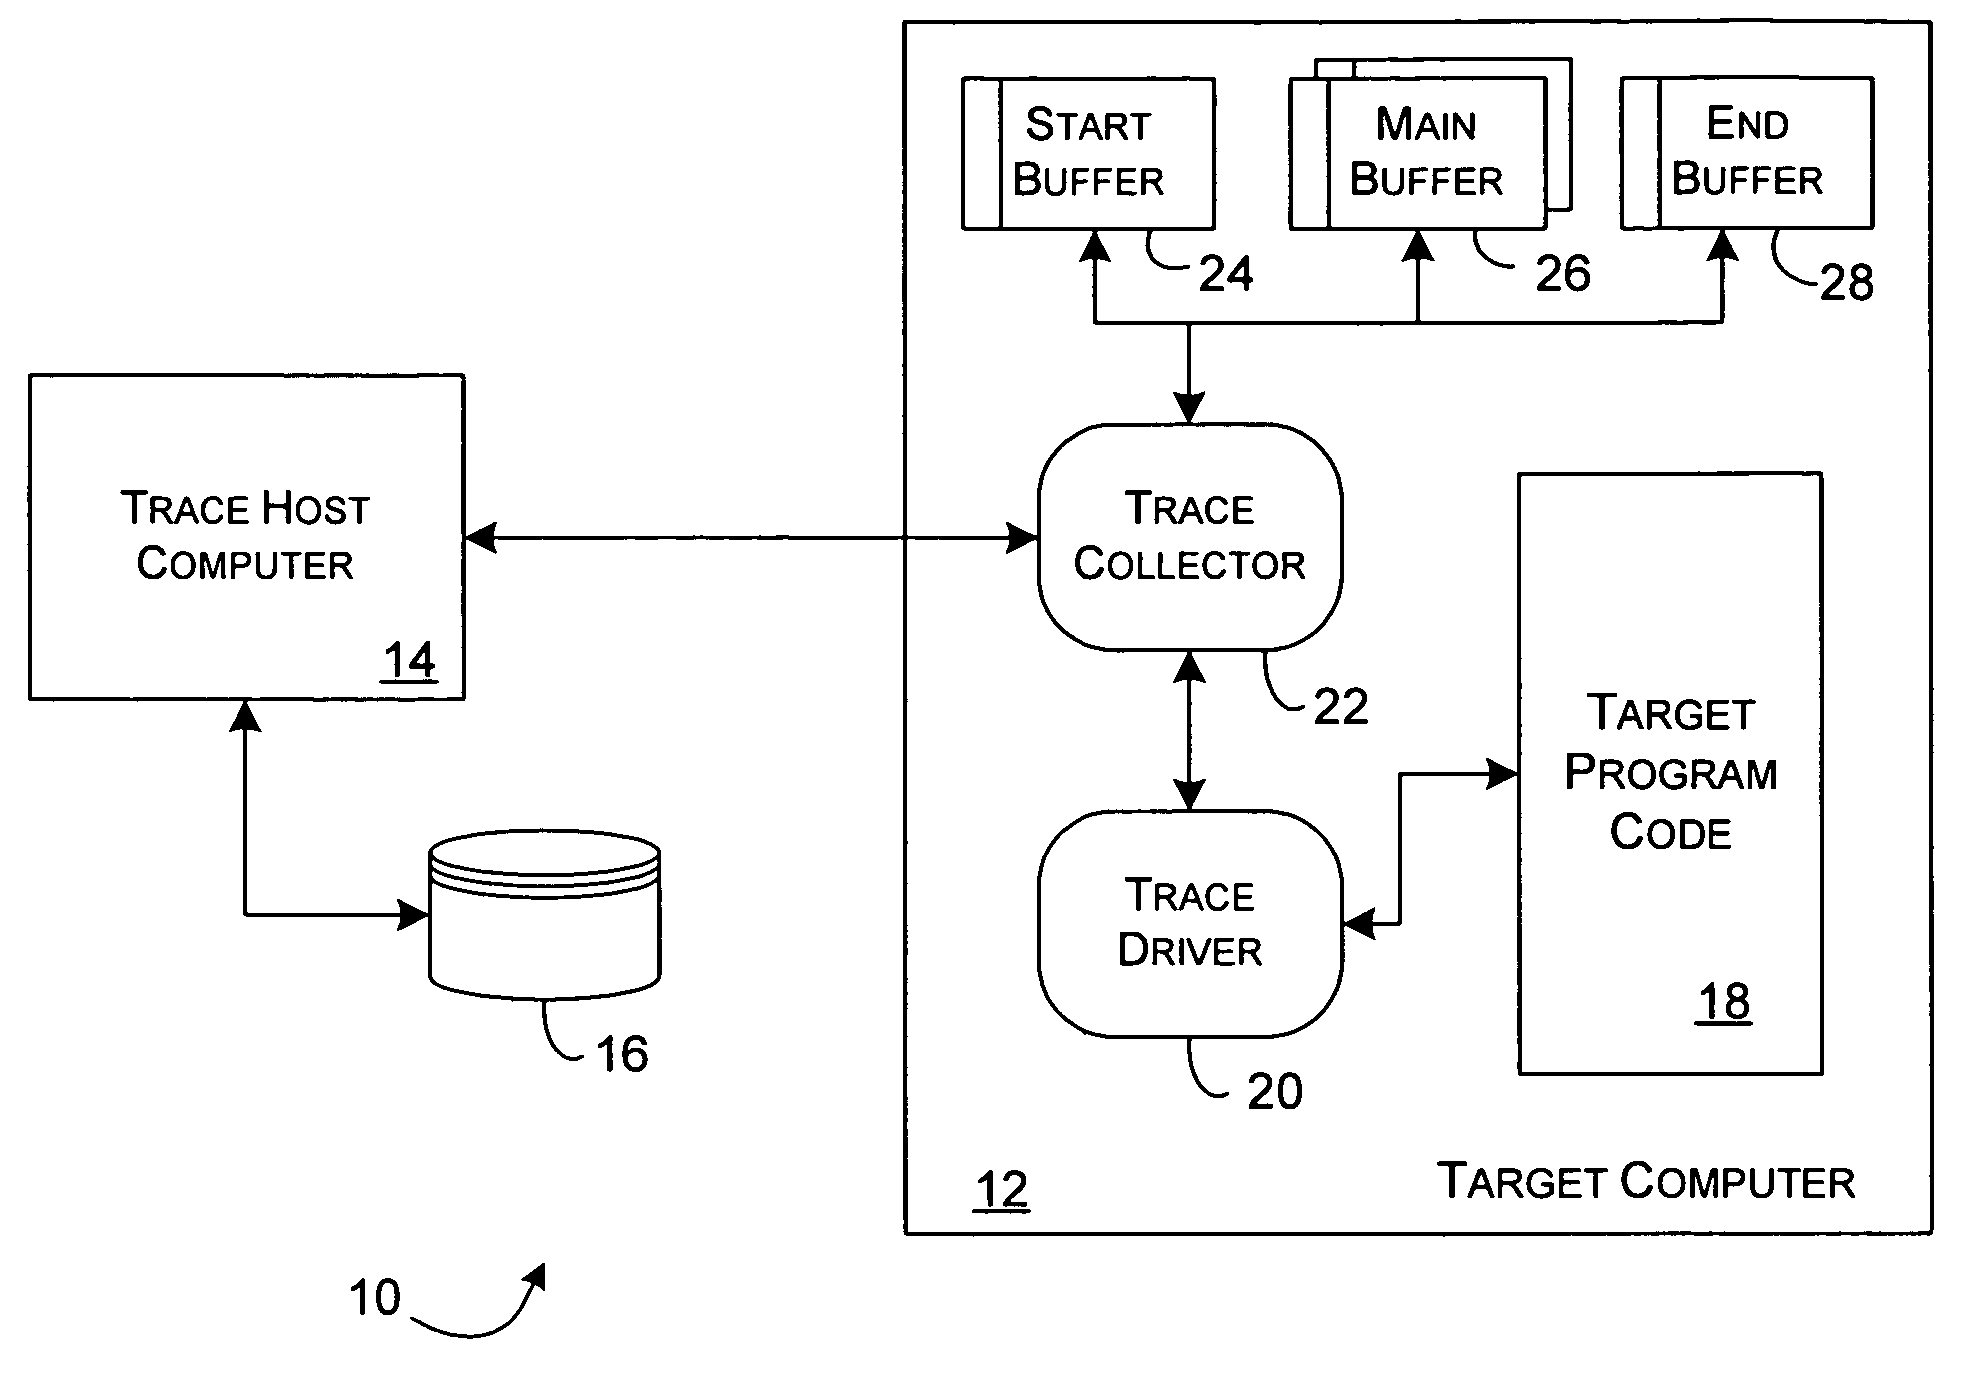
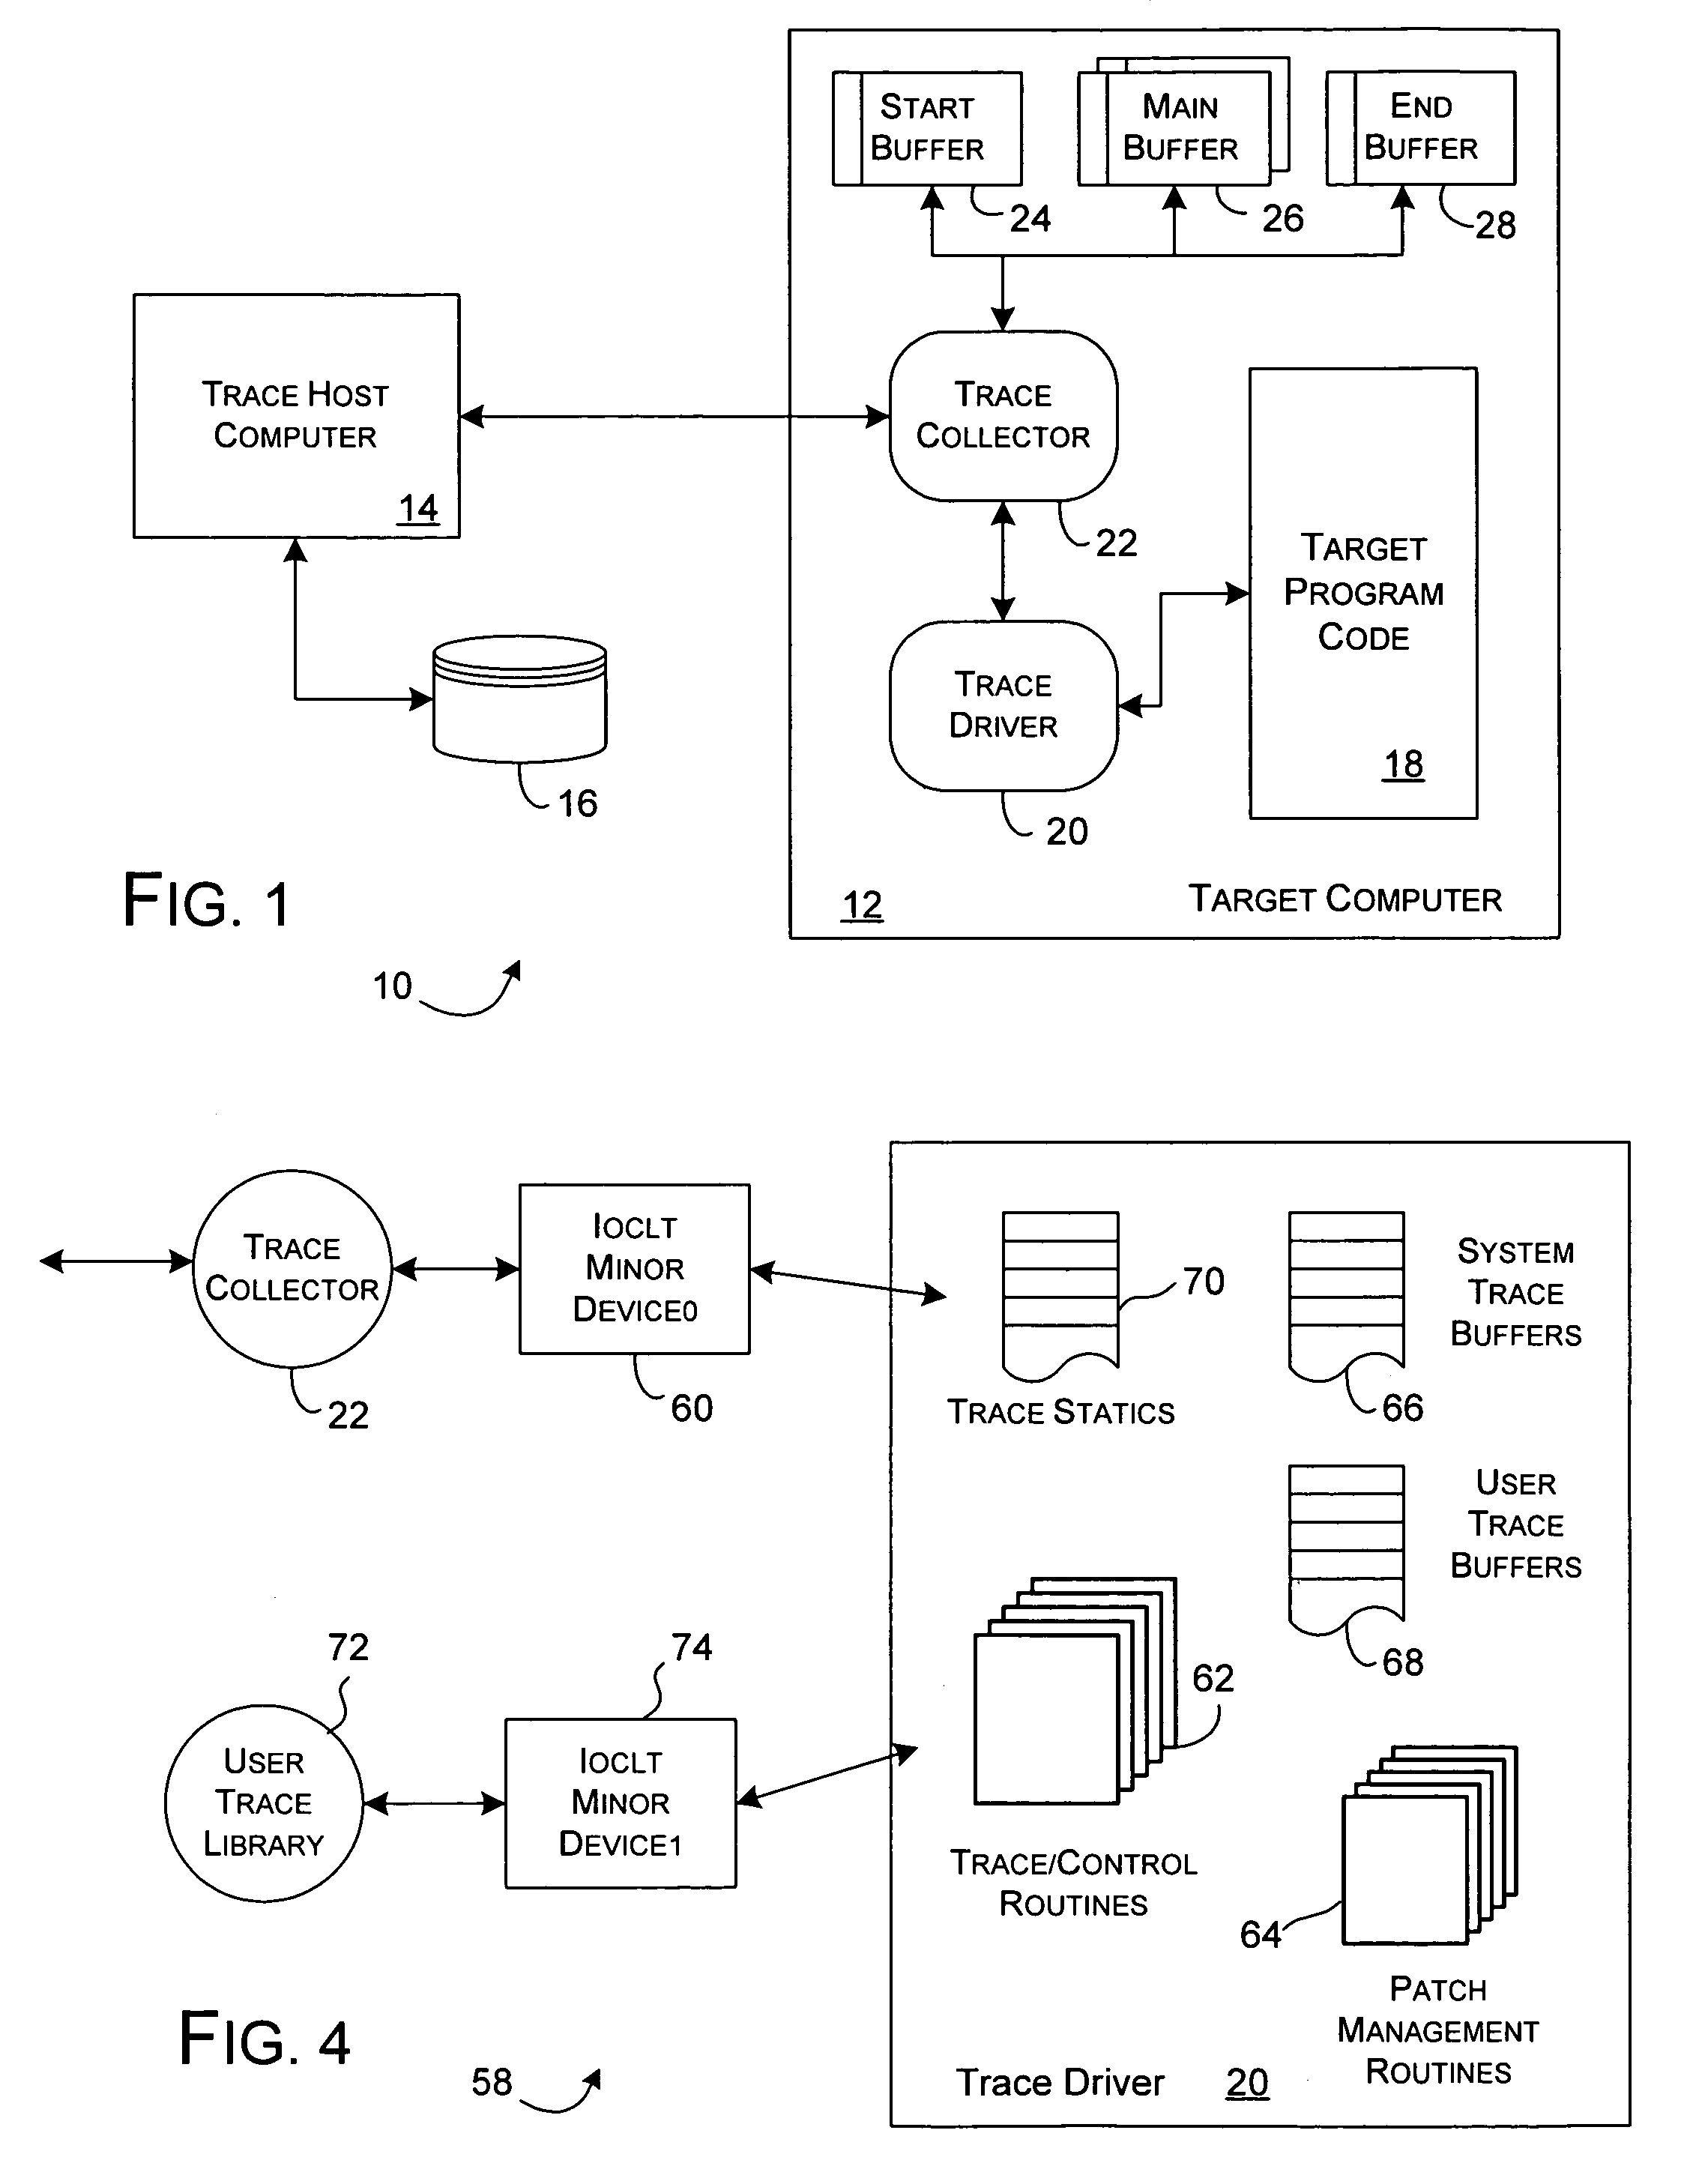
[0029]As generally shown in FIG. 1, the present invention provides a trace environment 10 to capture event data suitable for tracing the executing state of a target program. A target computer 12 is monitored and managed with respect to the collection of trace data by a trace host computer 14, and event trace data received thereby may be stored in a persistent data file 16 for subsequent review and analysis. For a preferred embodiment of the present invention, the target computer 12 can be a general purpose personal computer or an embedded, proprietary process control computer system executing a generic Linux™ or proprietary LynxOS™ operating system and supporting a conventional network interconnection. The trace host computer 14 is preferably a network capable conventional personal computer or workstation supporting Java 2 applications.

[0030]In general, a target program 18 executes on the target computer 12 along with a trace driver 20 that performs the detailed management of trace ...


PUM


Abstract

Program code loaded for execution by a computer can be dynamically instrumented to collect event data by inserting an instruction at a trace point within the program code as loaded in a memory space of a computer, where the trace point corresponds to the beginning of a predefined function of the program selected for event tracing. The instruction provides for the direction of the execution of said computer to a function proxy routine, which includes a call to an instance of the predefined function. Event data is collected in connection with the calling of the instance of the predefined function.

Description

BACKGROUND OF THE INVENTION[0001]1. Field of the Invention[0002]The present invention is generally related to software development tools and environments and, in particular, to an event trace and visualization tool supporting the dynamic instrumentation of target program code and collection of event data with minimal impact on the system behavior of the target program and system.[0003]2. Description of the Related Art[0004]Within software development processes, the specific detection and causal analysis of failure sources in software programs, particularly while executing, is a complex art. Although static analysis of program source code can identify potential problems, the most difficult to analyze failure sources are those that only occur when a target program is being executed in its intended execution environment, and even then only intermittently and unpredictably. Such failure sources most typically occur where the program under analysis must be responsive to real-time events,...

Claims


Application Information

Patent Timeline
IPC IPC(8): G06F9/44G06F11/34G06F11/36
CPCG06F11/3466G06F11/3644G06F11/3636
Inventor BUNNELL, MITCHELL
Owner LYNX SOFTWARE TECH
Why Eureka
Try Eureka