Methods for assessing a condition by analyzing blood in cerebrospinal fluid

a cerebrospinal fluid and analysis method technology, applied in the direction of optical radiation measurement, instruments, spectrometry/spectrophotometry/monochromators, etc., can solve the problems of traumatic tap, no test can reliably identify the source of blood in csf, and clinicians do not possess sufficient diagnostic modalities for assessing, etc., to achieve accurate diagnosis of patients and reliable quantitative results

Inactive Publication Date: 2011-09-27
UNIVERSITY OF CINCINNATI
View PDF1 Cites 8 Cited by
  • Summary
  • Abstract
  • Description
  • Claims
  • Application Information

AI Technical Summary

Benefits of technology

[0011]Accordingly, it is an object of the present invention to provide physicians with a tool to accurately diagnose patients with a suspected SAH and to provide point-of-care technology that will allow completion of the diagnostic paradigm using a point-of-care measurement of bilirubin. The present invention also provides a standardized method for the spectrophotometric examination of CSF which yields reliable quantitative results. The detection of a SAH can be accomplished using the characteristic spectral absorption patterns for blood's breakdown products, with the blood product of interest referred to herein as an analyte.

Problems solved by technology

At present, clinicians do not possess the diagnostic modalities sufficient for assessing patients with a suspected ruptured cerebral aneurysm and a normal computerized tomography (CT) scan.
The difficulty with the performance of a spinal tap is that nearly 1 in 5 of these procedures results in a “traumatic tap”.
At present, no test can reliably identify the source of blood in CSF and differentiate a SAH from a traumatic spinal tap.
The difficulty arises when large numbers of (red blood cells) RBC's are found.
At present, no method of CSF analysis has the ability to fully direct a patient's care.
This subjective and low sensitivity technique cannot determine the amount of blood in the CSF or the degradative processes that have acted on the blood.
Nor can this visual inspection estimate the amount of time the blood has been in the CSF.
The results of visual interpretation of spectra are qualitative in nature and depend strongly on the experience of the technicians; results, therefore, are prone to large inter- and intra-individual variation.
The PLS and the ANN algorithmic models are not always dependable because they are sensitive to the changes in time and the resultant variance in data that varies with the concentration of the solution.
The problem with this work is that the results have been obtained in very diluted samples that are not physiologically achievable and hence have no application to assessment of a condition in an individual by subjecting fluid samples drawn from the individual to those analyses.

Method used


Image

  • Methods for assessing a condition by analyzing blood in cerebrospinal fluid
  • Methods for assessing a condition by analyzing blood in cerebrospinal fluid
  • Methods for assessing a condition by analyzing blood in cerebrospinal fluid

Examples


example 1

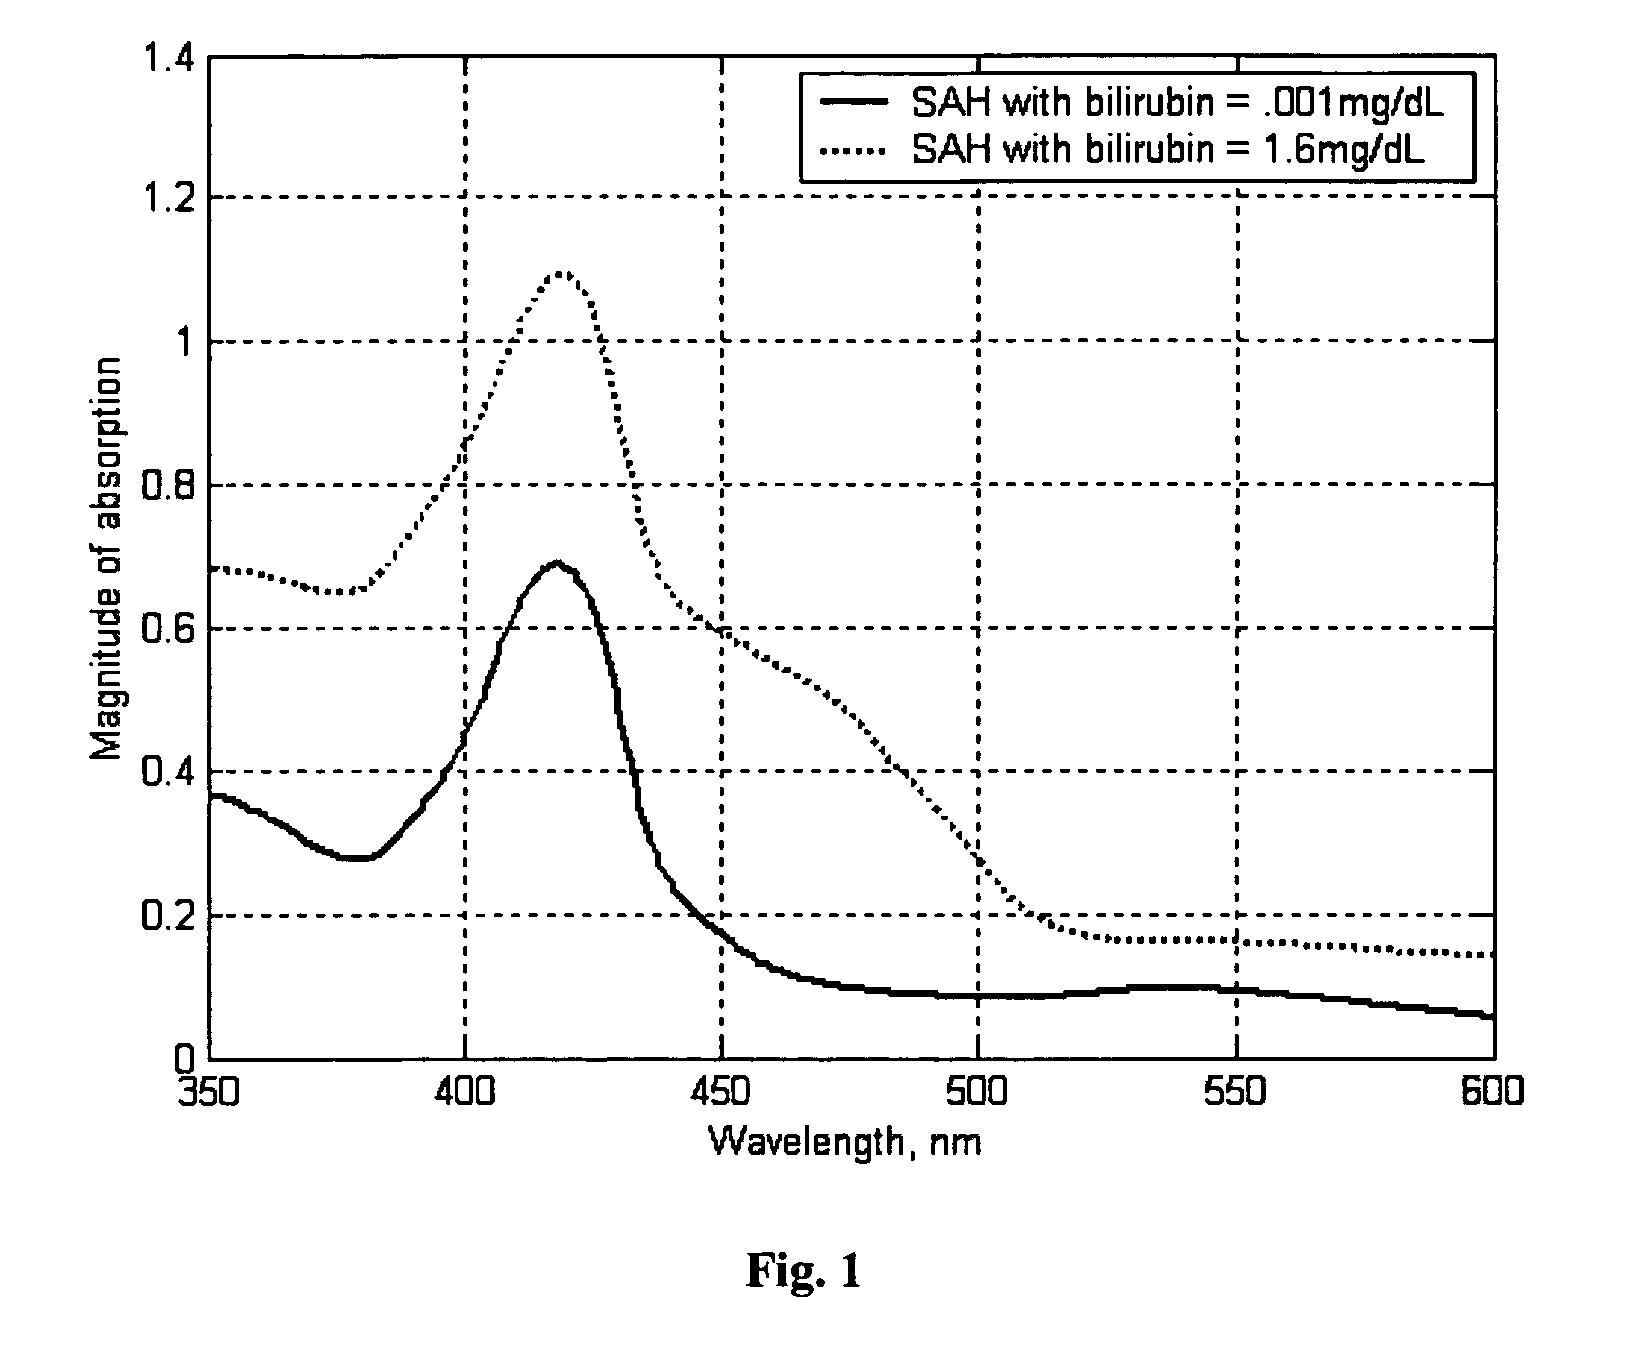
[0086]This example illustrates the use of the inventive methods to perform a differential diagnosis the spectrophotometer output provides the spectral content of the CSF obtained from LP. Generally, due to the rupture of a blood vessel while performing LP, the spectral content would consist of hemoglobin and bilirubin. The hemoglobin consists of two different components: oxyhemoglobin and methemoglobin. However, within a short period of time, the oxy-hemoglobin gets converted into methemoglobin. Therefore, the primary objective is to detect the presence of bilirubin in CSF-SAH. In addition to bilirubin (the concentration of which depends on the extent of aneurysm rupture), CSF-SAH may have methemoglobin and certain other proteins in it. A measured spectral output for SAH was generated and CSF / SAH with two different concentrations of bilirubin were plotted. It was observed that absorption increased over all wavelength ranges for the higher bilirubin concentration but was more pronoun...

example 2

[0088]This example illustrates the calculation of scaling factors in the development of the minimum distance method algorithm employed in some embodiments of the inventive methods.

[0089]The performance of the algorithm depends on the ability to describe the measured SAH spectrum accurately as the linear combination of pre-measured bilirubin and methemoglobin spectra over the wavelengths of significance, i.e., between 390 and 420 nm and 450 to 600 nm. Therefore, over a certain set of wavelengths in the spectral data, we adjust the SAH curve with a scale factor

S(n)=α*SAH(n)≈(B(n)+M(n)) 390≦n≦420  (1)

S(n)=β*SAH(n)≈(B(n)+M(n)) 450≦n≦500  (2)

where, α and β are scaling factors which are computed by minimizing the least squares (LS) error functions

εi(1)=Σ∥(α·SAHi(n)−(Mi(n)+Bi(n))∥2 390≦n≦420  (3)

εi(2)=Σ∥(β·SAHi(n)−(Mi(n)+Bi(n))∥2 450≦n≦500  (4)

such that the scaled SAH curve and the sum curve are nearly equal over the wavelengths indicated.

[0090]A set of solutions is prepared in which methe...

example 3

[0092]This example provides results of estimating bilirubin and methemoglobin in a measured CSF / SAH solution using the minimum distance method.

[0093]First, M (n) and B (n) were estimated in a sample with constant methemoglobin and increasing bilirubin. Spectral curves for 36 different concentrations of methemoglobin and bilirubin were measured in the laboratory, 105 additional curves were interpolated from those as discussed previously. The methemoglobin concentration was held constant at 4.6 g / dL while the bilirubin concentration was increased from 0 mg / dL to 9 mg / dL. The bilirubin concentrations were not uniformly distributed over the entire concentration range. Since the lower and middle levels on the concentration scale are more critical in terms of diagnosis of SAH, the number of concentrations of bilirubin measured in this region is higher. This helps us test the algorithm more rigorously over the critical concentrations of bilirubin.

[0094]The results indicate that the estimat...


PUM


Abstract

The present invention provides methods for assessing a condition in an individual by analyzing a cerebrospinal fluid sample from the individual, for example, by spectroscopy. Further, the invention provides methods for determining an amount of blood in the cerebrospinal fluid sample; methods for determining concentrations of analytes in the cerebrospinal fluid sample; methods for determining a length of time the blood has been in the cerebrospinal fluid sample; and methods for rapidly obtaining a differential diagnosis between conditions indicated by blood in the cerebral spinal fluid. Moreover, the present invention provides instruments capable of rapidly assessing a condition in and individual by point-of-care analysis of a cerebral fluid sample from an individual.

Description

RELATED APPLICATIONS[0001]This application claims priority under 35 U.S.C. §119 of U.S. Provisional Application Ser. No. 60 / 592,502, filed Jul. 30, 2004.GOVERNMENT INTERESTS[0002]This invention was made, at least in part, with funds from the Federal Government, awarded through grants numbered R01 HL67186, R01 NS042308, and R21 NS4697. The U.S. Government therefore has certain acknowledged rights to the invention.FIELD OF THE INVENTION[0003]The present invention is directed toward methods for assessing a condition in an individual by analyzing a cerebrospinal fluid sample from an individual, for example, by spectroscopy. Further, the invention is directed towards methods for determining an amount of blood in the cerebrospinal fluid sample; methods for determining concentrations of analytes in the cerebrospinal fluid sample; and methods for determining a length of time the blood has been in the cerebrospinal fluid sample. Moreover, the present invention provides an instrument capable ...

Claims


Application Information

Patent Timeline
Patent Type & Authority Patents(United States)
IPC IPC(8): G06F17/10
CPCG01N21/31
Inventor BEYETTE, JR., FRED R.CLARK, JOSEPH F.MORGAN, CHAD J.CAFFERY, JR., JAMES J.BHADRI, PRASHANTPYNE-GEITHMAN, GAILMAJUMDER, ANINDYA
Owner UNIVERSITY OF CINCINNATI
Why Eureka
Try Eureka