Real-time mapping of electronic structure with single-shot two-dimensional electronic spectroscopy
a technology of electronic spectroscopy and real-time mapping, applied in the field of optical spectroscopy, can solve the problems of difficult measurement of material dynamics, limited techniques, and high cost, and achieve the effect of reducing acquisition time and eliminating phase errors
- Summary
- Abstract
- Description
- Claims
- Application Information
AI Technical Summary
Benefits of technology
Problems solved by technology
Method used
Image
Examples
example experimental
Setups
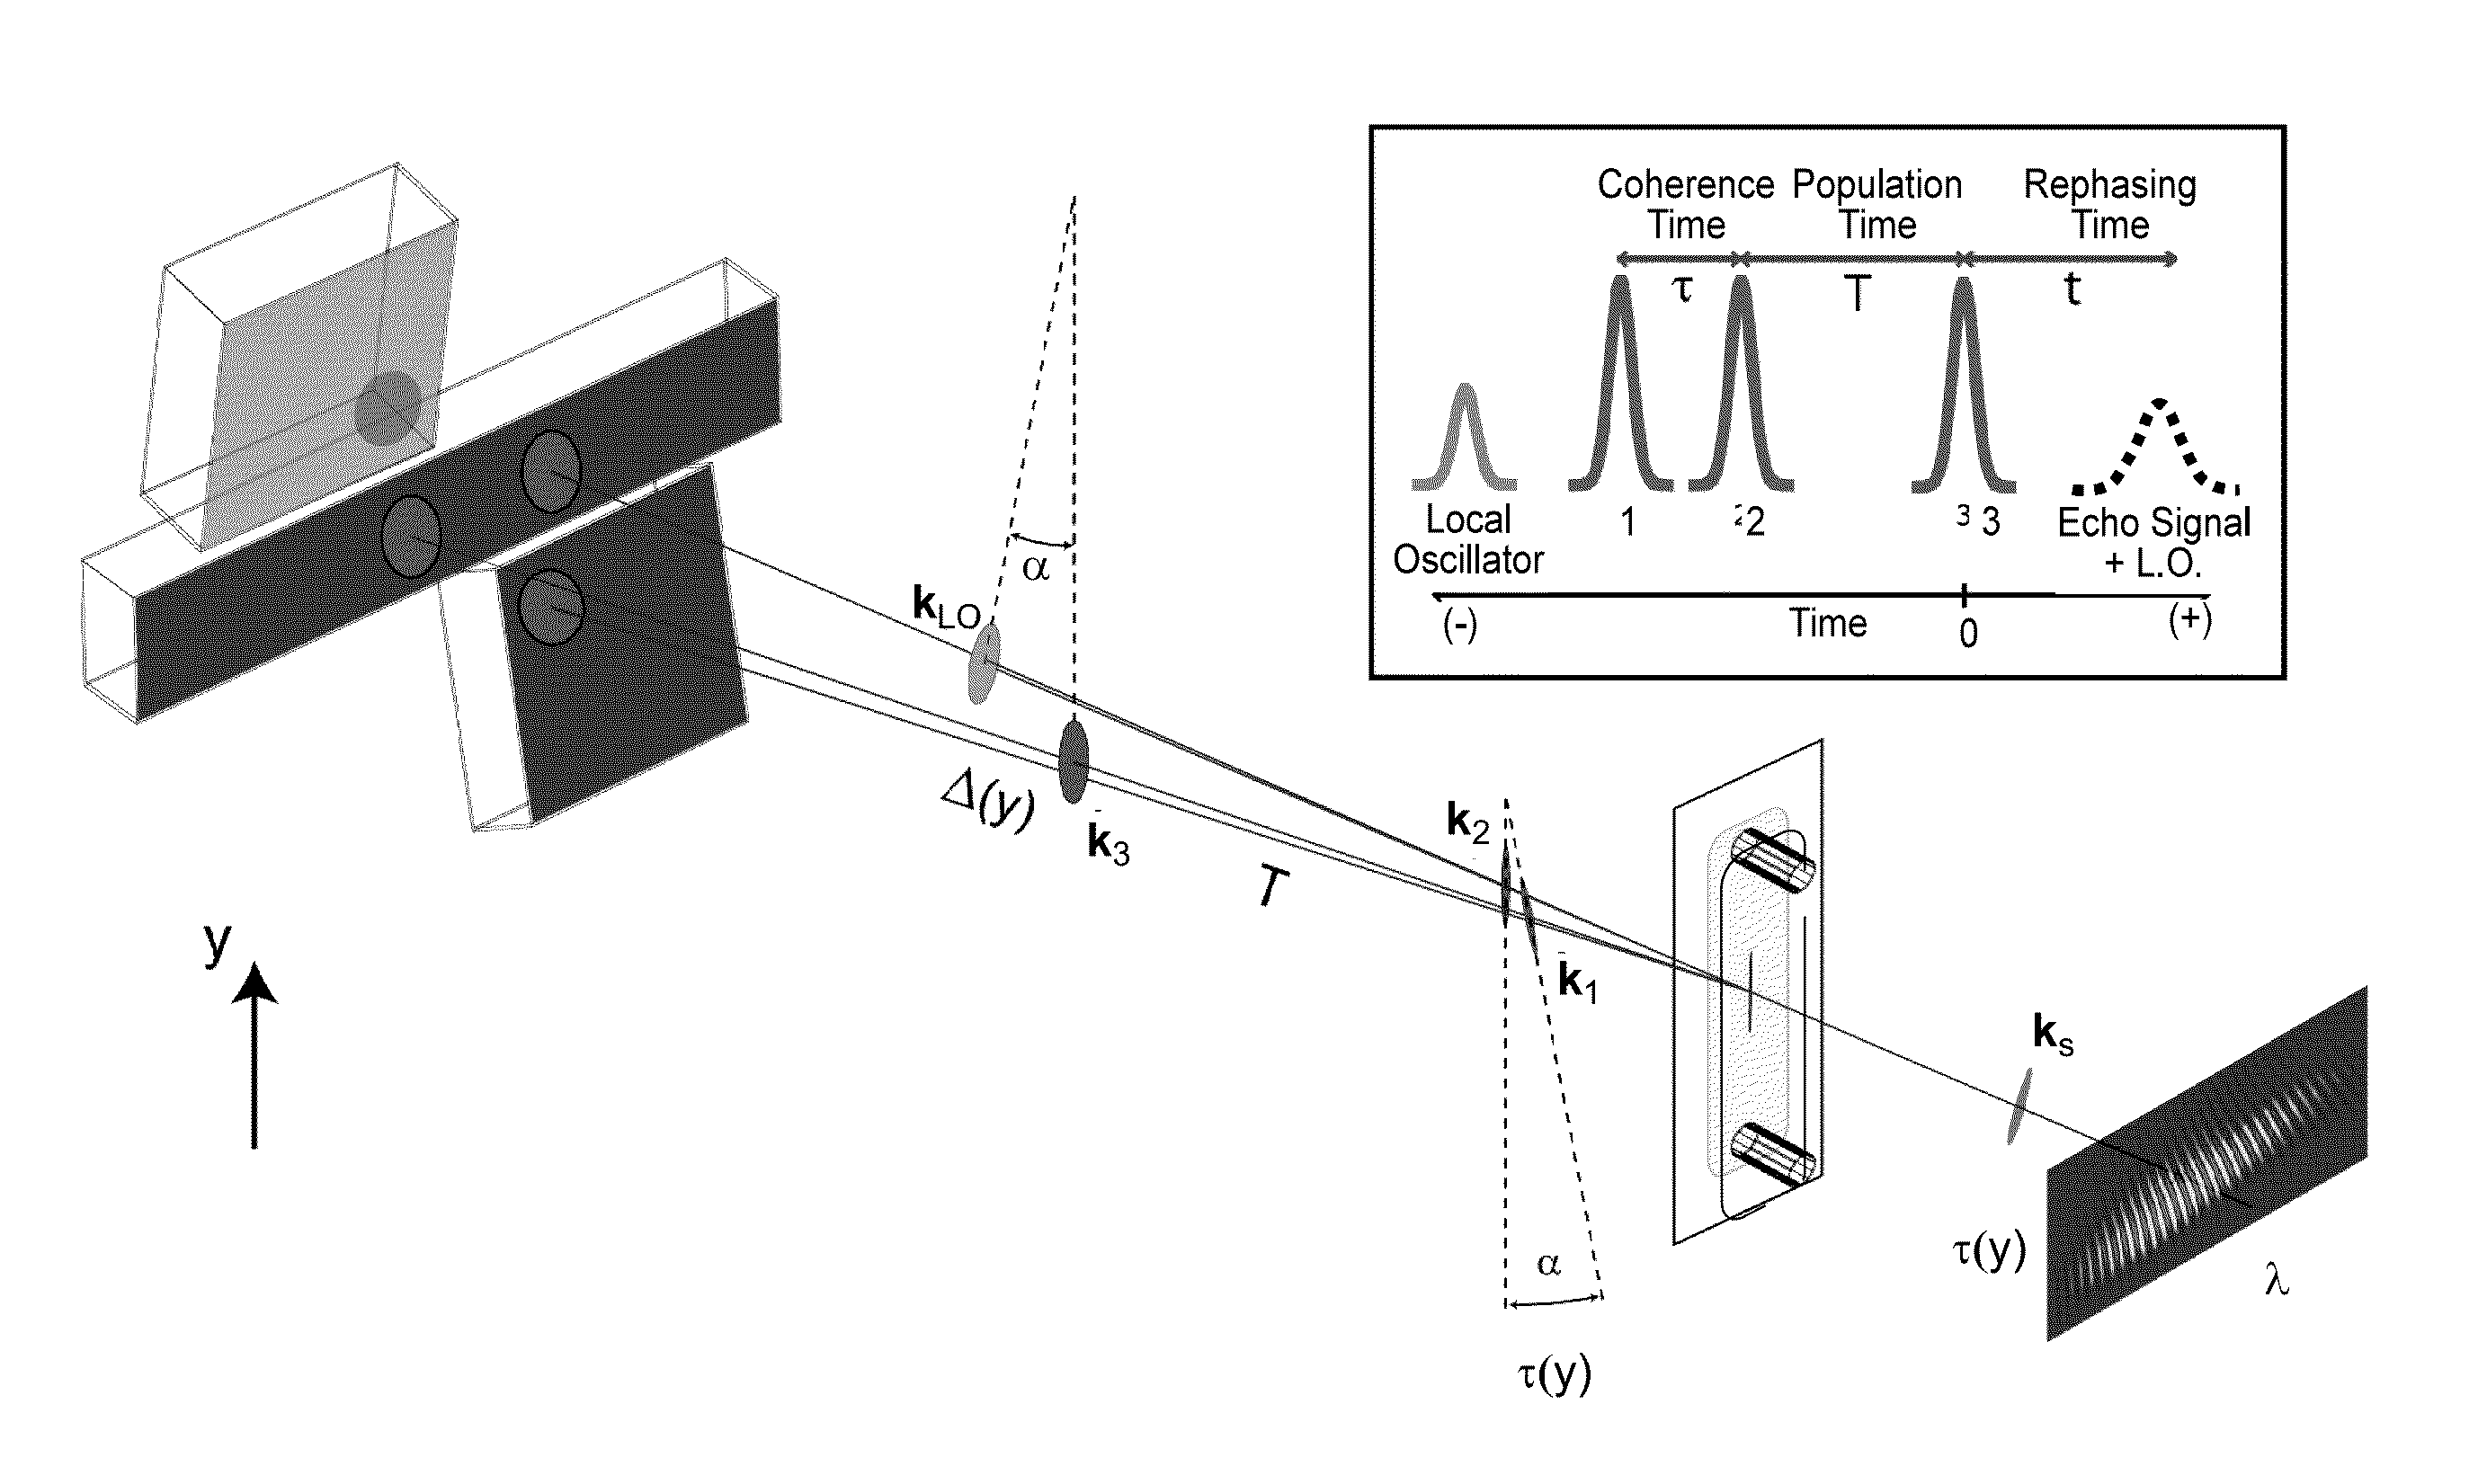
[0096]A schematic of an example optical layout in accordance with the present techniques is shown in FIG. 4. A Ti:sapphire oscillator (Micra, COHERENT Inc.) is used to seed a regenerative amplifier (Legend Elite USP-HE, COHERENT Inc.) to generate 40 fs pulses centered at 807 nm at a 5 kHz repetition rate. The pulse length is measured using single-shot second harmonic frequency-resolved optical gating (Grenouille, Swamp Optics) prior to the sample. A small fraction of the amplifier output pulse (20 μJ) passes through a beam splitter, creating two beams, each with a 1 / e diameter of roughly 6 mm. The relative delay between the beams is controlled by a motorized translation stage (Aerotech Inc.), which defines the population time, T. The beams are then further split into two pulse pairs creating four pulses, labeled here as k1-k4, by the use of front and back Fresnel reflections from a 3 mm thick uncoated 0.5 degree wedged optic (FIG. 4, wedge beam splitter expanded in panel i). T...
example 1
Dissecting Hidden Couplings Using Fifth-Order Three-Dimensional Electronic Spectroscopy
[0115]We report the demonstration of single-quantum three-dimensional electronic spectroscopy. In an example, the GRAPE technique was used in which the fifth-order non-linear polarization of the solvatochromatic dye IR144 corresponding to evolution through three sequential single-quantum coherences was measured. GRAPE, which allowed a two dimensional slice of data to be acquired in parallel, permitted a practical implementation of three-dimensional spectroscopy at optical frequencies in a matter of minutes instead of hours. By spreading frequencies into a third spectral dimension, features in the spectra that would otherwise be obscured could be resolved. For IR144, a previously unresolved cross peak originating from high frequency vibronic modes is observed in the spectrum. Theoretical modeling based on the cumulant expansion truncated at second order reproduces the main features of the experimen...
example 2
Single-Shot Ultrabroadband Two-Dimensional Electronic Spectroscopy of the Light-Harvesting Complex LH2
[0130]Here we present two dimensional electronic spectra of the light harvesting complex LH2 from purple bacteria using coherent pulses with bandwidth of over 100 nm FWHM. This broadband excitation and detection has allowed the simultaneous capture of both the B800 and B850 bands using a single light source. We demonstrate that one laser pulse is sufficient to capture the entire two-dimensional electronic spectrum with high signal-to-noise. At a waiting time of 800 fs we observe population transfer from the B800 to B850 band as manifested by a prominent cross-peak. These results will enable observation of the dynamics of biological systems across both ultrafast (1 ms) timescales simultaneously.
[0131]In some embodiments, the GRAPE techniques acquire the entire 2D spectrum of a compound 2-3 orders of magnitude faster than by ‘conventional’ point-by-point methods without any sacrifice ...
PUM
| Property | Measurement | Unit |
|---|---|---|
| coherence time | aaaaa | aaaaa |
| coherence time | aaaaa | aaaaa |
| time | aaaaa | aaaaa |
Abstract
Description
Claims
Application Information
 - R&D
- Intellectual Property
- Life Sciences
- Materials
- Tech Scout
- Unparalleled Data Quality
- Higher Quality Content
- 60% Fewer Hallucinations
Browse by: Latest US Patents, China's latest patents, Technical Efficacy Thesaurus, Application Domain, Technology Topic, Popular Technical Reports.
© 2025 PatSnap. All rights reserved.Legal|Privacy policy|Modern Slavery Act Transparency Statement|Sitemap|About US| Contact US: help@patsnap.com


