Urine glucose testing method and biosensor used in method
A biosensor and measurement method technology, applied in the field of biological detection, can solve the problems of high cost, inaccurate test, complicated manufacturing process, etc., and achieve the effects of low cost, simple manufacturing process and convenient use.
- Summary
- Abstract
- Description
- Claims
- Application Information
AI Technical Summary
Problems solved by technology
Method used
Image
Examples
Embodiment 1
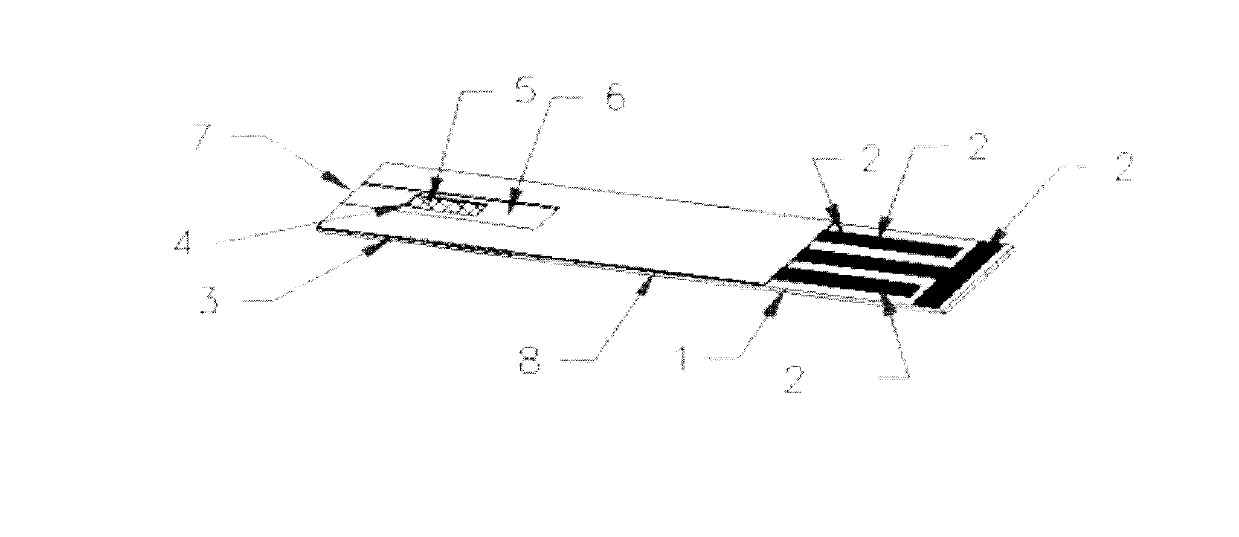
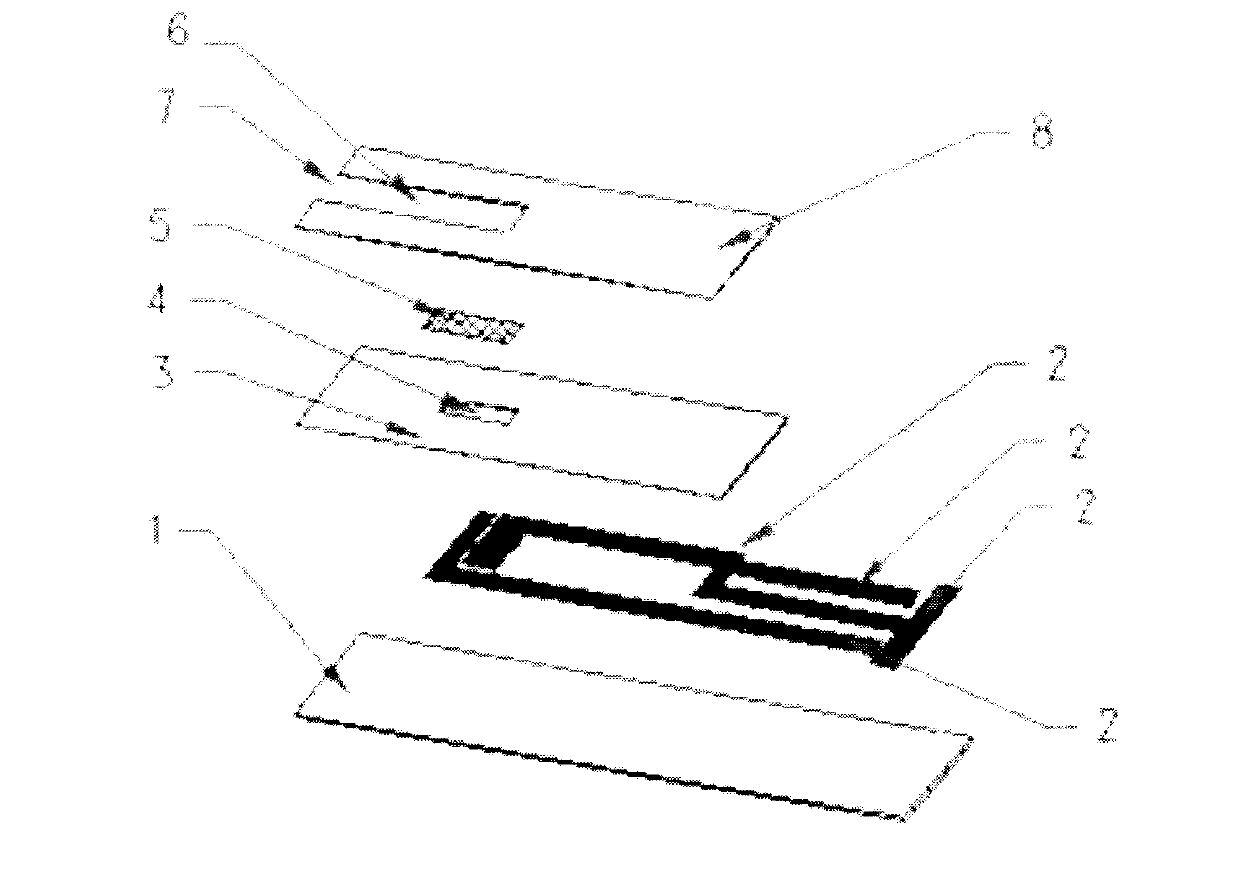
[0058] This embodiment provides a preparation example of an electrode-type urine glucose test paper, thereby illustrating the electrochemical biosensor and the preparation method of the present invention. like Figure 1-8 Shown:
[0059] First of all, the counter electrode 2, the working electrode 3, and the concentration coefficient measuring electrode 4 were fabricated on a 0.25mm thick PET plastic substrate by screen printing technology, and the counter electrode 2, the working electrode 3, and the concentration coefficient measuring electrode 4 were purchased from Acheson Corporation. Carbon ink production. Spread the conductive ink on the PET plastic substrate by screen printing to spread a uniformly dispersed ink thin layer, and put it in an oven at 80°C to dry for 60 minutes.
[0060] Secondly, screen printing technology is used to print insulating varnish on the substrate printed with the electrode system as the electrical insulation isolation layer 5, and the insula...
Embodiment 2
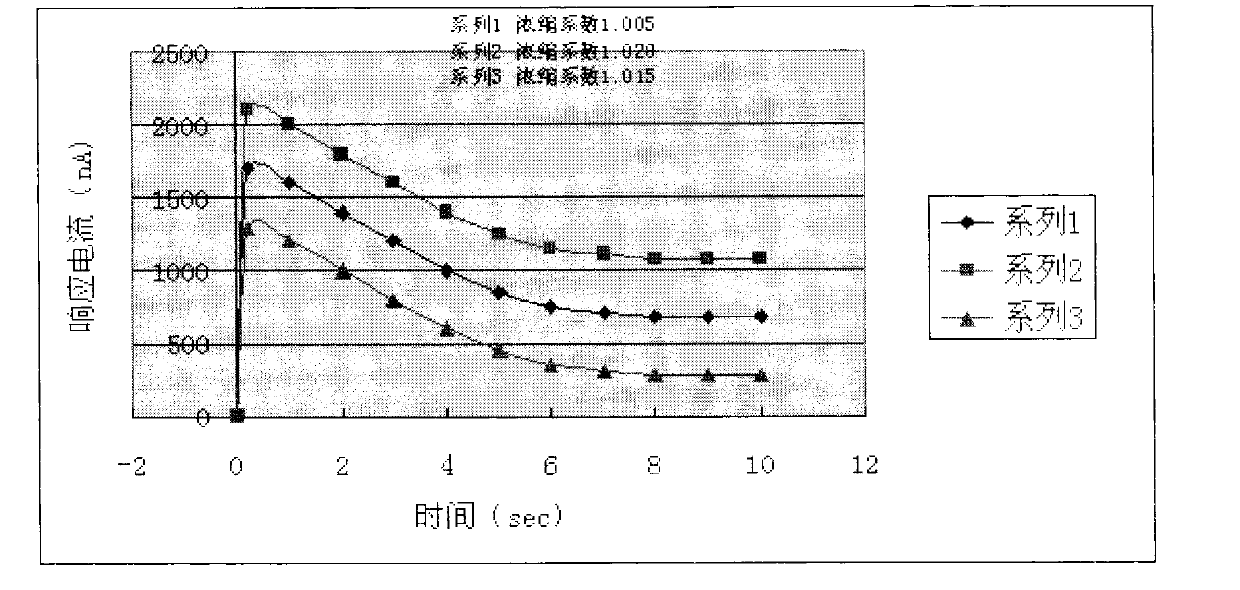
[0077] In this example, the applied voltage was varied in the range of 1 to 5 V, and the response current of the concentration factor measuring electrode was measured. The determination of urine and glucose and the correction of urine sugar concentration are the same as in Example 1. A biosensor used for this measurement was produced in the same manner as in Example 1. The reagent layer 7 is arranged on the counter electrode 1 and the working electrode 2 , but not on the concentration factor measuring electrode 3 . The measurement of the response current value is also the same as in Example 1. The measurement results are shown in the Figure 4-Figure 8 in each figure. Figure 4-Figure 8 A graph showing the time-dependent change of the response current value (nA) with respect to the applied voltage (V).
[0078] like Figure 4 As shown, the response current reflecting the concentration factor can be detected even at an applied voltage of 1V, but if 2 to 5V is applied, as ...
PUM
| Property | Measurement | Unit |
|---|---|---|
| Thickness | aaaaa | aaaaa |
Abstract
Description
Claims
Application Information
 - R&D
- Intellectual Property
- Life Sciences
- Materials
- Tech Scout
- Unparalleled Data Quality
- Higher Quality Content
- 60% Fewer Hallucinations
Browse by: Latest US Patents, China's latest patents, Technical Efficacy Thesaurus, Application Domain, Technology Topic, Popular Technical Reports.
© 2025 PatSnap. All rights reserved.Legal|Privacy policy|Modern Slavery Act Transparency Statement|Sitemap|About US| Contact US: help@patsnap.com


