Visualization system for atmospheric environmental monitoring

An environmental monitoring and atmospheric technology, applied in the field of visualization systems, can solve the problems of fuzzy atmospheric environment quality, no system and method for efficient visualization of online atmospheric environment monitoring data, and no consideration of real-time processing and storage of massive monitoring data.

Inactive Publication Date: 2014-03-26
BEIHANG UNIV
View PDF18 Cites 37 Cited by
  • Summary
  • Abstract
  • Description
  • Claims
  • Application Information

AI Technical Summary

Problems solved by technology

[0007] Chen Donghua's "Microcomputer Processing System for Atmospheric Environment Monitoring Data" discussed the application of microcomputers in the collection of a monitoring station; Li Feng's "Research on Visualization Technology Visualization of Quality Fuzzy Evaluation” discussed environmental assessment; Yuan Guolin’s “Visualization of Air Pollution Diffusion_Application of Geographic Information System” discussed the calculation of isoconcentration points and isoconcentration l...

Method used


Image

  • Visualization system for atmospheric environmental monitoring
  • Visualization system for atmospheric environmental monitoring
  • Visualization system for atmospheric environmental monitoring

Examples


Embodiment Construction

[0020] The present invention will be described in detail below in conjunction with the accompanying drawings and embodiments.

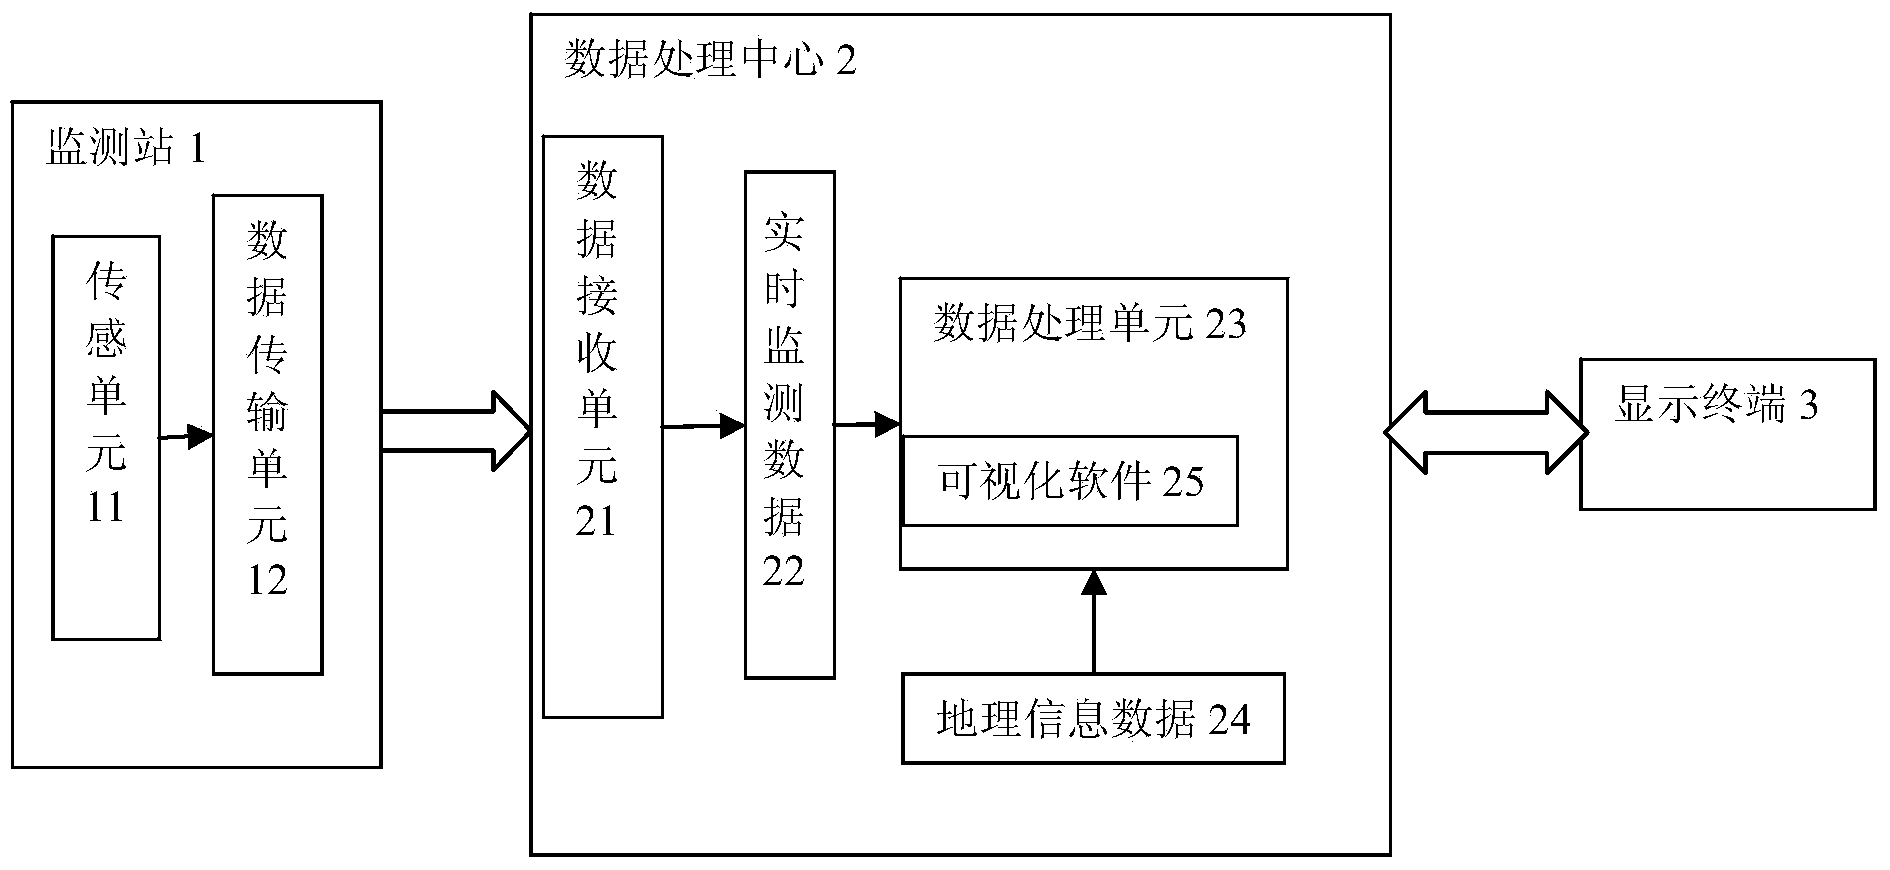
[0021] Such as figure 1 As shown, the present invention includes several monitoring stations 1, a data processing center 2 and several display terminals. The sensing unit 111 is a sensor for monitoring the concentration of various gases, such as a sulfur dioxide sensor, a nitrogen monoxide sensor, a PM2.5 sensor, etc., and one sensing unit may contain multiple sensors at the same time. The sensing unit acquires data representing the gas concentration and sends it to the data transmission unit 12, which is a computer with a network interface or a wireless transmission device with a wireless transmission function.

[0022] The data processing center 2 of the present invention includes a data receiving unit 21 , a data processing unit 22 and visualization software 23 . The data unit receiver 21 receives monitoring data from multiple data transmission u...


PUM


Abstract

The invention relates to a visualization system for atmospheric environmental monitoring. The visualization system for the atmospheric environmental monitoring comprises a plurality of monitoring stations, a data processing center and a plurality of display terminals. Each monitoring station comprises a sensing unit and a data transmission unit. Each sensing unit comprises various gas sensors, suspended particle sensors and the like, collects pollution concentration data, and sends the pollution concentration data to a data processing center through the corresponding data transmission unit in a wired or wireless mode. Visual software is operated in a main node of a data processing unit, reads the real-time monitoring data, the history monitoring data and the geographic information data stored in the data processing unit, calculates geographic grid data and atmospheric pollution concentration grid data, carries out render, draws a three-dimensional terrain and atmospheric pollution concentration distribution diagram, and displays the three-dimensional terrain and atmospheric pollution concentration distribution diagram through the display terminals. The visualization system for the atmospheric environmental monitoring is suitable for visualization broadcast application of atmospheric environment, suitable for providing decision reference for emergency commands in gas leakage accidents, and also suitable for providing atmospheric environmental information reference for daily life anytime and anywhere.

Description

technical field [0001] The invention relates to a visualization system, in particular to a visualization system for atmospheric environment monitoring. Background technique [0002] Atmospheric environment is closely related to human life. On the one hand, gas emissions from production and life affect air quality. With the continuous and in-depth advancement of industrialization and urbanization, various gases and particles produced by thermal power plants, factories, automobiles, etc. are continuously discharged into the atmosphere, such as carbon dioxide, sulfur dioxide, nitrogen dioxide, ammonia, and dust. The composition changes, causing environmental anomalies and even pollution phenomena, such as the greenhouse effect, acid rain, smog, etc. On the other hand, the leakage of harmful gas caused by the accident threatens the safety of life. For example, the Bhopal disaster in India was the worst industrial chemical accident in history. A cyanide leak occurred and cause...

Claims


Application Information

Patent Timeline
IPC IPC(8): G06Q50/26G01N33/00
Inventor 张霖麦金耿陶飞
Owner BEIHANG UNIV
Why Eureka
Try Eureka