Method for accelerating protein precipitation through saccharose
A technology of protein precipitation and protein, which is applied in the field of sucrose-promoted protein precipitation, can solve the problems affecting the detection results, etc., and achieve the effects of high detection sensitivity, short precipitation time and high recovery rate
- Summary
- Abstract
- Description
- Claims
- Application Information
AI Technical Summary
Problems solved by technology
Method used
Image
Examples
Embodiment 1
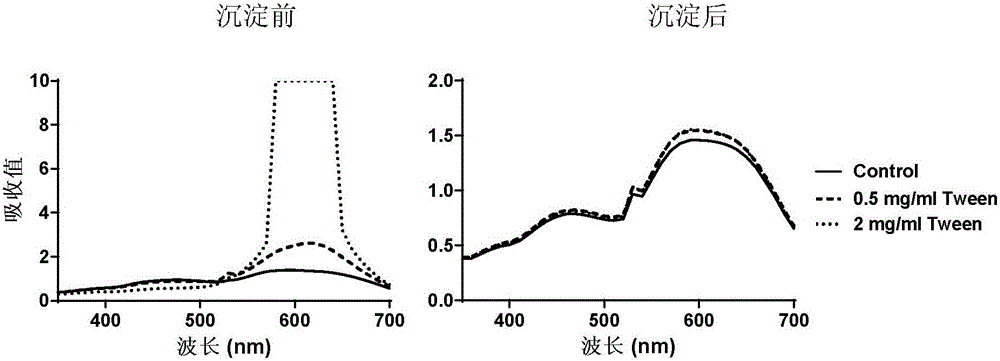
[0054] Embodiment 1 Acetone precipitation removes polysorbate 80 (Tween 80):
[0055] 1) Sample preparation: Add appropriate Tween 80 solution into bovine serum albumin (BSA) solution, so that the final concentration of Tween 80 solution is 0, 0.5, 2 mg / ml, and the final concentration of BSA is 20 μg / ml. Take 0.6ml of each into 2ml EP tubes and pre-cool them.
[0056] 2) Precipitate protein: add 1.4ml pre-cooled acetone to each sample solution, shake well, place in ice bath for 1h, centrifuge at 12000g for 15min to remove supernatant; Place in the bath for 10 minutes, centrifuge at 12000g for 10 minutes to remove the supernatant, and repeat once more. Blow dry naturally to remove acetone residue. Finally, 0.6 ml of water was added to the protein pellet.
[0057] 3) Spectrum scanning: Take 0.6ml of BSA solution containing 0, 0.5, 2mg / ml Tween 80, and each sample after precipitation, add 0.15ml Coomassie Brilliant Blue G250 dye solution (purchased from BioRad Company), mix an...
Embodiment 2
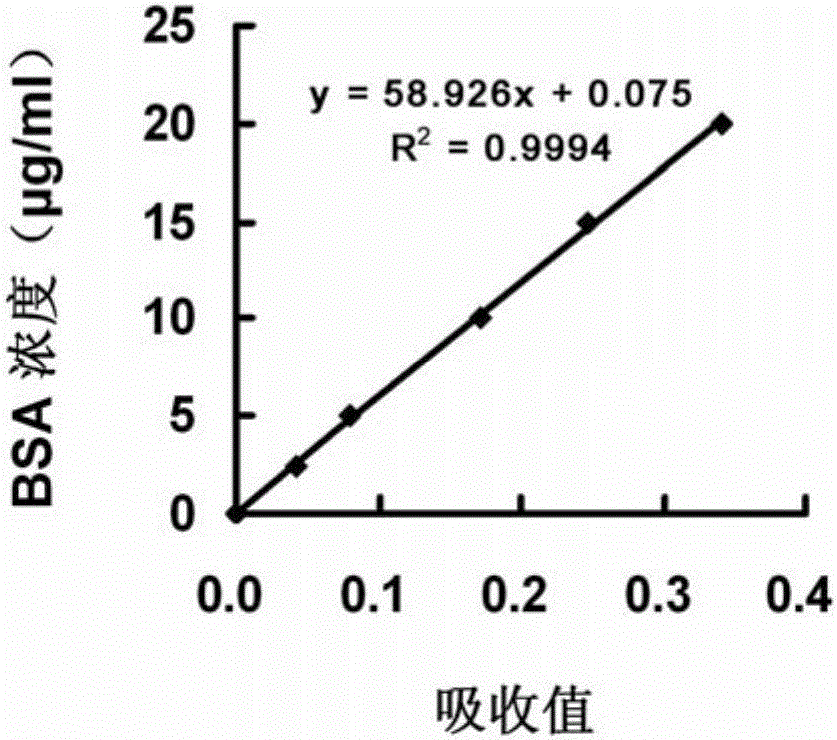
[0059] Example 2 protein standard curve
[0060] 1) Standard product preparation: Prepare BSA standard protein with water to 6 concentrations of 0, 2.5, 5, 10, 15, and 20 μg / ml, and prepare 2 parallel tubes, 0.6 ml in each tube.
[0061] 2) Color development: Add 0.15ml of Coomassie Brilliant Blue G250 dye solution (purchased from BioRad) and mix well, let stand for 10min, mix well, pipette 0.2ml into the microtiter plate, duplicate wells 3 times, measure the OD value at 595nm .
[0062] 3) Linear regression analysis: linear regression analysis was performed with the concentration of BSA as the ordinate and the OD value as the abscissa to obtain the regression equation of the standard curve.
[0063] 4) See the result figure 2 , in the range of 0-20μg / ml, the protein concentration has a linear relationship with the OD value, and the correlation coefficient R 2 >0.99.
Embodiment 3
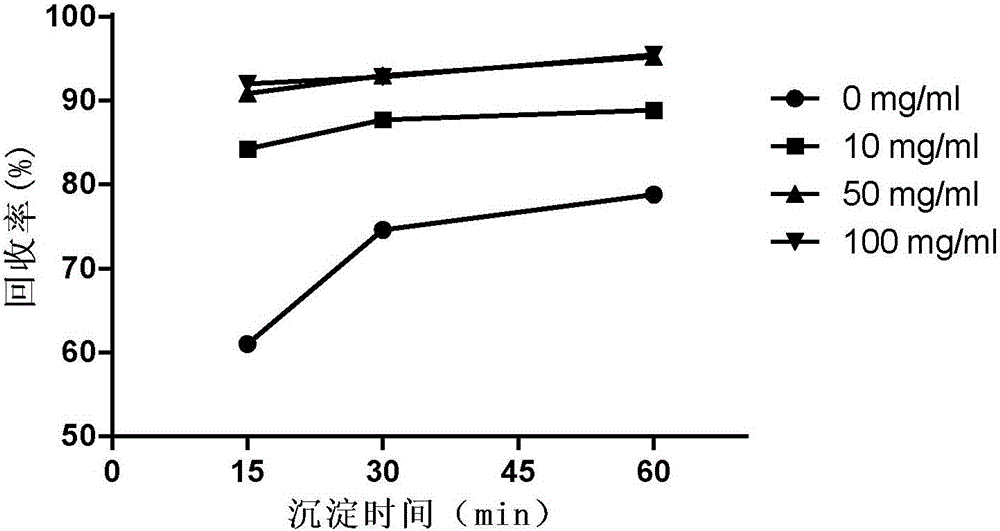
[0064] The impact of the sucrose of embodiment 3 different concentrations on acetone precipitation protein
[0065] 1) Sample preparation: BSA solutions containing 0, 10, 50, and 100 mg / ml sucrose were prepared, the final concentration of BSA was 20 μg / ml, and 0.6 ml of each was put into a 2 ml EP tube.
[0066] 2) Precipitate protein: Add 1.4ml of pre-cooled acetone and shake well, place in ice bath for 15min, 30min, 60min respectively, centrifuge at 12000g for 15min to remove supernatant; add 0.6ml of pre-cooled acetone to each tube, mix well, place in ice bath 10min, centrifuge at 12000g for 10min to remove the supernatant, repeat once. Blow dry naturally to remove acetone residue.
[0067] 3) Protein standard curve: same as Example 2.
[0068] 4) Determination of protein content: add 0.6 ml of aqueous solution to the sample after precipitation, mix well, and add 0.15 ml of Coomassie Brilliant Blue G250 dye solution (purchased from BioRad Company) to each sample. The OD ...
PUM
 Abstract
Description
Claims
Application Information
 - R&D
- Intellectual Property
- Life Sciences
- Materials
- Tech Scout
- Unparalleled Data Quality
- Higher Quality Content
- 60% Fewer Hallucinations
Browse by: Latest US Patents, China's latest patents, Technical Efficacy Thesaurus, Application Domain, Technology Topic, Popular Technical Reports.
© 2025 PatSnap. All rights reserved.Legal|Privacy policy|Modern Slavery Act Transparency Statement|Sitemap|About US| Contact US: help@patsnap.com


