Traceable method for rice origin and application thereof
A technology of origin traceability and rice, which is applied in measuring devices, material analysis through optical means, instruments, etc., can solve the problems of no near-infrared technology to trace the origin of rice, damage the health and interests of consumers, and disrupt the balance of market economy. , to achieve the effect of fast detection speed, easy operation and low detection cost
- Summary
- Abstract
- Description
- Claims
- Application Information
AI Technical Summary
Problems solved by technology
Method used
Image
Examples
Embodiment 1
[0048] Example 1: Collection and pretreatment of samples
[0049] In order to ensure the authenticity and representativeness of the test sample varieties and sampling areas, the test samples were collected directly in the paddy field, and the sampling time was selected after the rice matured and before the farmers harvested the rice. Collect 2kg of rice, and record the sampling location, variety and other information. Sampling sites were selected from five main rice producing areas in Heilongjiang in 2012, including Qiqihar City, Shuangyashan City, Mudanjiang City, Wuchang City, and Jiamusi City, and their main producing counties, main producing townships (towns or farms), and main producing villages (tun) were selected respectively Large-scale planting plots, the main varieties selected from 5 main production areas. All test varieties are japonica rice, a total of 118 test samples, the specific situation of sample collection see Table 1 .
[0050] Table 1 Sample Inform...
Embodiment 2
[0053] Embodiment 2 near-infrared spectrum picture spectrum acquisition
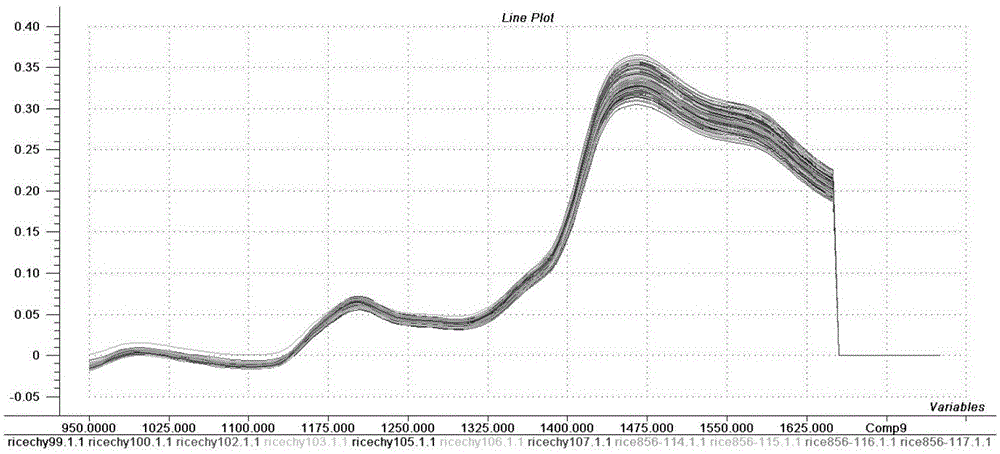
[0054] In this embodiment, the DA 7200 fixed grating continuous spectrum near-infrared analyzer of Swedish Perten Instruments Co., Ltd. is used to perform spectral scanning on the collected rice samples, and the SimPlicity spectral acquisition software that comes with the instrument is selected to collect the near-infrared spectral information of the rice samples. Infrared spectrometer test conditions see Table 2 . The software used for sample modeling and analysis selects the Unscrambler 9.7 spectral analysis software equipped with the analyzer.
[0055] Table 2 Near-infrared spectrometer test conditions
[0056]
[0057] Connect the near-infrared analyzer to the power, turn on the switch, preheat for 30 minutes, pour the sample into the sample box naturally and add in excess, then scrape the mouth of the sample box with a steel ruler to make the sample evenly distributed in the cup to ensure...
Embodiment 3
[0065] Embodiment 3 is based on the establishment of Fisher discriminant method mathematical model
[0066] 1. Sample distribution, NIR spectroscopy picture collection and preprocessing
[0067] In this embodiment, a total of 118 samples were selected from 5 regions in Qiqihar City, Shuangyashan City, Mudanjiang City, Wuchang City, and Jiamusi City in Heilongjiang in 2012 for Fisher discrimination. legal property The establishment of the ground discriminant model. Select 2 / 3 of the total sample size as the modeling sample for building the model, and 1 / 3 of the sample as the forecasting sample set for the validation of the model. The number of samples used for modeling and forecasting in various places can be seen table 5 .
[0068] table 5 Mathematical model modeling and forecasting sample table based on Fisher's discriminant method
[0069]
[0070] The present embodiment near-infrared spectrum picture The acquisition of image is the same as the method in embo...
PUM
 Abstract
Description
Claims
Application Information
 - R&D
- Intellectual Property
- Life Sciences
- Materials
- Tech Scout
- Unparalleled Data Quality
- Higher Quality Content
- 60% Fewer Hallucinations
Browse by: Latest US Patents, China's latest patents, Technical Efficacy Thesaurus, Application Domain, Technology Topic, Popular Technical Reports.
© 2025 PatSnap. All rights reserved.Legal|Privacy policy|Modern Slavery Act Transparency Statement|Sitemap|About US| Contact US: help@patsnap.com


