

Computing method of blood flow volume and blood flow velocity of blood vessel per unit time
A unit time, blood flow velocity technology, applied in the medical field, can solve the problems that patients are unbearable, the calculation accuracy is affected by human factors, and cannot be guaranteed, so as to avoid calculation errors
- Summary
- Abstract
- Description
- Claims
- Application Information
AI Technical Summary
Problems solved by technology
Method used
Image

Examples
Embodiment 1
[0049] The present invention provides a method for calculating the blood flow rate and blood flow velocity per unit time of a blood vessel, which specifically includes the following steps: first, determine the region of interest in the blood vessel (preferably, by accepting X-ray angiography of the blood vessel, select the area of interest in the angiography region of interest); secondly, calculate and fit the grayscale fitting curve in the region of interest; secondly, obtain the maximum grayscale value curve within the predetermined time interval; secondly, calculate the maximum grayscale value within the predetermined time interval The area value S of the area surrounded by the curve and the grayscale fitting curve; again, based on the area area value S, the blood flow Q per unit time corresponding to the area value is obtained; finally, combined with the vascular lumen area, the blood flow rate of the blood vessel is obtained. Blood flow velocity V.
[0050] Preferably, ...
Embodiment 2
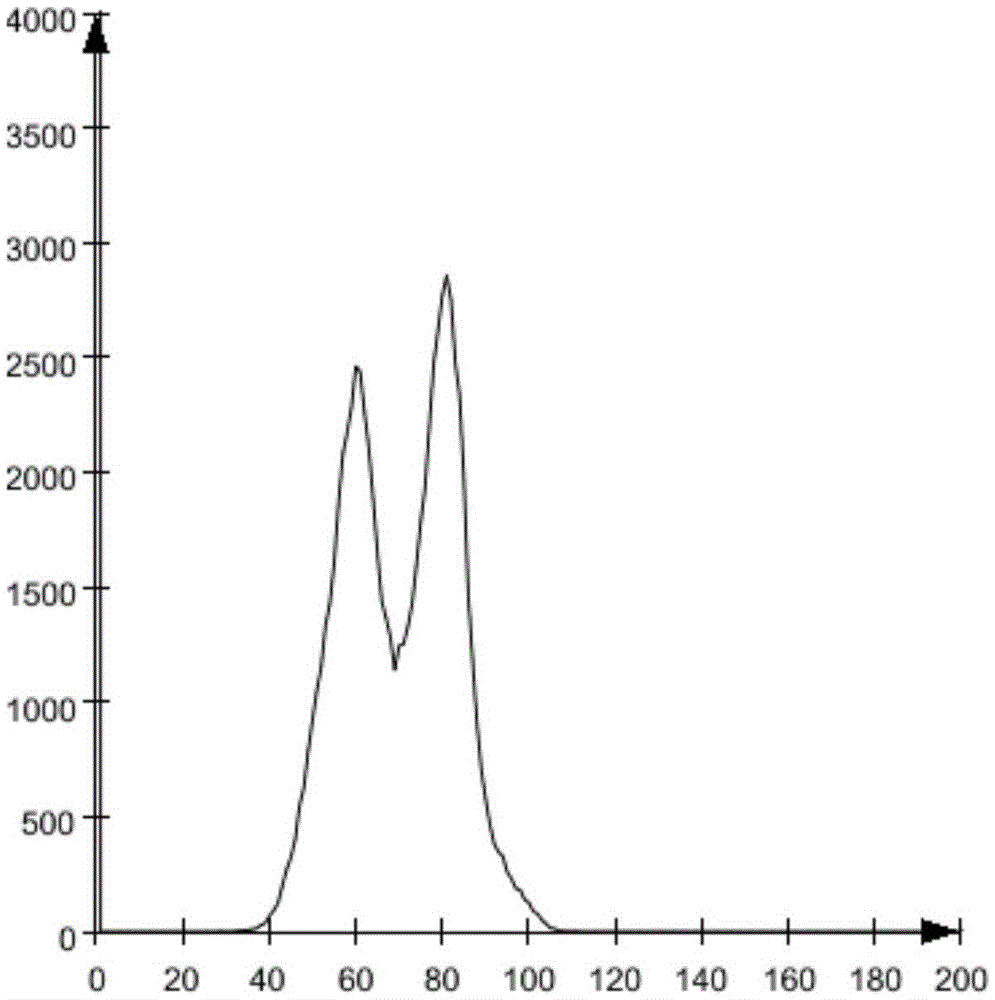
[0060] see figure 1 , Coronary angiography utilizes the different degrees of absorption of rays by human soft tissues and contrast agents to form different high contrasts between blood vessels and surrounding tissues on angiography images. The color depth of each pixel in the contrast image is represented by a gray value, and the larger the gray value, the brighter the pixel. The grayscale histogram is the simplest and most useful tool in digital images. It represents the number of pixels with a certain grayscale in the image. The abscissa is the grayscale value, and the value range is preferably 0-255. The ordinate Indicates the number of occurrences of the gray value in the image, the value range is preferably 0-N, and N is the number of image pixels.
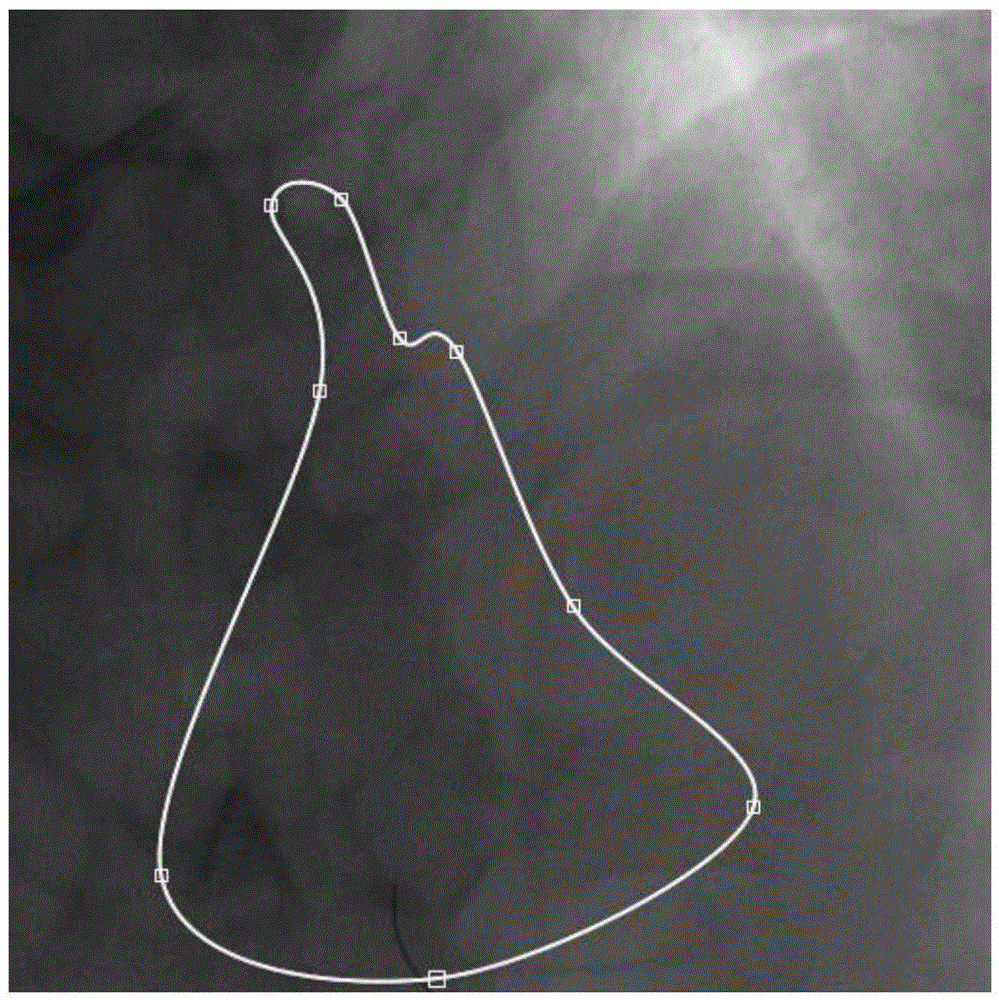
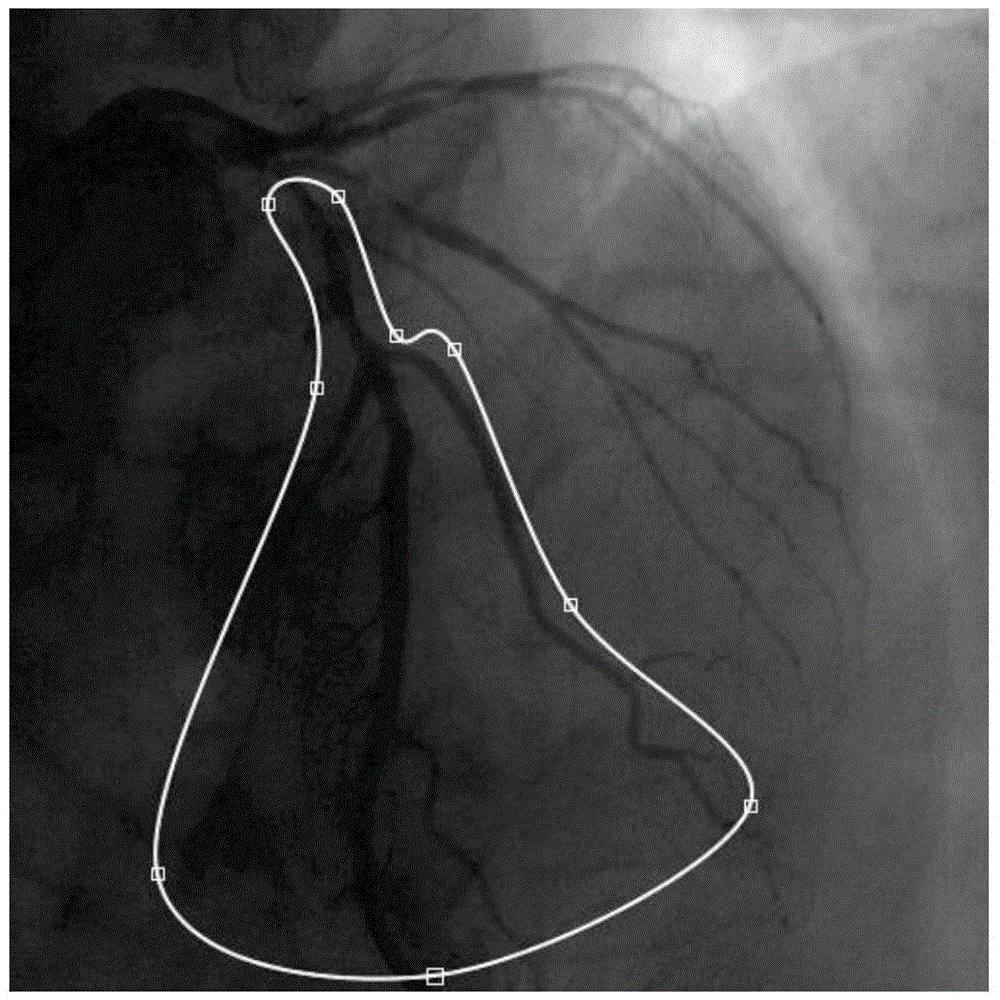
[0061] As shown in Fig. 2, we select blood vessels containing stenosis as the region of interest, and the region of interest includes the main branch blood vessel injected with contrast agent and its branches. Before the in...
Embodiment 3
[0068] It should be pointed out that the X-ray angiography used in the embodiments of the present invention can be coronary angiography, peripheral arteriography such as renal angiography, carotid angiography, etc., or angiography before and after tumor treatment. The blood flow per unit time or blood flow velocity obtained based on the above-mentioned different imaging methods can be used as key parameter indexes in the analysis of different disease conditions, and obtain better accuracy and precision than the parameter indexes in the prior art. For example, the calculation of blood flow velocity based on cardiac coronary angiography can be used to evaluate the influence of vascular stenosis on blood flow velocity, and subsequently calculate the pressure difference or fractional flow reserve (FFR) value of the stenotic vessel; In terms of sympathetic nerve ablation, it is used to evaluate the change of renal artery blood flow per unit time before and after sympathetic nerve ab...
PUM
 Abstract
Description
Claims
Application Information