Compound with anti-Candida albicans activity, preparation method and application thereof
A technology of Candida albicans and compounds, applied in the field of compounds with anti-Candida albicans activity and its preparation, can solve the problems of application limitation, high price, high toxicity and side effects, etc., and achieve the effect of extensive development and application prospects
- Summary
- Abstract
- Description
- Claims
- Application Information
AI Technical Summary
Problems solved by technology
Method used
Image
Examples
Embodiment 1
[0044] Example 1 , Preparation of compounds
[0045] 1.1. Fermentation
[0046] Streptomyces lavenduligriseus CGMCC No.10249 was inoculated in the seed medium, and cultured on a shaking table at 28°C and 220r / min for 2 days, and then the cultured seeds were inoculated at an inoculation amount of 8%. In the fermentation medium in the 5L fermenter, cultivate at 26-28°C for 5-7 days.
[0047] 1.2. Separation and purification
[0048] The fermentation product obtained in Example 1.1 was extracted with methanol, and the extract was obtained by distillation under reduced pressure. Extract the obtained extract with n-butanol, and distill under reduced pressure to obtain the extract. The obtained extract was separated by silica gel column chromatography with a 200-300 mesh silica gel column, and gradient elution was carried out using chloroform and methanol as the elution solvent, wherein the percentages of methanol were 0%, 10%, 20%, respectively. 30%, 40%, 50% and 100%, respec...
Embodiment 2
[0049] Embodiment 2, the structural identification of compound 1
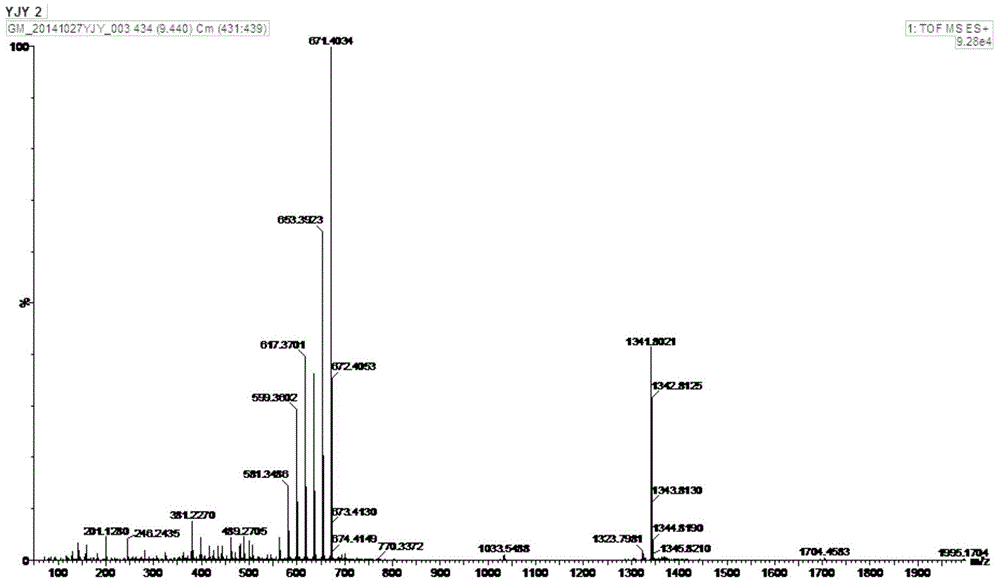
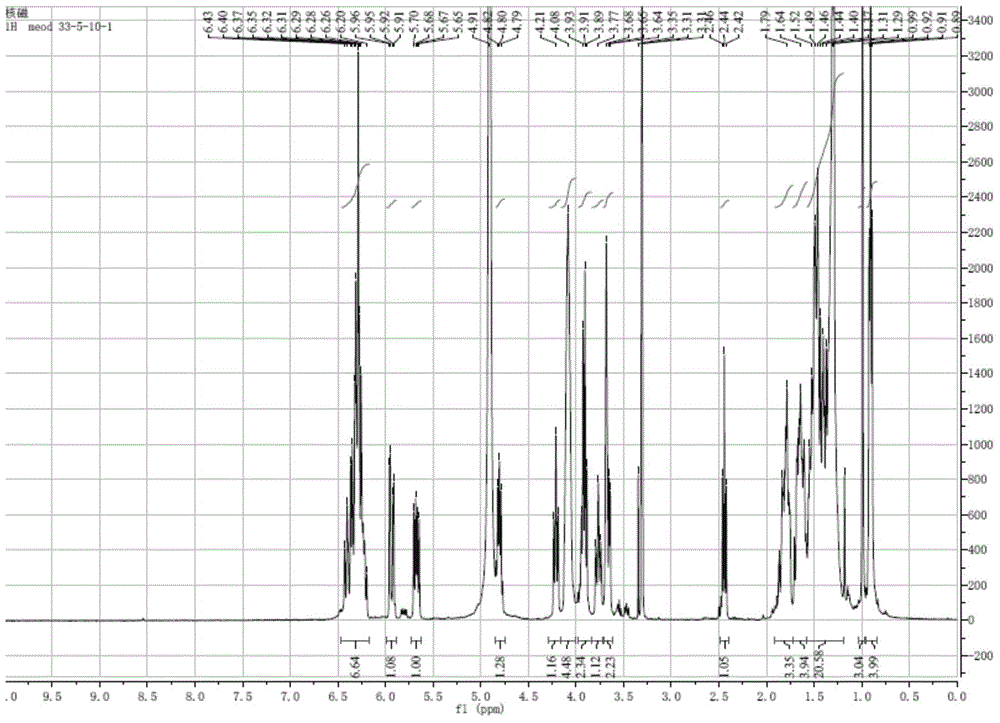
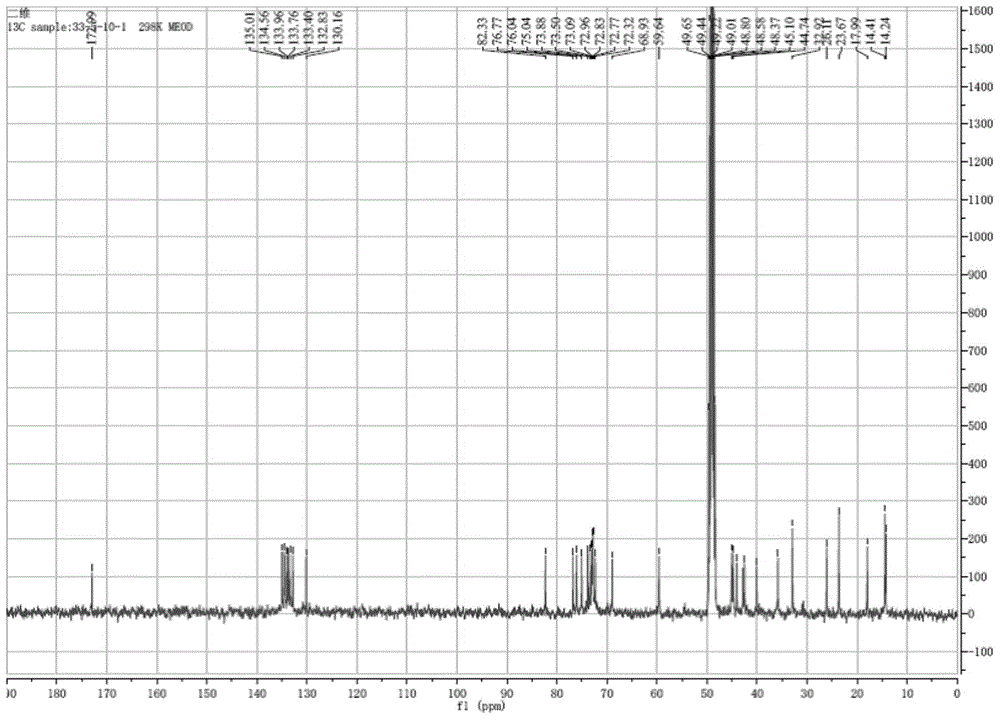
[0050] Compound 1 obtained in Example 1.2 is detected by positive ion electrospray mass spectrometry, and its spectrum is as follows figure 1 As shown, the quasi-molecular ion peak is shown as: m / z 671.4010[M+H] + , the molecular formula is C35 h 58 o 12 , adopt Bruker Avance II-400 type superconducting nuclear magnetic resonance instrument to measure the hydrogen spectrum of sample ( figure 2 ), carbon spectrum ( image 3 ) and related two-dimensional spectra (HMQC spectrum, H-H COZY spectrum, HMBC spectrum, Figure 4~6 ), and its NMR data are shown in Table 1.
[0051] Table 1, the NMR data table of compound 1 (CD 3 OD , , 400MHz)
[0052] position
δ H
δ C
HMBC
1
173.0
2
2.44,t(11.9)
59.6
2’,4
3
4.23,t(13.1)
72.7
2,4
4a
1.46-1.50,m
42.5
4b
1.37-1.40,m
5
4.06-4.10,m
72.3
6
...
Embodiment 3
[0057] Embodiment 3, the structural identification of compound 2
[0058] Compound 2 obtained in Example 1.2 is detected by positive ion electrospray mass spectrometry, and its collection of spectra is as follows: Figure 7 As shown, the quasi-molecular ion peak is shown as: m / z 751.4241[M+Na] + , the molecular formula is C 38 h 64 o 13 , adopt Bruker Avance II-400 type superconducting nuclear magnetic resonance instrument to measure the hydrogen spectrum of sample ( Figure 8 ), carbon spectrum ( Figure 9 ) and related two-dimensional spectra (HMQC spectrum, H-H COZY spectrum, HMBC spectrum, Figure 10-12 ), and its NMR data are shown in Table 2.
[0059] The NMR data table of table 2, compound 2 (CD 3 OD , , 400MHz)
[0060] position
δ H
δ C
HMBC
1
173.0
2
2.73
60.4
2’,4
3
4.36
73.2
2,4
4
1.68
41.3
5
4.18
73.9
6a
1.73
45.3
6b
1.80
...
PUM
 Abstract
Description
Claims
Application Information
 - R&D
- Intellectual Property
- Life Sciences
- Materials
- Tech Scout
- Unparalleled Data Quality
- Higher Quality Content
- 60% Fewer Hallucinations
Browse by: Latest US Patents, China's latest patents, Technical Efficacy Thesaurus, Application Domain, Technology Topic, Popular Technical Reports.
© 2025 PatSnap. All rights reserved.Legal|Privacy policy|Modern Slavery Act Transparency Statement|Sitemap|About US| Contact US: help@patsnap.com


