Preparation and application of immunochromatography method and test paper for quantitative detection of prealbumin
A technology for quantitative detection of prealbumin, applied in measurement devices, analytical materials, instruments, etc., can solve the problems of time-consuming, unsuitable for rapid detection, poor precision and accuracy, etc.
- Summary
- Abstract
- Description
- Claims
- Application Information
AI Technical Summary
Problems solved by technology
Method used
Image
Examples
Embodiment 1
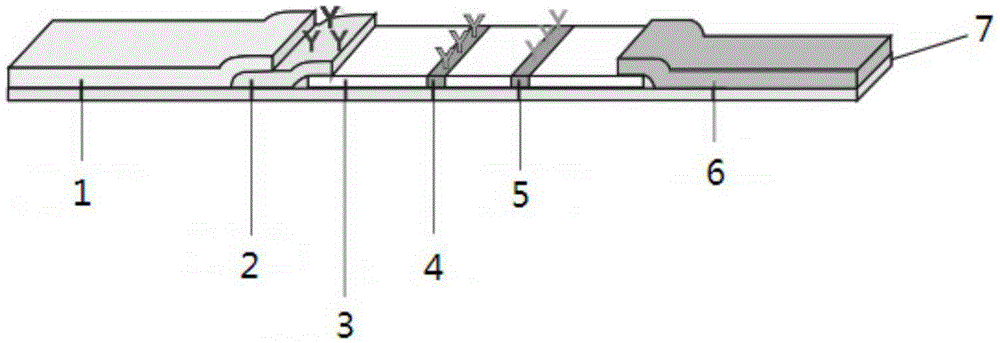
[0063] Example 1 Preparation of prealbumin fluorescent microsphere immunochromatographic test strips in quantitative detection samples
[0064] In this example, the bottom plate material is PVC plastic sheet, which is purchased from Yuyao Fucheng Plastic Chemical Co., Ltd.; the material of the sample pad is glass fiber film, which is purchased from Shanghai Jinbiao Biotechnology Co., Ltd.; the material of the bonding pad is glass The fiber membrane was purchased from Shanghai Jinbiao Biotechnology Co., Ltd.
[0065] 1. Preparation of nitrocellulose membrane
[0066] ① Screen suitable anti-prealbumin antibody and donkey anti-mouse antibody;
[0067] ②Preparation of detection line and quality control line on nitrocellulose membrane;
[0068] Use 0.01M PB buffer (with 3% sucrose) at pH 7.2 to 7.4 to adjust the concentration of anti-prealbumin antibody II to 0.6 mg / mL, and the concentration of donkey anti-mouse antibody to 1.0 mg / mL, using Bio-Dot XYZ3050 The three-dimensional ...
Embodiment 2
[0077] Quantitative detection of prealbumin in the sample of embodiment 2
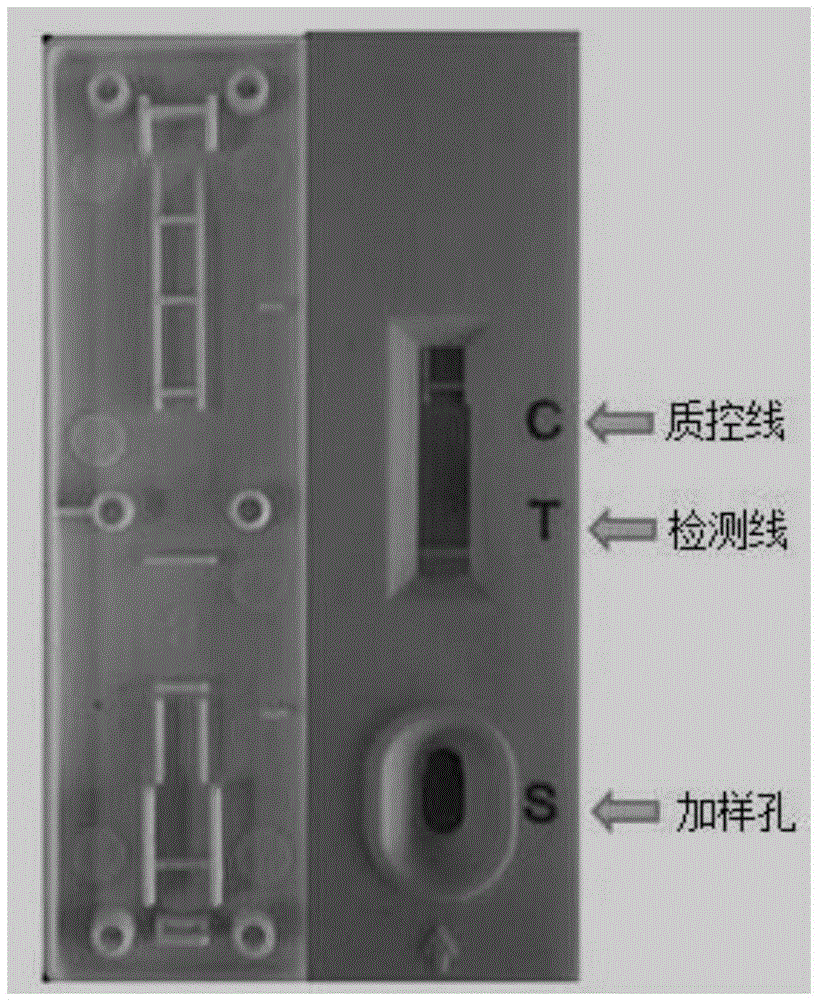
[0078] The test strip prepared in Example 1 is used to detect prealbumin in the sample, and the steps include:
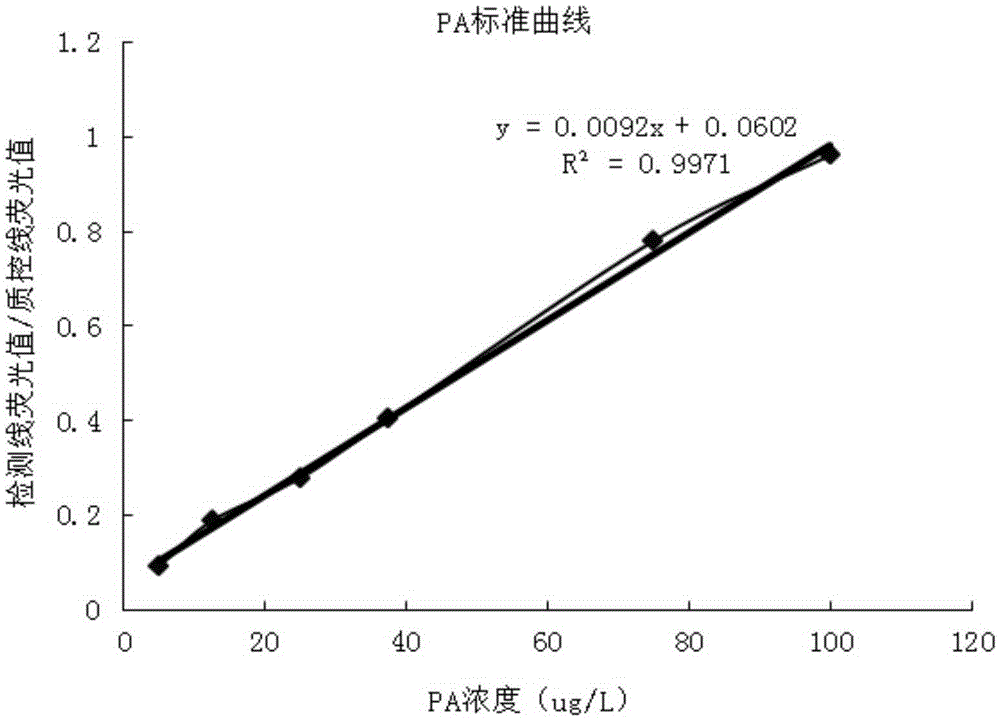
[0079] (1) Add solutions containing prealbumin standards with different known concentrations (0, 2.5, 5.0, 12.5, 25.0, 37.5, 75.0, 100, 200ug / L) into the sample hole of the test strip, After reacting for 15 minutes, place the test strip under the excitation light source with a wavelength of 470nm, measure the fluorescence intensity of the strips on the detection line and the quality control line, and take the ratio of the fluorescence intensity of the strips on the detection line and the quality control line as the ordinate, the former The concentration of albumin is drawn as the standard curve on the abscissa (such as image 3 shown). The results show that the present invention has a good linear correlation (R 2 =0.998), and its detection sensitivity was 2.5 μg / L.
[0080] (2) Add the a...
Embodiment 3
[0081] Quantitative detection of prealbumin in the sample of embodiment 3
[0082] Take the test strip prepared in Example 1, open the aluminum foil bag, take out the test strip, lay it flat on the table, take 10 μL of blood sample into the reagent bottle filled with 2mL 0.01M pH 7.4 phosphate buffer solution, mix thoroughly and take 100 μL Add it into the sample hole of the test strip, react for 15 minutes, place the test strip under the excitation light source, measure the fluorescence intensity of the strips on the detection line and the quality control line, and compare the fluorescence intensity of the detection line with the fluorescence intensity of the quality control line. The ratio of the standard curve in Example 2 can be obtained to detect the content of prealbumin in the blood sample.
PUM
| Property | Measurement | Unit |
|---|---|---|
| diameter | aaaaa | aaaaa |
| wavelength | aaaaa | aaaaa |
| Sensitivity | aaaaa | aaaaa |
Abstract
Description
Claims
Application Information
 - R&D
- Intellectual Property
- Life Sciences
- Materials
- Tech Scout
- Unparalleled Data Quality
- Higher Quality Content
- 60% Fewer Hallucinations
Browse by: Latest US Patents, China's latest patents, Technical Efficacy Thesaurus, Application Domain, Technology Topic, Popular Technical Reports.
© 2025 PatSnap. All rights reserved.Legal|Privacy policy|Modern Slavery Act Transparency Statement|Sitemap|About US| Contact US: help@patsnap.com


