

A method for reversely rendering and drawing a thermodynamic diagram
A heat map and influence technology, applied in image analysis, image data processing, editing/combining graphics or text, etc., can solve problems such as poor self-adaptation, deformation and distortion, and insufficient consideration of data geospatial characteristics. Small particle size, guaranteed quality effect
Inactive Publication Date: 2019-05-03
航天精一(广东)信息科技有限公司
View PDF2 Cites 8 Cited by
- Summary
- Abstract
- Description
- Claims
- Application Information
AI Technical Summary
Problems solved by technology
[0003] There are also some deficiencies in the current heat map visualization research and general heat map drawing, mainly in the following two points: 1 Poor adaptability, deformation and distortion at different scales, and the data characteristics displayed by the heat map are very different under different map scales. Large; 2 Large data supports insufficient granularity, and generally only supports point heat map rendering below 10w; 3 When drawing a heat map, the data is projected to the screen window, and the geospatial characteristics of the data are not fully considered
Method used
View moreImage
Smart ImageViewing Examples

Examples
example
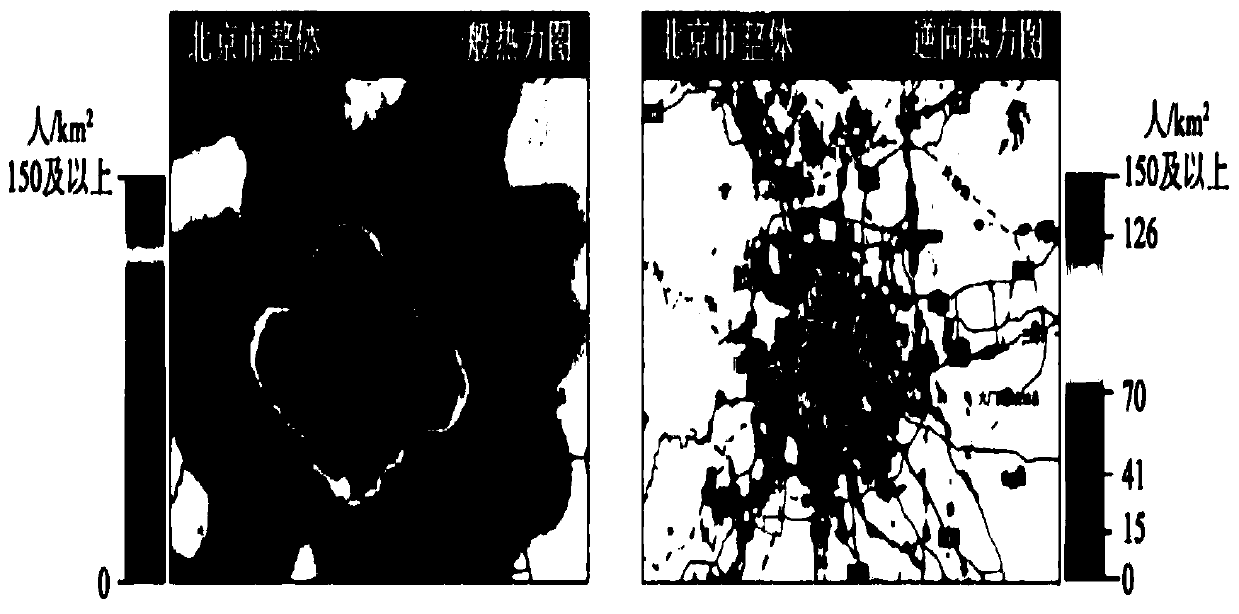
[0048] Practical example: The experiment intercepted a 4-hour data set of credit card swiping records at Beijing bus stations from 10 to 14 o'clock on September 1, 2016, with a total of more than 2.67 million records, and statistically merged them to obtain the passenger flow of bus stations. Numerical data, used for heatmap drawing.
Login to View More PUM
 Abstract
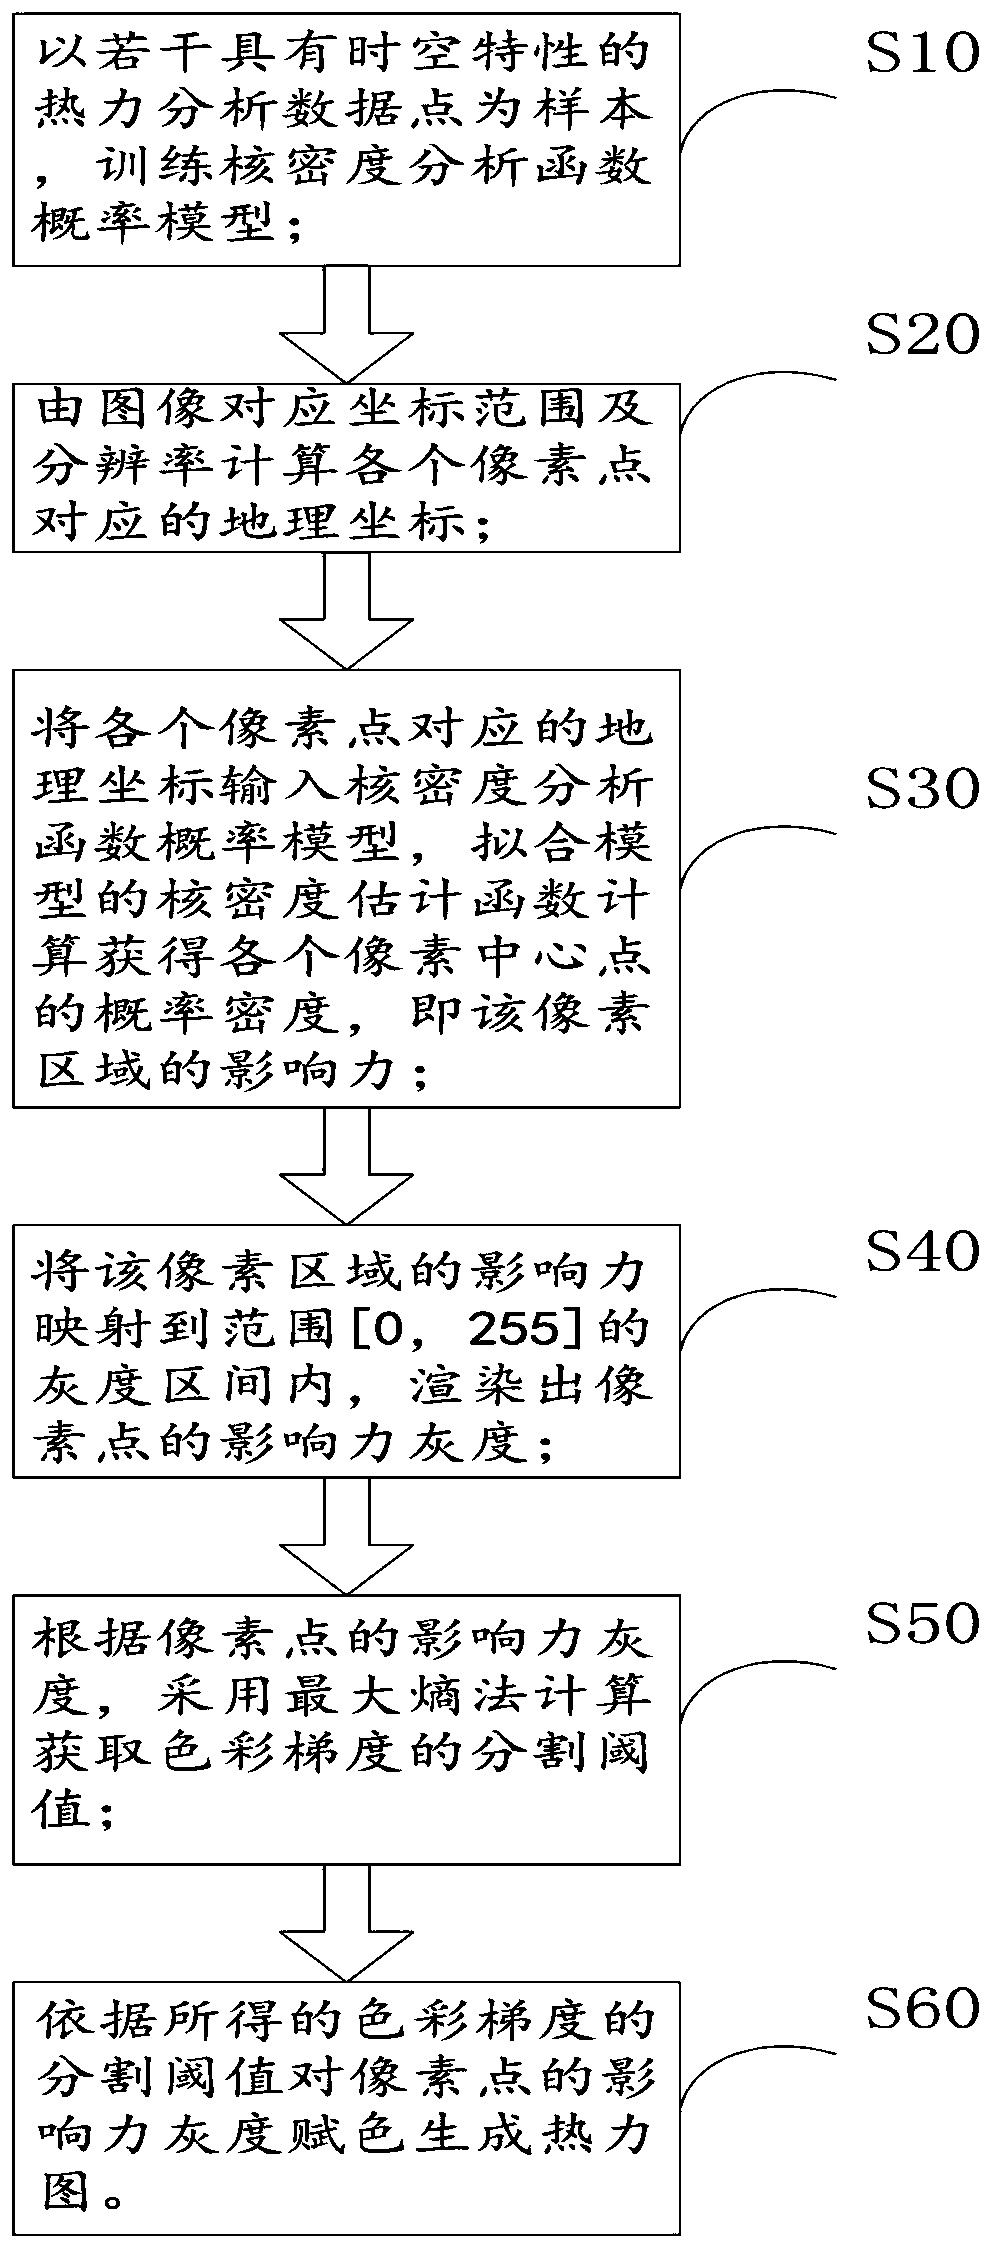
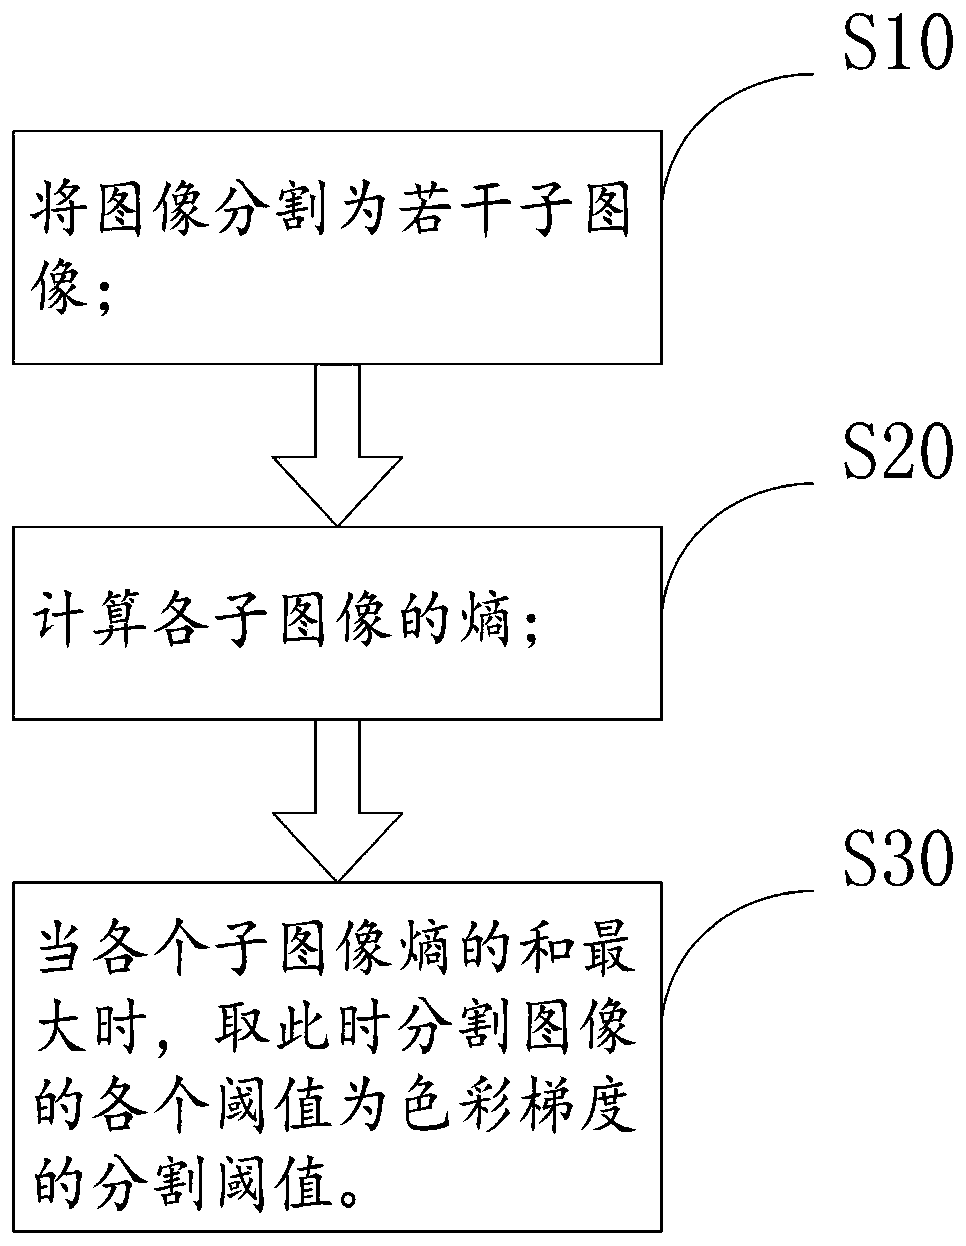
The invention discloses a method for reversely rendering and drawing a thermodynamic diagram, which comprises the following steps of: training a kernel density analysis function probability model by taking a plurality of thermodynamic analysis data points with space-time characteristics as samples; calculating a geographic coordinate corresponding to each pixel point according to the coordinate range corresponding to the image and the resolution; inputting the image into a kernel density analysis function probability model, and fitting a kernel density estimation function of the model to calculate and obtain the influence of a pixel region; mapping the influence of the pixel region into a gray scale interval of a range [0, 255], and rendering the influence gray scale of the pixel point; Obtaining a segmentation threshold value of the color gradient according to the influence gray level of the pixel point; and according to the obtained segmentation threshold value of the color gradient,color giving is carried out on the influence gray level of the pixel point to generate a thermodynamic diagram. According to the method, pixel points replace data points to serve as analysis elements, the calculation amount of geographic space analysis is greatly reduced, and the quality of thermodynamic diagram rendering can be guaranteed while the requirement for rendering of hundred million-level mass data thermodynamic diagrams is met.
Description
technical field [0001] The invention relates to the field of heat map drawing, in particular to a method for reverse rendering and drawing a heat map. Background technique [0002] Heat map is an intuitive representation method for thermal analysis data, which has a good display effect in the research of spatial big data mining and knowledge discovery. For a general heat map, the data is projected and clustered, the influence radius of the data points is determined, and then the heat grayscale map is drawn, and the heat map is colored with a gradient color. Many open source network maps, such as: foreign Openlayer, Leaflet and domestic online maps such as Baidu map, Tiandi map and supermap map, provide developers with API interfaces or plug-ins, which can conveniently realize the drawing of general heat maps on these platforms . [0003] There are also some deficiencies in the current heat map visualization research and general heat map drawing, mainly in the following two...
Claims
Login to View More Application Information
Patent Timeline
 IPC IPC(8): G06T7/11G06T7/136G06T11/60G06F17/18G06F16/29
Inventor曾耀国童昊昕
Owner航天精一(广东)信息科技有限公司