Methods of evaluating protein formulation stability and surfactant-stabilized insulin formulations derived therefrom

a protein and stability technology, applied in the field of methods of evaluating the physical stability of a protein formulation, can solve the problems of long test run of 20 or more days, high degree of thermo-mechanical stress on the protein formulation to be delivered, and high cost of time and resources for the development of new formulations, so as to achieve greater stability of insulin

Inactive Publication Date: 2003-03-20
MEDTRONIC MIMIMED INC
View PDF0 Cites 14 Cited by
  • Summary
  • Abstract
  • Description
  • Claims
  • Application Information

AI Technical Summary

Benefits of technology

[0031] Embodiments of the present invention are directed to reliable, time- and cost-efficient methods of evaluating the relative physical stability of a particular protein formulation. Thus, embodiments of the invention are useful analytical tools for developing new protein formulations with increased physical stability, as well as for use in evaluating the physical stability of newly prepared batches of known protein formulations in quality control procedures, or the like.
[0034] The controlled stress is externally applied to one or more protein formulations under evaluation. This controlled stress is physically translated to the protein contained in a particular formulation. Thus in embodiments of the invention, an application of stress yields an accelerated rate of change in the physical state of the protein formulations under evaluation. More specifically, the applied stress induces one or more non-native states of the protein, i.e. non-native conformational states, to be produced at an accelerated rate. These non-native states of the protein generally are not biologically active and represent a lower energy state of the protein. The time required for a certain amount of a particular protein to undergo a physical change to one or more of its non-native states is reflective of the physical stability of the protein formulation. Moreover, a relative comparison of two or more protein formulations that differ in composition yields the relative physical stability of the proteins formulations under evaluation.
[0049] The use of a survival curve analysis applied to the spectroscopic data of changes in protein states yields a simple method which compares a statistically relevant number of samples of a given formulation to a statistically relevant number of samples of another formulation, yielding a relative physical stability profile of the sample types under evaluation. Accordingly, no prior knowledge or understanding of the mechanism of aggregation, or the mechanism of protein conformational changes, is needed for applications of embodiments of the invention.
[0055] Although this particular embodiment of the invention exposes the protein formulations to air, and thus increasing the interfacial tension, i.e., exposure to a air-water interfaces, other embodiments of the invention utilize placing the protein samples in sealed vials from which residual air is evacuated, thereby reducing the air-water interface.

Problems solved by technology

Thus, the use of such infusion delivery devices places a high degree of thermo-mechanical stress on the protein formulation to be delivered.
Additionally, infusion delivery devices expose the protein to hydrophobic interfaces that are found in the delivery syringes and catheters.
These interfacial interactions tend to destabilize the protein formulation by inducing denaturation of the native structure of the protein at these hydrophobic interfaces.
These analytical methods, however, generally require long test runs of 20 or more days, as well manual intervention during the test period.
Given the long test runs and manual intervention required to assess the physical stability of a new insulin formulation, as well as the need to vary five or more excipients over a particular concentration range during the analytical process, the development of new formulations is costly in terms of time and resources.
Moreover, even for the evaluation of new batches of a known protein formulation, such as in quality control analysis, current state of the art methods are less than desirable.

Method used


Image

  • Methods of evaluating protein formulation stability and surfactant-stabilized insulin formulations derived therefrom
  • Methods of evaluating protein formulation stability and surfactant-stabilized insulin formulations derived therefrom
  • Methods of evaluating protein formulation stability and surfactant-stabilized insulin formulations derived therefrom

Examples


example 1

[0075] An example of the calculations using Prism software, for example, is as follows. In the X columns, the times to start aggregation (e.g. t.sub.50) are entered. If a particular sample did not aggregate, the time when the run ended is entered. In the Y columns, the number 1 is entered for the rows where the sample aggregated and 0 for the rows where the sample did not aggregate at a given time. Thus, using this method, a calculation of the survival fractions at each data collection time point and survival fraction vs. time are generated. For comparison between the formulation of interest and the reference batch, the log rank test, which is equivalent to the Mantel-Haenszel test, is performed. This test generates a P value testing the null hypothesis that the survival curves are identical in the overall populations. In general if the P value is less than 0.05, the difference between the two sets of data being compared are statistically significant. In other words, the physical st...

example 2

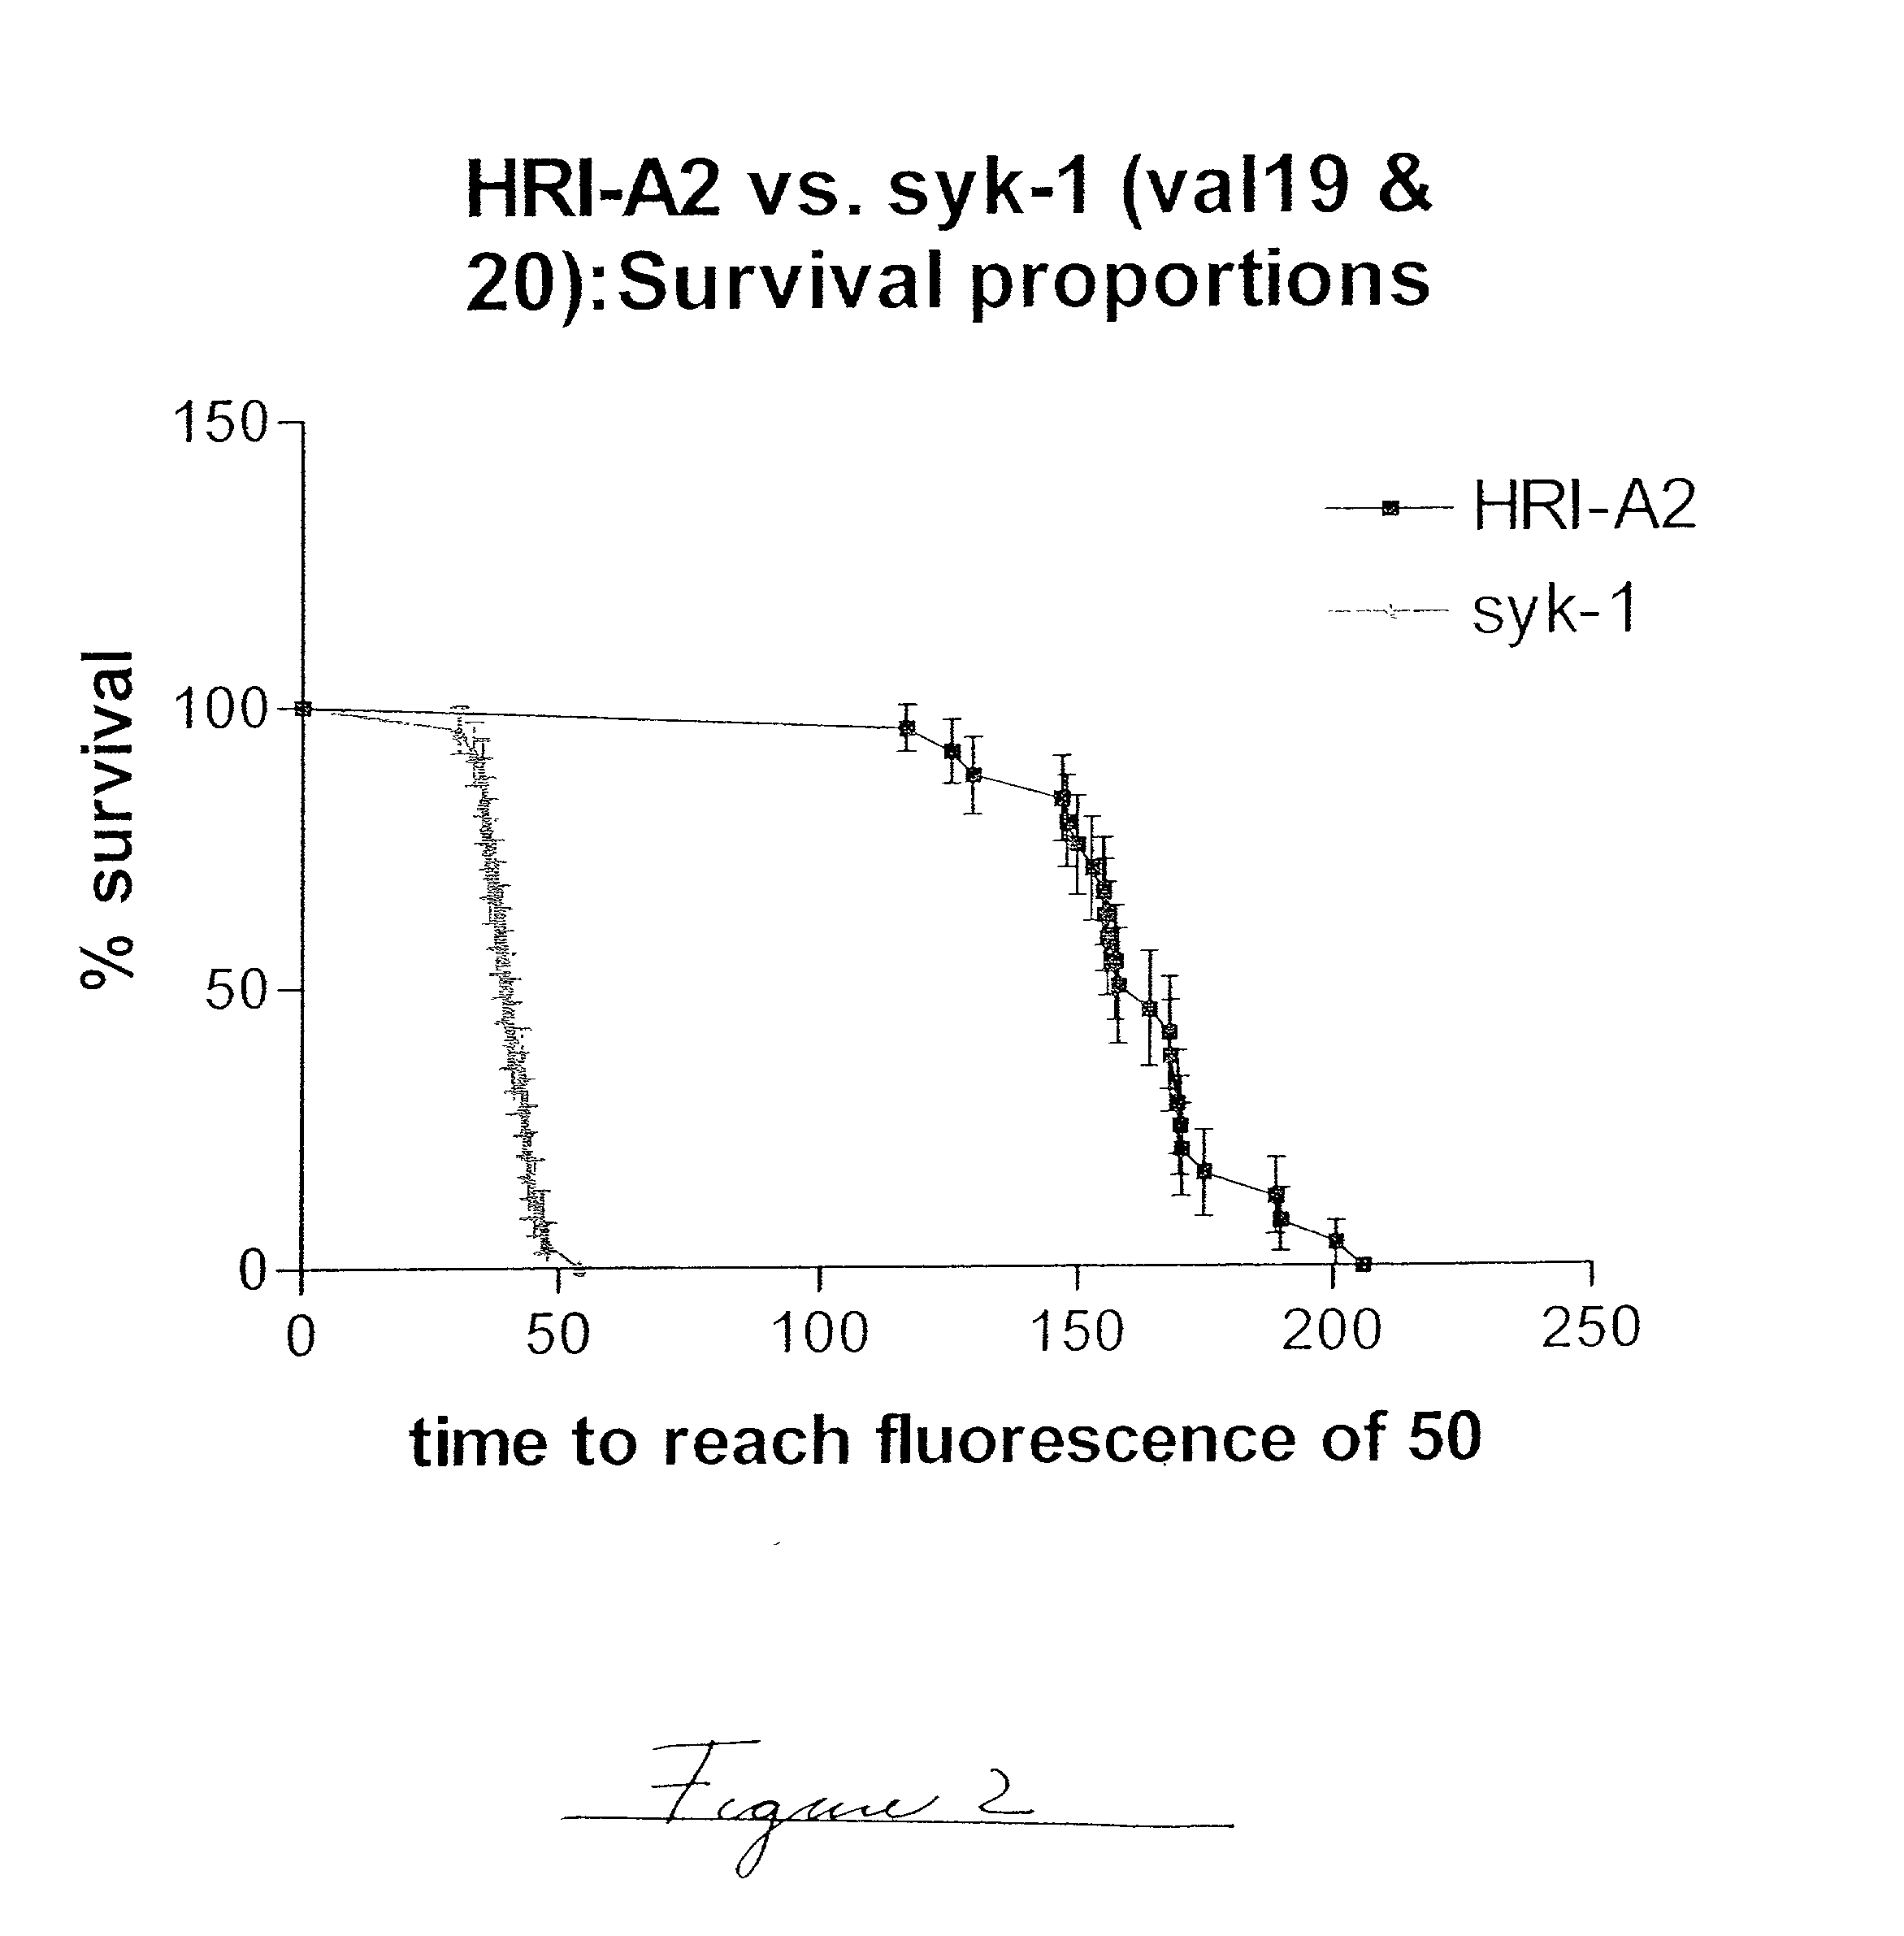
[0076] The example, shown in FIG. 2, is a graphic display of the experimental data of % survival. The statistical evaluation of the data was performed using commercial software (GraphPad). A comparison of the survival curve statistical data of the plot shown in FIG. 2 is shown in Table 2.

1TABLE 2 Illustration of Typical Survival Curve Data Log rank Test Chi square 56.46 df 1 P value P < 0.0001 P value summary *** Are the survival curves sig different? Yes Median survival HRI-A2 164.1 hrs syk-1 40.08 hrs Ratio 4.094 95% CI of ratio 3.526 to 4.662

[0077] Based on the above information, it is concluded that the difference in the estimated relative physical stability of the two formulations under evaluation is statistically significant and that the median time to a fixed fluorescence is approximately 4 times longer for HRI-A2 as for syk-1. When the same set of sample types were repeatedly tested, the statistical error or standard deviation of the median survival ratio is between 11 and 2...

example 3

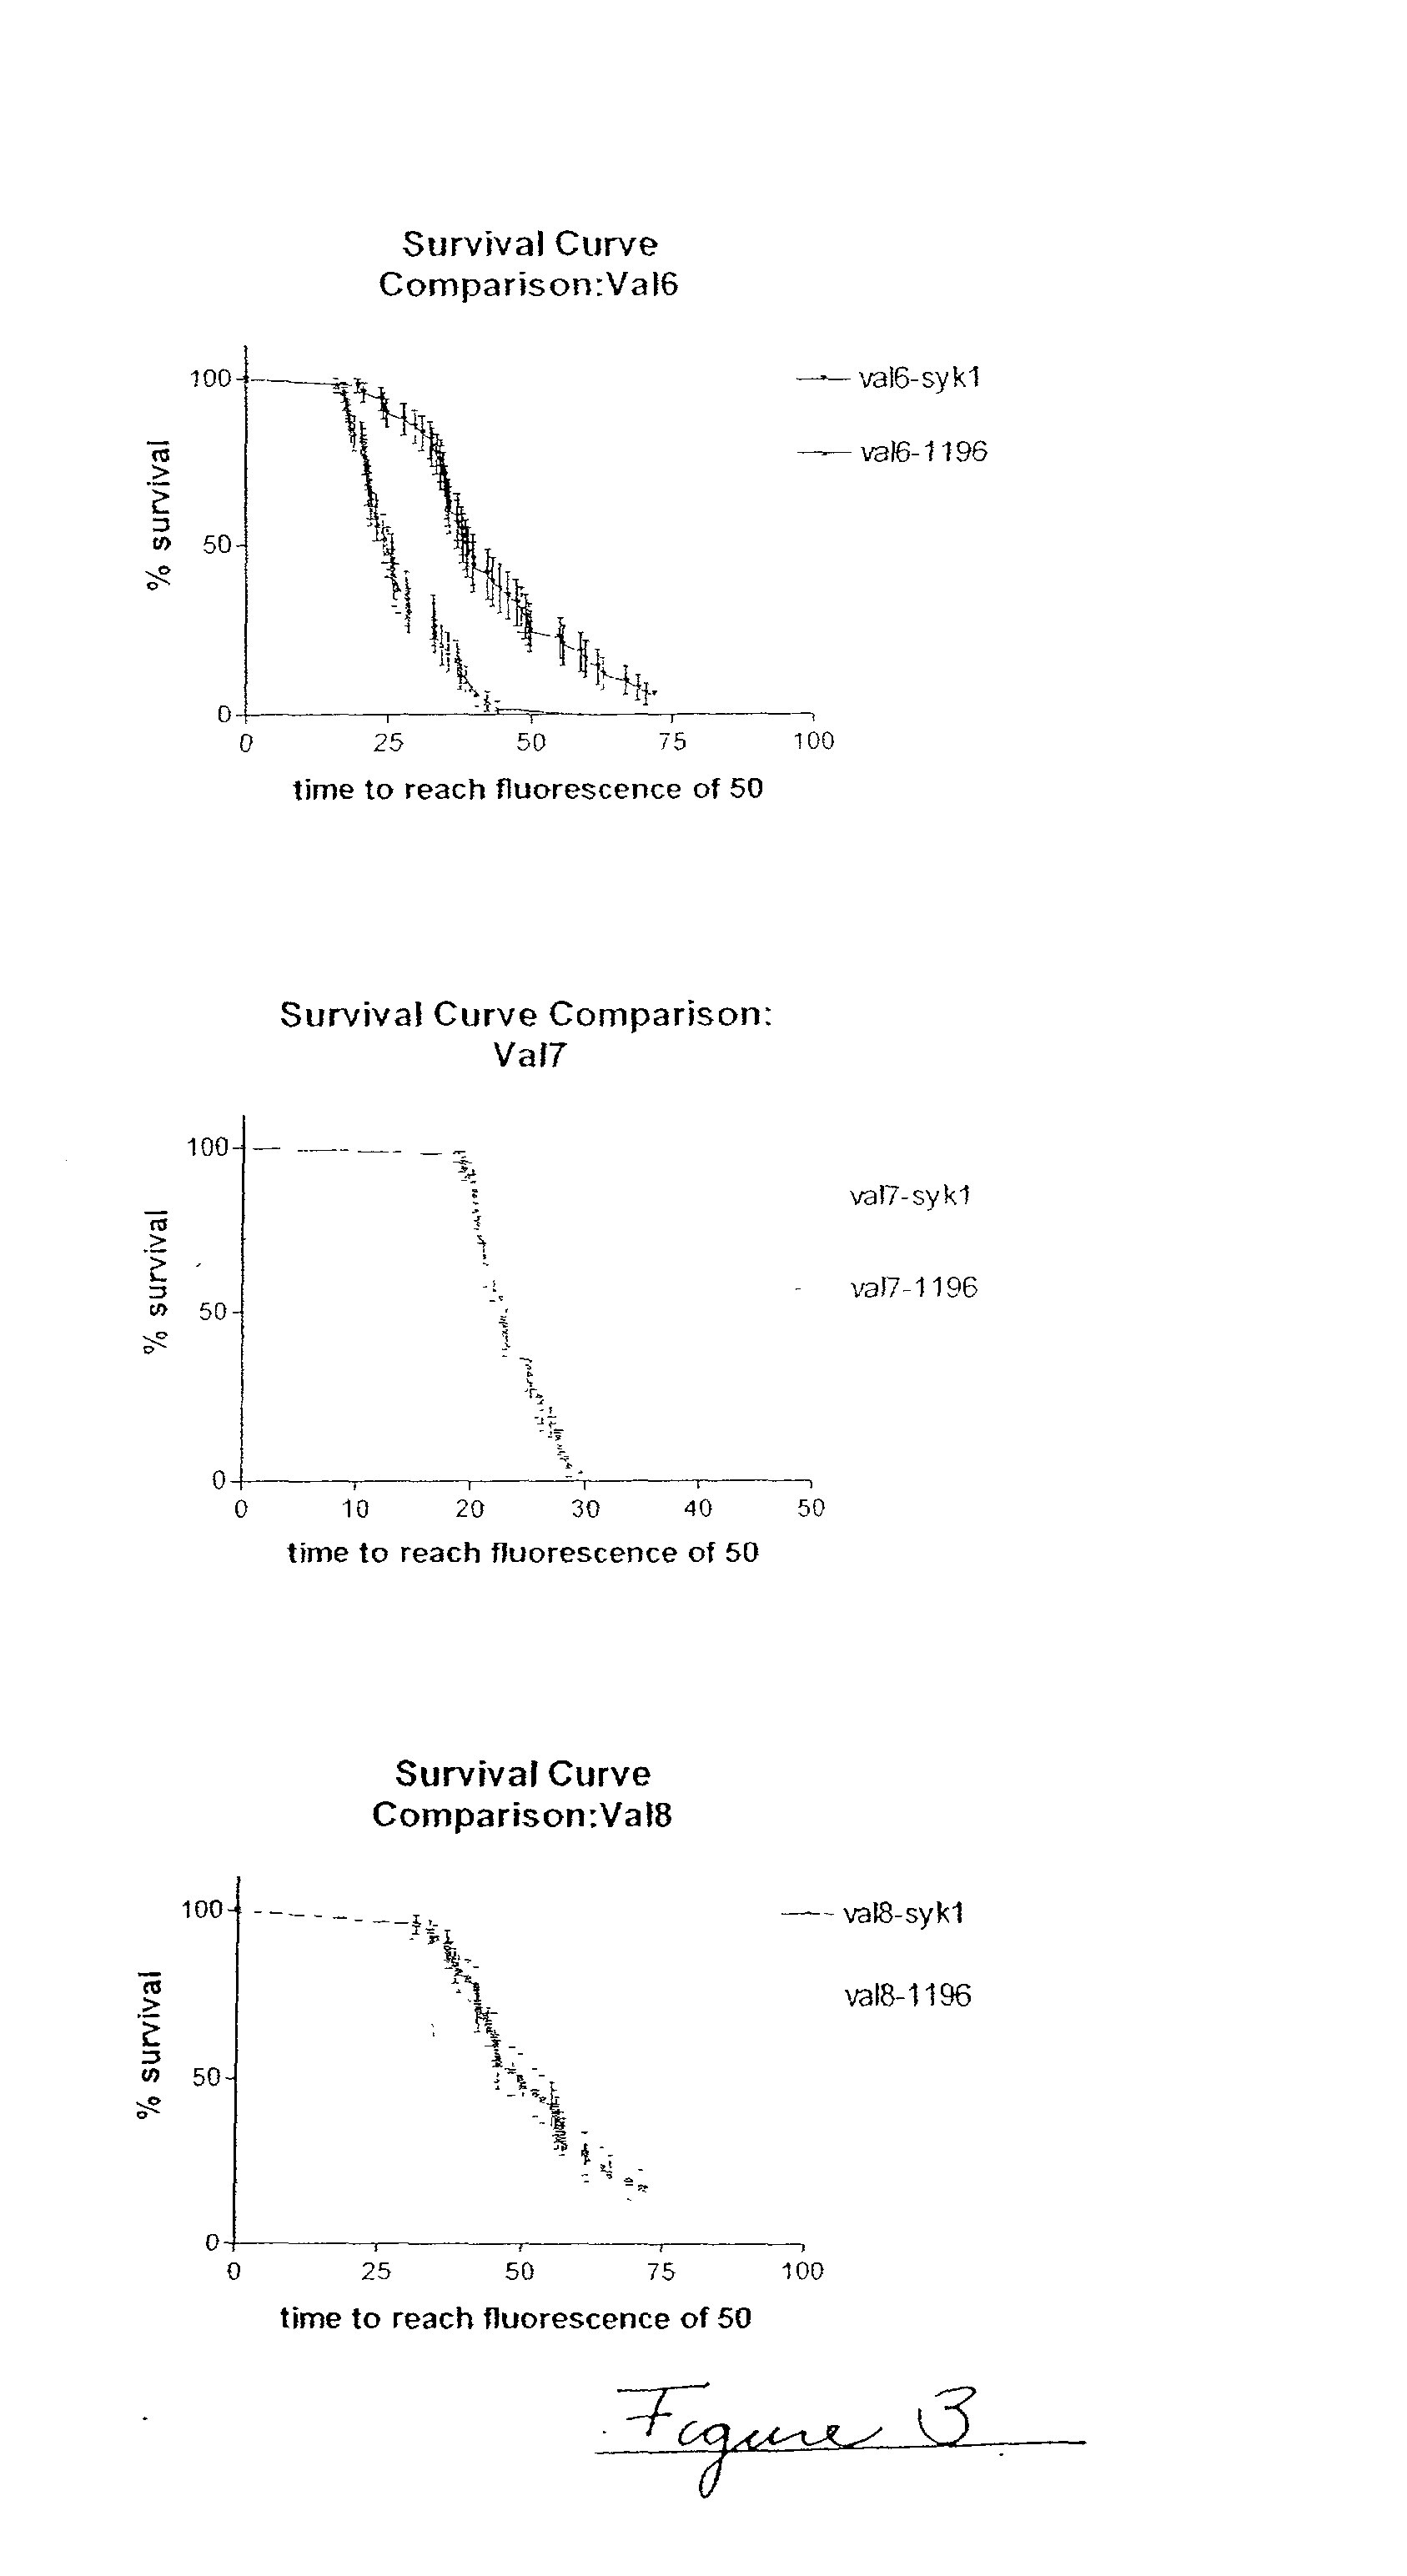
[0078] In this example, three experimental runs were conducted to validate the accelerated physical stability method, referred to as Val 6, Val 7 Val 8 (n=3). In these experimental runs, there are 48 samples per sample type (N=48). Each experimental run compares two formulations, one formulation using Diosynth semi-synthetic insulin and the other formulation using Aventis semi-synthetic insulin. Table 3 gives the composition of the protein formulations compared. FIG. 3 shows survival curve analyses for the three runs. Table 4 gives the survival curve analysis for the three different runs.

2TABLE 3 Formulation Summary syk-1 1196 insulin type semi- Semi- synthetic synthetic insulin Diosynth Aventis manufacturer insulin concn 400 400 (units / ml) Tris (mg / ml) 6 6 glycerin 17 17 (mg / ml) phenol 2.7 2.7 (mg / ml) surfactant Genapol Genapol type PF10 PF10 surfactant 0.01 0.01 concn (mg / ml) zinc (mg / ml) 0.108 0.108

[0079]

3TABLE 4 Survival Curve Analysis median median survival % survival at insuli...


PUM

PropertyMeasurementUnit
volumeaaaaaaaaaa
volumeaaaaaaaaaa
volumesaaaaaaaaaa

Abstract

Embodiments of the invention are directed to a method of estimating the physical stability of a protein formulation. A particular embodiment of the invention places the protein formulation under an agitational stress that causes the protein to aggregate at an accelerated rate. In one embodiment, the change in protein aggregation is monitored spectroscopically using Thioflavin-T. Embodiments of the invention then utilize a survival curve analysis to ascertain the relative physical stability of the different protein formulations under study. This method was used to develop novel surfactant-stabilized insulin formulations in a rapid, cost efficient manner, thus illustrating the utility of the inventive method to the discovery and development of pharmaceutical protein formulations.

Description

[0001] Embodiments of the invention are directed to accelerated methods of determining the relative physical stability of a protein formulation and surfactant-stabilized insulin formulations.[0002] The physical stability of pharmaceutical protein formulations is of paramount importance since there is always a time delay between production of the protein formulation and its delivery to an appropriate patient. The physical stability of a protein formulation becomes even more critical when using drug delivery devices to dispense the protein formulation, such as infusion pumps and the like. When these delivery devices are used, the protein formulation is generally stored in the device, which is either worn close to the body or implanted within the body. In either case, a patient's own body heat and body motion, plus turbulence produced in the delivery tubing and pump, impart a high amount of thermo-mechanical energy to a protein formulation. Thus, the use of such infusion delivery devic...

Claims


Application Information

Patent Timeline
Patent Type & Authority Applications(United States)
IPC IPC(8): A61K9/00A61K47/00A61K47/02A61K47/10A61K47/18A61K47/26G01N33/68G01N33/74
CPCA61K9/0019A61K47/02A61K47/10A61K47/18A61K47/26A61M5/14G01N33/6803G01N33/74
Inventor KIM, SEONYOUNGVAN ANTWERP, WILLIAM P.GROSS, TODD M.GULATI, POONAM S.
Owner MEDTRONIC MIMIMED INC
Why Eureka
Try Eureka