In a similar manner, the treatment of
disease through the administration of drugs can result in a wide range of desired effects and unwanted side effects in a patient.
However, the biological consequences of
gene expression, or altered
gene expression following perturbation, are extremely complex.
At present, genomic methods have a high associated operational cost and proteomic methods require investment in expensive
capital cost equipment and are labour intensive, but both have the potential to be powerful tools for studying biological response.
The choice of method is still uncertain since careful studies have sometimes shown a
low correlation between the pattern of
gene expression and the pattern of
protein expression, probably due to sampling for the two technologies at inappropriate time points.
Even in combination, genomic and proteomic methods still do not provide the range of information needed for understanding integrated cellular function in a living
system, since they do not take account of the dynamic metabolic status of the
whole organism.
Conversely, sampling tissue for genomic and proteomic studies at inappropriate time points may result in a relevant gene or
protein being overlooked.
Gene-based prognosis has yet to become a clinical reality for any major prevalent
disease, almost all of which have multi-gene
modes of inheritance and significant environmental
impact making it difficult to identify the gene panels responsible for susceptibility.
While genomic and proteomic methods may be useful aids, for example, in
drug development, they do suffer from substantial limitations.
For example, while genomic and proteomic methods may ultimately give profound insights into toxicological mechanisms and provide new surrogate biomarkers of
disease, at present it is very difficult to relate genomic and proteomic findings to classical cellular or biochemical indices or endpoints.
Further difficulties arise with
in vitro cell-based studies.
In cases such as these, genomic and proteomic methods are likely to be ineffective.
However, all disease or
drug-induced pathophysiological perturbations result in disturbances in the ratios and concentrations, binding or fluxes of endogenous biochemicals, either by direct
chemical reaction or by binding to key enzymes or nucleic acids that control
metabolism.
If these disturbances are of sufficient magnitude, effects will result which will affect the efficient functioning of the
whole organism.
Secondly, many of the risk factors already identified (e.g., levels of various lipids in blood) are
small molecule metabolites which will contribute to the metabonomic dataset.
A similar limitation also applies to proteomic studies.
The multivariate nature of the
NMR data means that classification of samples is possible using a combination of descriptors even when one descriptor is not sufficient, because of the inherently low analytical variation in the data.
If a substantial amount of D2O has been added, then it is possible that certain 1H NMR resonances will be lost by H / D exchange.
Freeze-
drying of biofluid samples also causes the loss of volatile components such as
acetone.
Furthermore, there are still important problems of spectral interpretation that arise due to compartmentation and binding of small molecules in the organised macromolecular domains that exist in some biofluids such as
blood plasma and bile.
All this complexity need not reduce the diagnostic capabilities and potential of the technique, but demonstrates the problems of biological variation and the influence of variation on diagnostic certainty.
The information content of biofluid spectra is very high and the complete assignment of the 1H NMR spectrum of most biofluids is usually not possible (even using 900 MHz NMR
spectroscopy).
However, the assignment problems vary considerably between biofluid types.
In contrast,
urine composition can be very variable and there is enormous variation in the concentration range of NMR-detectable metabolites; consequently, complete analysis is much more difficult.
100 nM at 800 MHz)
pose severe NMR spectral assignment problems.
Even at the present level of technology In NMR, it Is not yet possible to detect many important biochemical substances (e.g. hormones, some proteins, nucleic acids) in body fluids because of problems with sensitivity, line widths, dispersion and
dynamic range and this area of research will continue to be technology-limited.
In addition, the collection of NMR spectra of biofluids may be complicated by the relative water intensity,
sample viscosity,
protein content,
lipid content, and low molecular weight peak overlap.
However, a
limiting factor in understanding the biochemical information from both 1D and 2D-NMR spectra of tissues and biofluids Is their complexity.
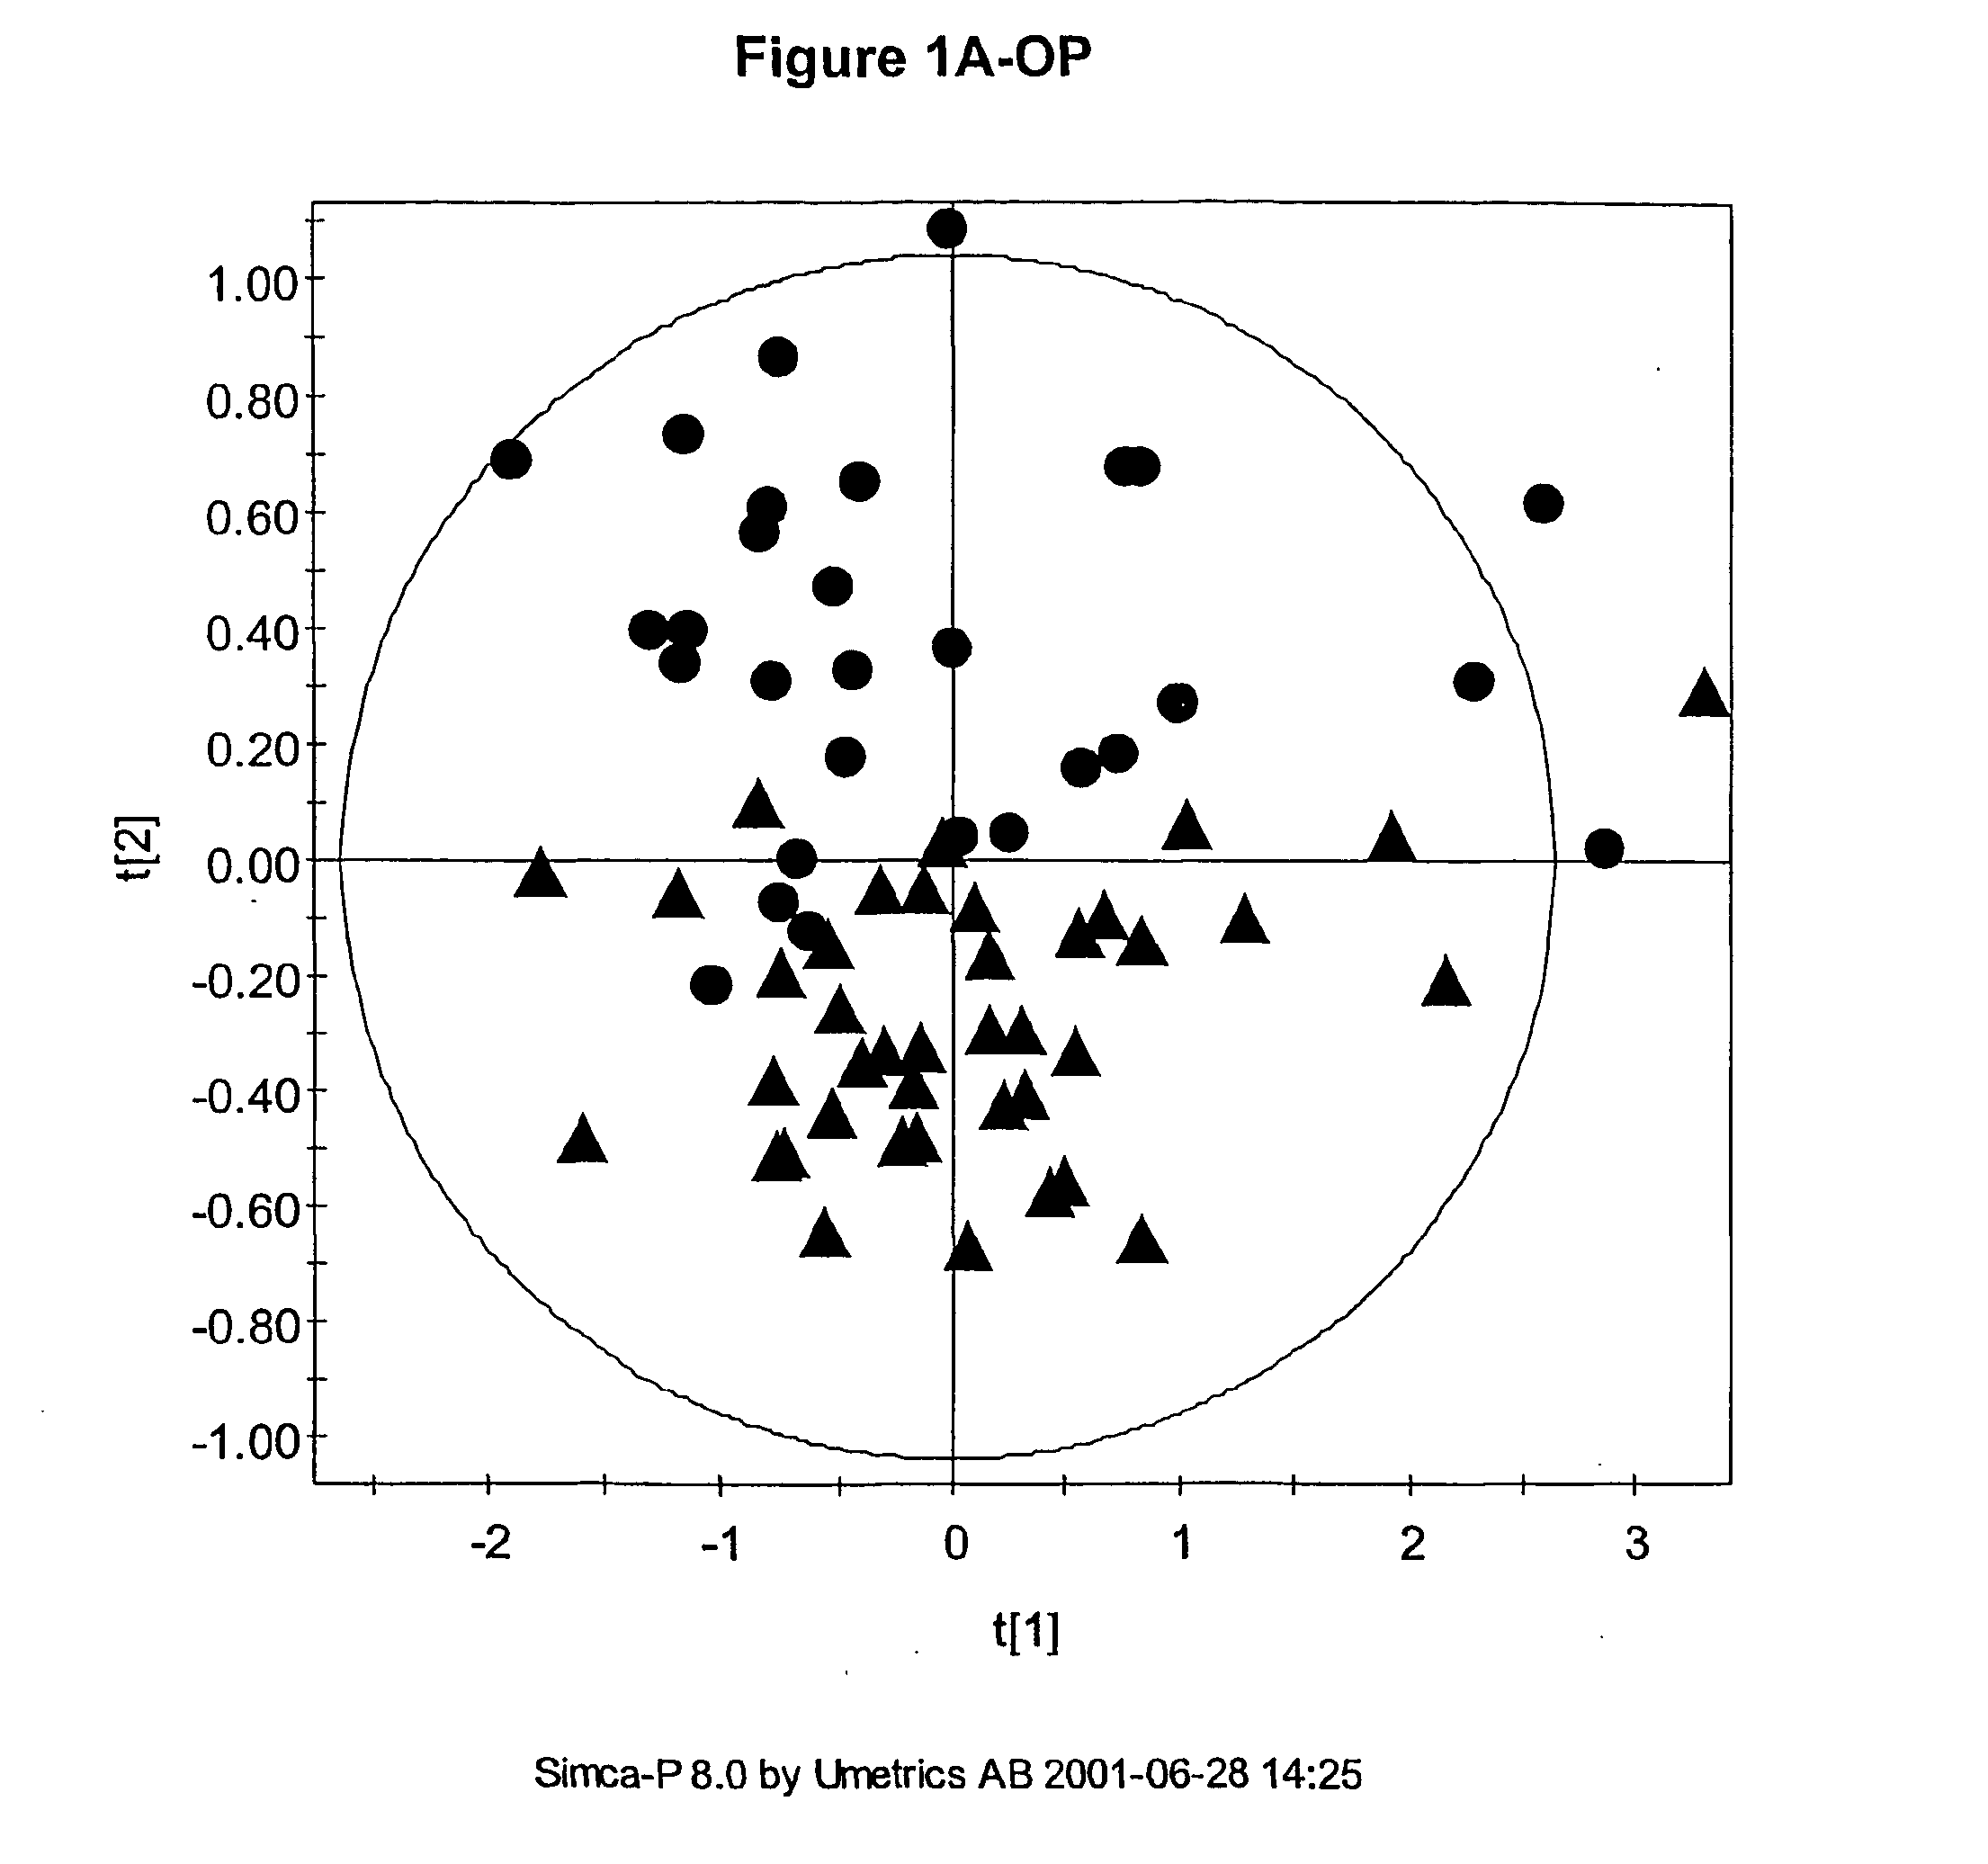
Also, the number of parameters used can be very large such that visualisation of the regularities, which for the
human brain is best in no more than three dimensions, can be difficult.
Usually the number of measured descriptors is much greater than three and so simple scatter plots cannot be used to visualise any similarity between samples.
However, such data are often more complex, with time-related biochemical changes detected by NMR.
Although the utility of the metabonomic approach is well established, its full potential has not yet been exploited.
For example, all that has been previously proposed is still not generally sufficient to achieve clinically useful diagnosis of disease.
Although
chemometrics has been able to provide some classification of types previously, the studies have required that the classification be done under a series of restrictions which limit the ability to apply the method to analysis of complex datasets as would be required to apply the method for the practical diagnosis / prognosis of diseases that could be useful clinically.
Although these studies clearly demonstrate the potential of the technique, they are limited because the animals which compose each class are genetically homogenous (in-bred populations).
Unfortunately, such an approach is insufficiently powerful to identify weak patterns against the background biochemical
noise, and could not be used, for example, to determine the extent of
coronary heart disease or to distinguish identical from non-identical twins.

