
Raman spectroscopy for non-invasive glucose measurements

a non-invasive, glucose-based technology, applied in the direction of optical radiation measurement, instruments, spectrometry/spectrophotometry/monochromators, etc., can solve the problems of insufficient accuracy for non-adjunctive clinical use, inability to demonstrate sufficient accuracy for non-adjunctive use, and inability to demonstrate the measurement signal from actual glucose concentrations. achieve the effect of improving the size and resolution of the imaging device, and improving the signal to noise ratio

Active Publication Date: 2007-03-15
MASSACHUSETTS INST OF TECH
View PDF44 Cites 73 Cited by
  • Summary
  • Abstract
  • Description
  • Claims
  • Application Information

AI Technical Summary

Benefits of technology

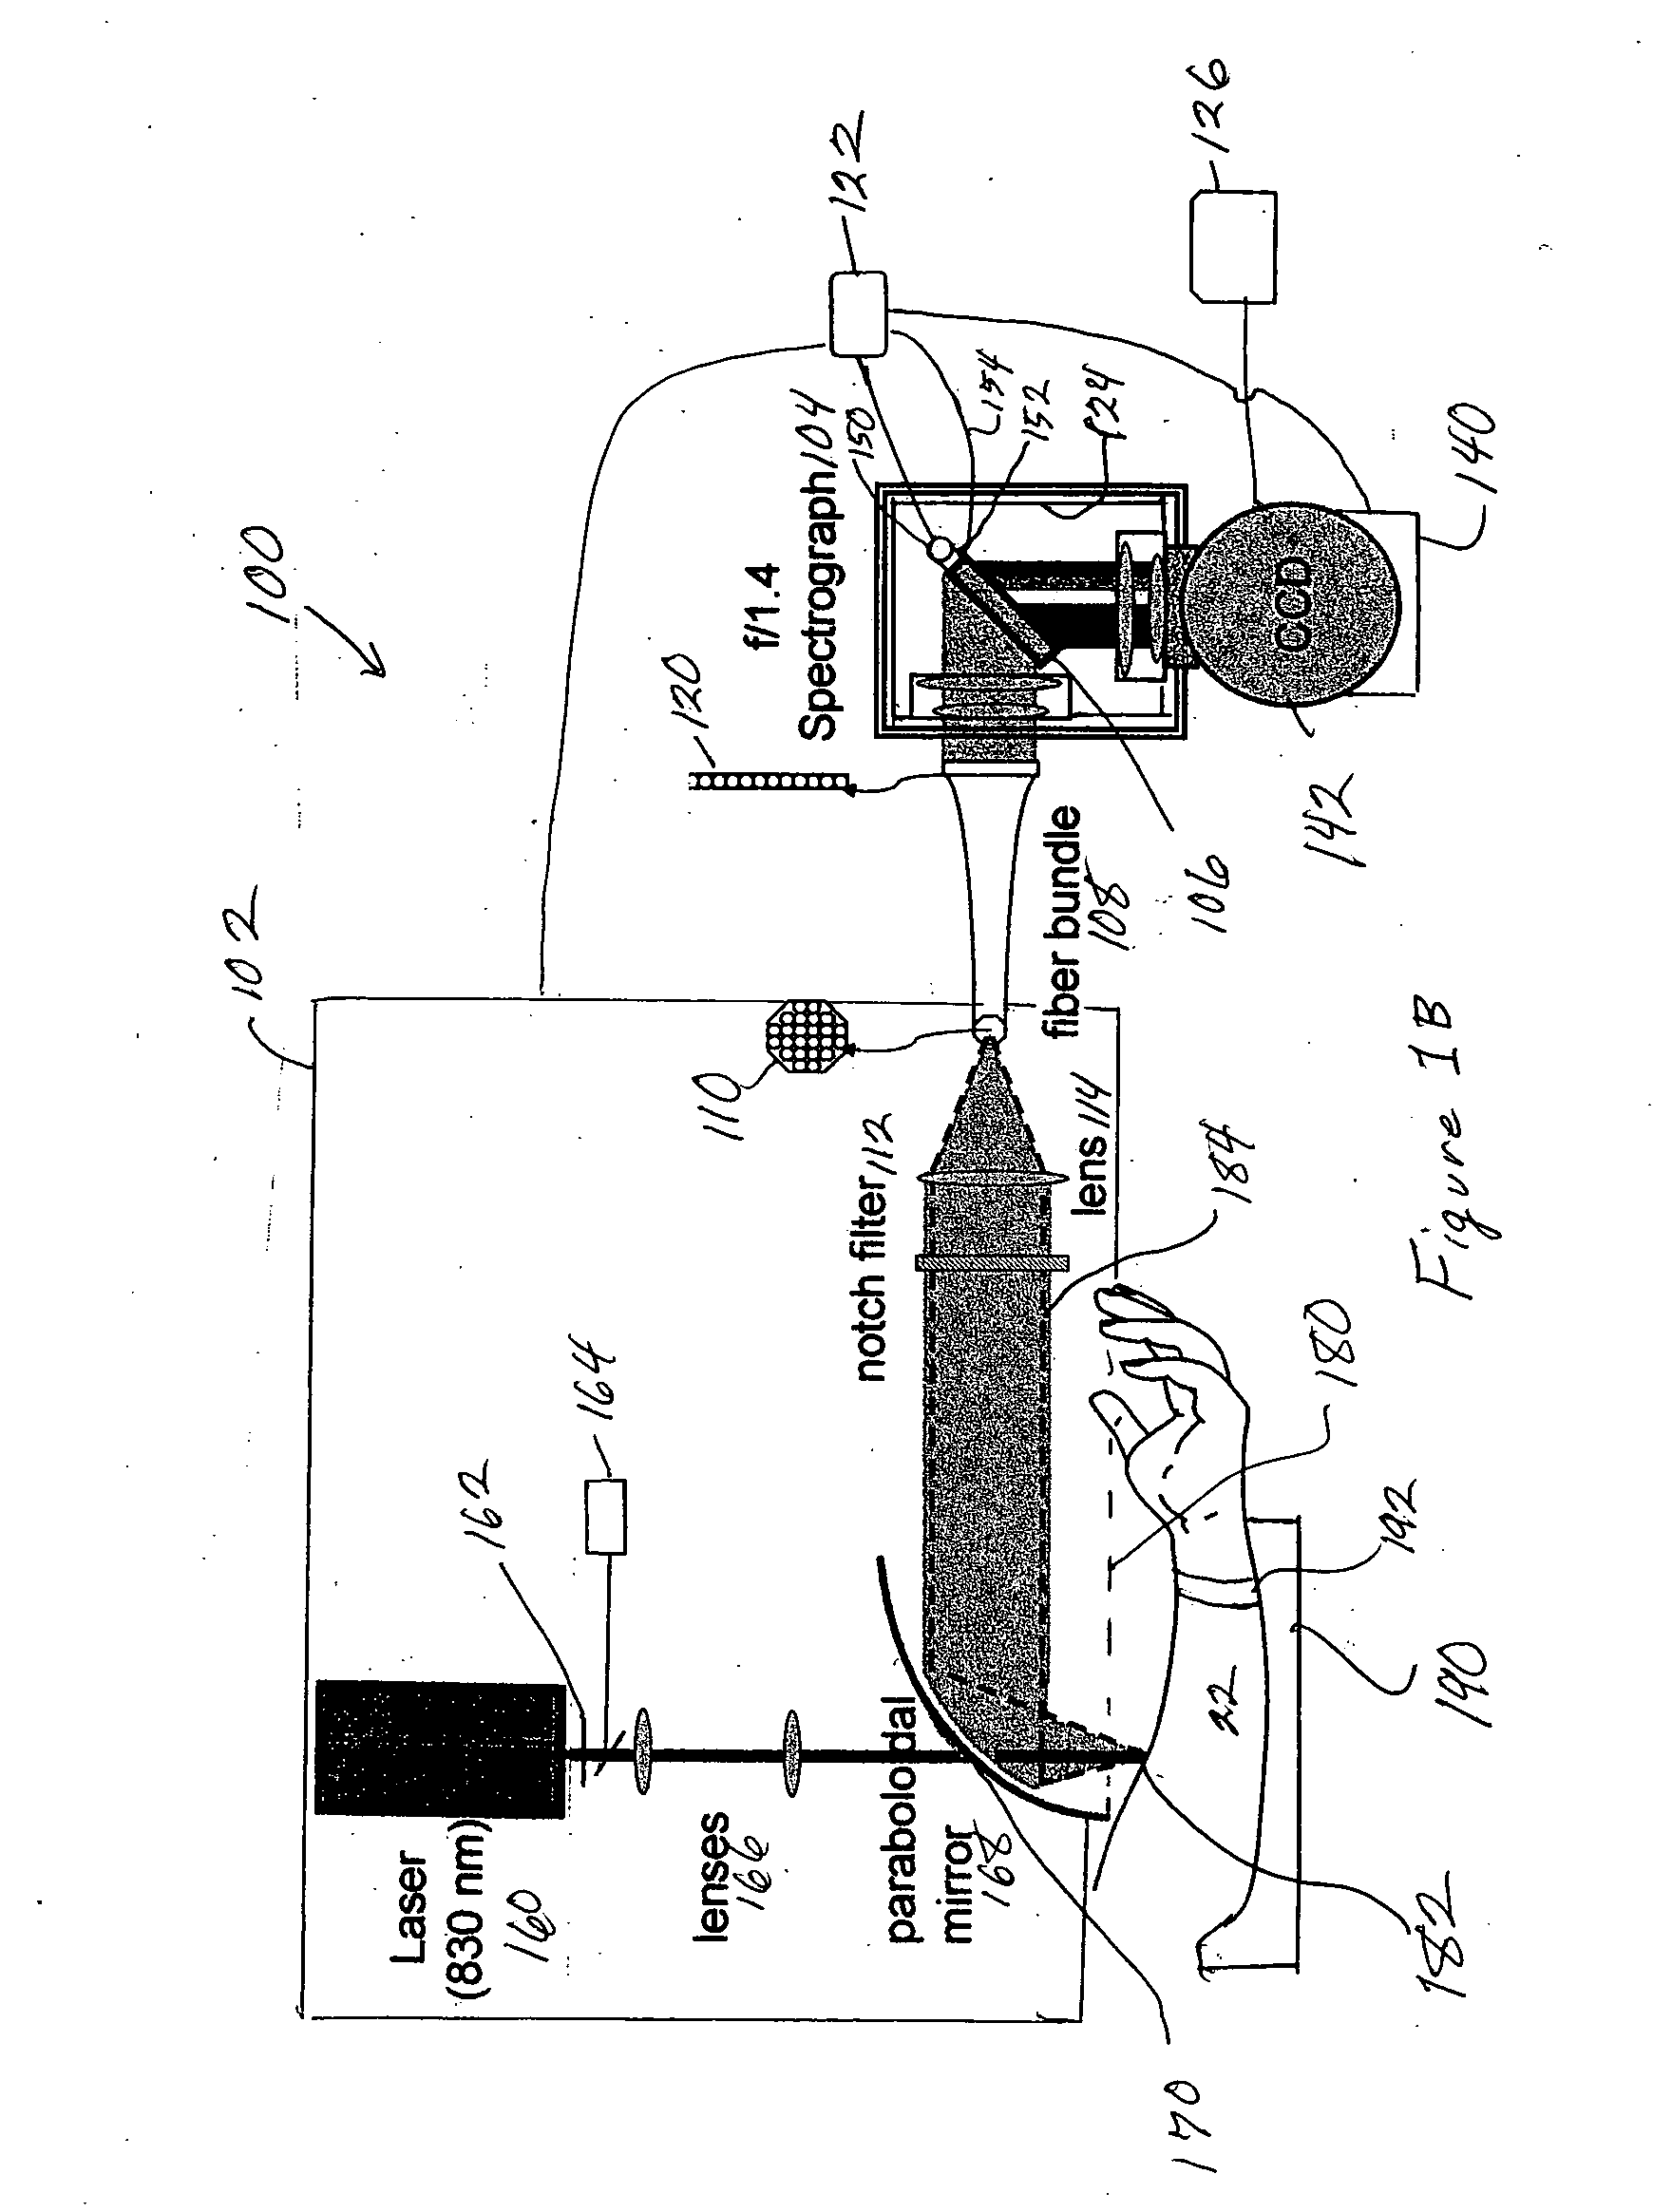
[0004] To perform accurate and repeatable transdermal measurements of glucose and other analytes requires improvements in the signal to noise ratio to compensate for the difficulties in acquiring weak Raman signals within the complex spectrum found in human skin. By improving the size and resolution of the imaging device, increasing the number of optical fibers used for coupling the collected signal for detection, the use of a sidelooking parabolic mirror for light delivery and collection and a method for curvature correction during binning of pixels, substantial improvements in signal to noise ratio have been obtained. In achieving signal to noise ratios in excess of 2000, and preferably greater than 4000 in measurements through human skin, repeatable and verifiable measurements of blood glucose and other analytes such as urea, total protein, albumin, triglycerides, hematocrit and hemoglobin can be obtained. Signal to noise ratios in excess of 6000 have been obtained and are preferably employed to minimize error.

Problems solved by technology

Conventional blood sampling methods are painful and have other undesirable features.
Of the in vivo measurements reported for a variety of non-invasive techniques, none has demonstrated sufficient accuracy for non adjunctive clinical use.
In addition, there has been no substantial verification that the measured signals result from the actual glucose concentrations.
Instead, it has been shown that the calibration models derived easily become over-determined, and that chance correlations are picked up as variations in glucose concentrations.

Method used


Image

  • Raman spectroscopy for non-invasive glucose measurements
  • Raman spectroscopy for non-invasive glucose measurements
  • Raman spectroscopy for non-invasive glucose measurements

Examples


Embodiment Construction

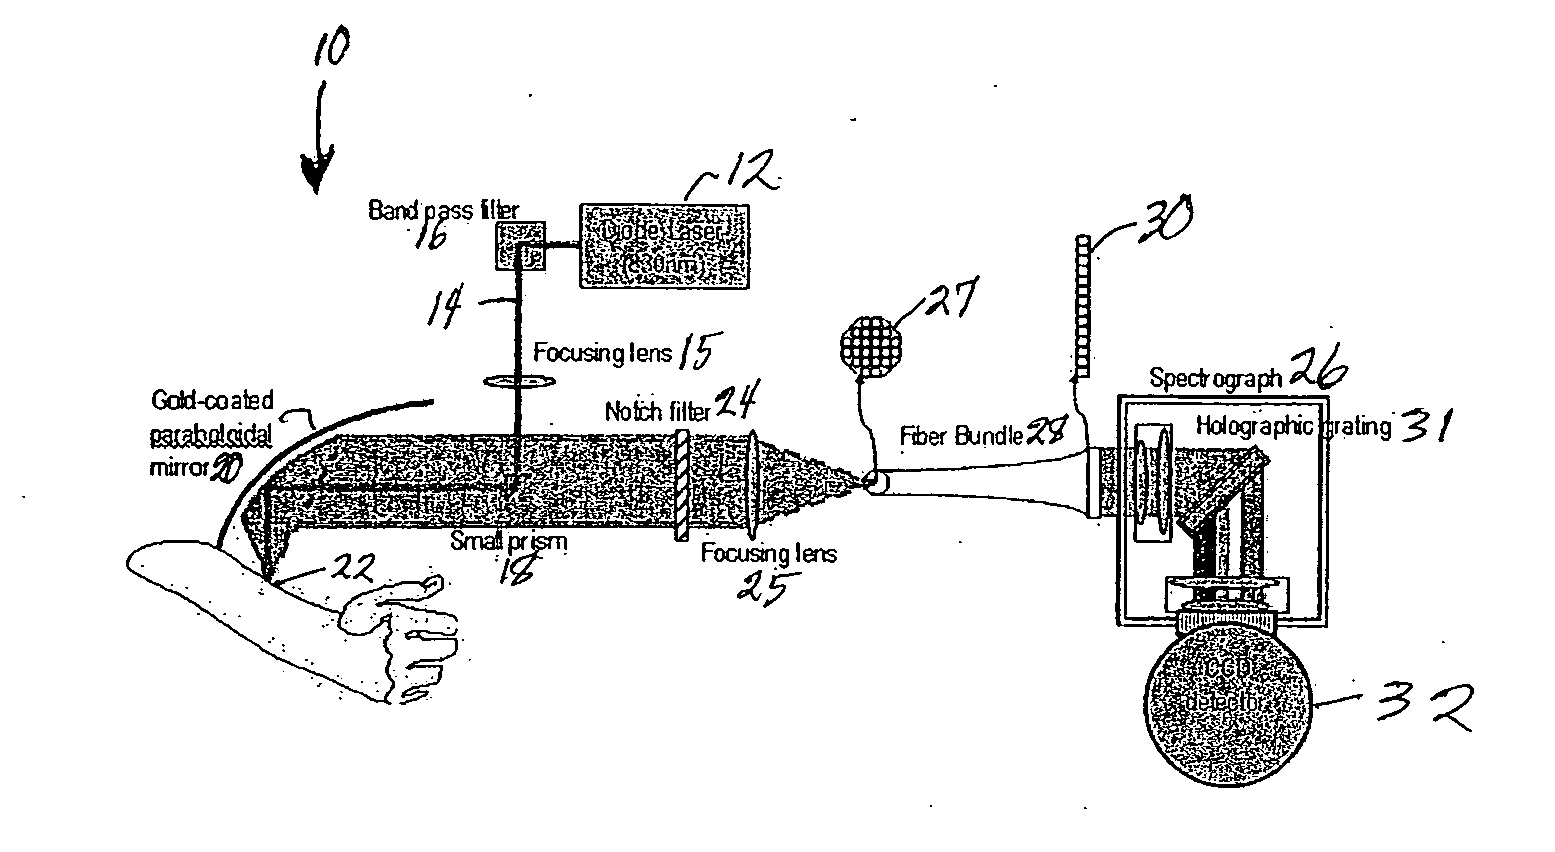
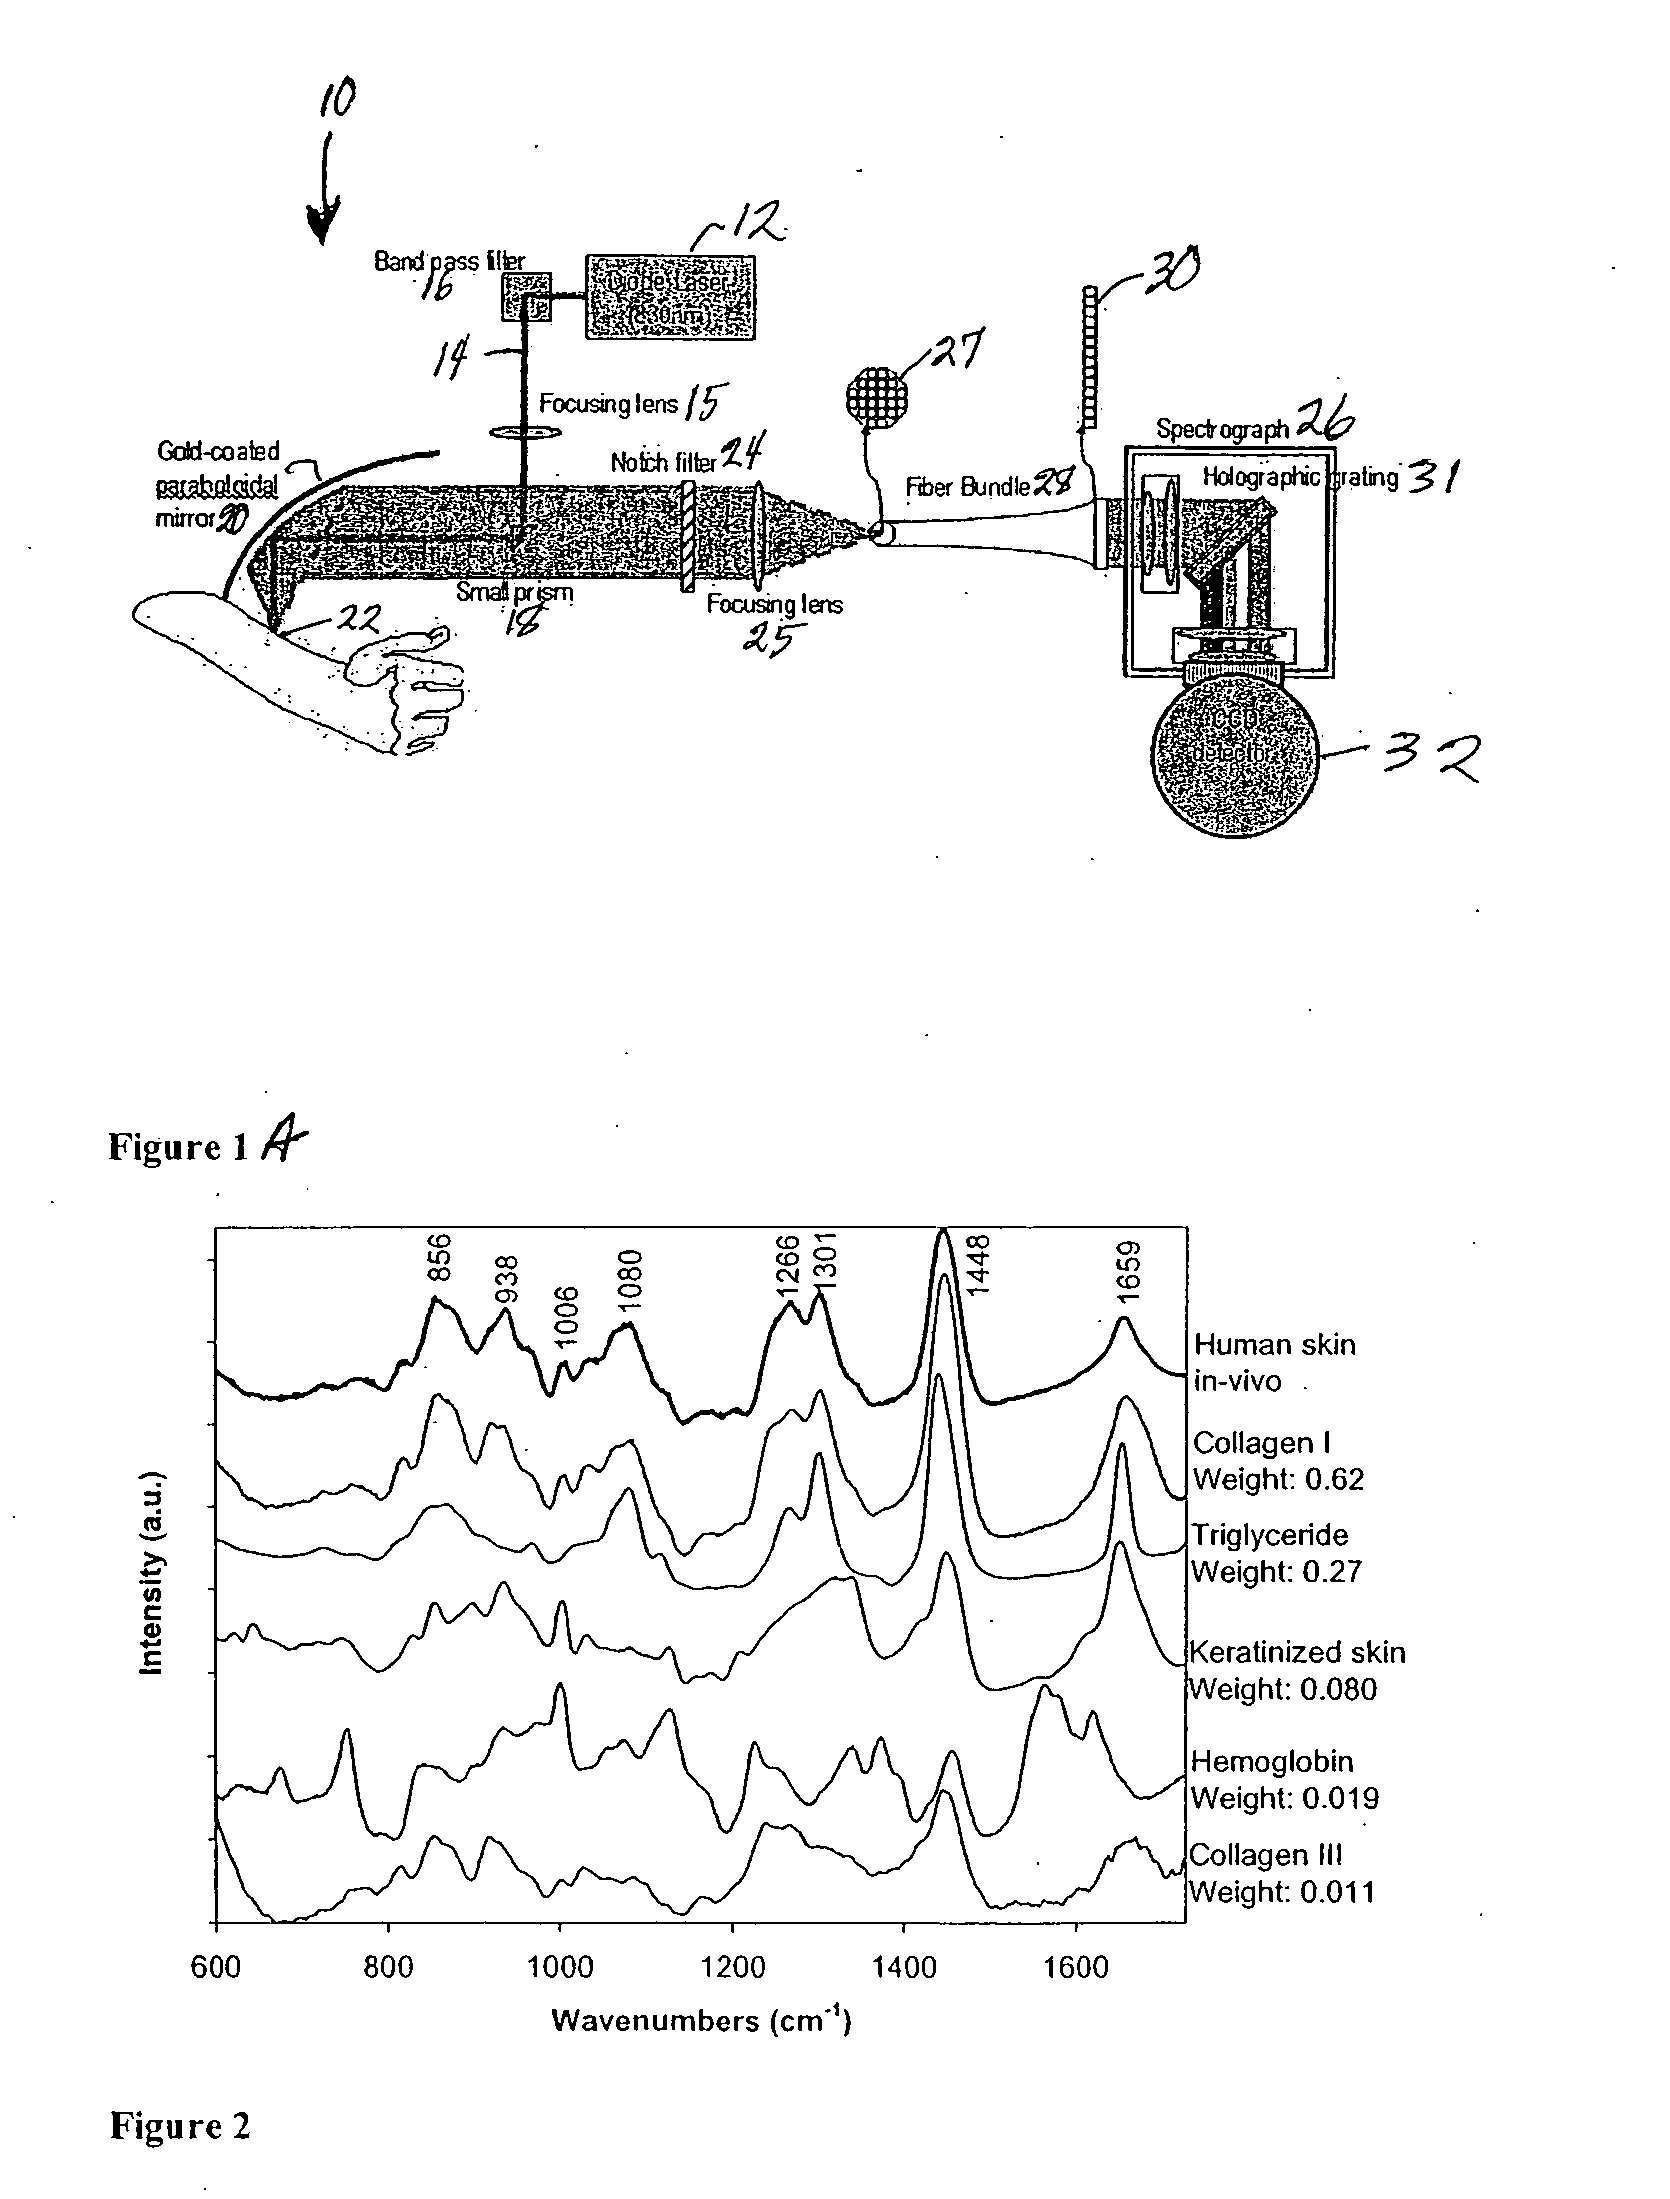
[0020] Raman spectra were obtained using a system to collect Raman light emitted from the skin of a patient with high efficiency. The system shown in FIG. 1A used a light source 12 such as a 830 nm diode laser (PI-ECL-830-500, Process Instruments, Salt Lake City, Utah) as the Raman excitation source. The beam 14 was passed through a bandpass filter 16 (Kaiser Optical Systems, Ann Arbor, Mich.), directed toward a paraboloidal mirror 20 (Perkin Elmer, Azusa, Calif.) by means of a lens 15 and a small prism 18, and focused onto the forearm 22 of a human subject with an average power of 300 mW and a spot area of ˜1 mm2. Backscattered Raman light was collected by the mirror 20 and passed through a notch filter 24 (Super Notch Plus, Kaiser Optical) to reject the backscattered Rayleigh peak and the specular reflection at 830 nm. The filtered light was transferred to a spectrometer (Holospec f / 1.4i or f / 1.8i, Kaiser Optical) by means of a lens 25 and an optical fiber bundle 28 (Romack Fiber ...


PUM


Abstract

The present invention relates to the use of Raman spectroscopy for quantitative, non-invasive transcutaneous measurement of blood analytes, such as glucose. Raman spectroscopy is used to measure glucose transcutaneously, in patients whose blood glucose levels were monitored. Raman spectra were collected transcutaneously along with glucose reference values provided by standard capillary blood analysis. A partial least squares calibration was created from the data from each subject and validated using leave-one-out cross validation.

Description

CROSS REFERENCE TO RELATED APPLICATIONS [0001] This application claims the priority of U.S. Provisional Application No. 60 / 675,252, filed Apr. 27, 2005, the whole of which is hereby incorporated by reference herein.BACKGROUND OF THE INVENTION [0002] It is estimated that the number of people afflicted with diabetes will increase by 46% worldwide from 2000 to 2010. There are many long-term complications, the most significant being cardiovascular, retinal, renal and neuropathic. The control of blood glucose levels, which currently entails frequent blood sampling, significantly delays occurrence of these complications, resulting in improved quality of life and reduced burden on the health care system. Conventional blood sampling methods are painful and have other undesirable features. Non-invasive (“transcutaneous”) blood sampling methods are an attractive alternative for monitoring glucose, as well as other blood analytes. Of the in vivo measurements reported for a variety of non-invas...

Claims


Application Information

Patent Timeline
IPC IPC(8): A61B5/00
CPCA61B5/14532G01N21/65A61B5/1455
Inventor HUNTER, MARTINENEJDER, ANNIKASCECINA, THOMASFELD, MICHAELSHIH, WEI-CHUAN
Owner MASSACHUSETTS INST OF TECH
Learn More