Complications, however, may result from use of the necessary effective radiation
dose due to damage to
healthy tissue which surrounds the target or to other healthy
body organs located close to the target.
If the effective radiation dose is not delivered to the proper location within the patient, serious complications may result.
In inverse planning, the optimization
software explores a multitude of possibilities for the beam settings so that computational complexity (calculation time) is critical.
Thus, both algorithms are computationally very expensive.
Due to the enormous amount of point dose calculations required to optimize a plan, use of the Monte Carlo method, without modification, will remain impractical for inverse planning.
Accordingly, neither the Monte Carlo nor superposition /
convolution methods can compute dose to a point with constant time computational complexity.
Full
simulation cannot be employed for each of the multitude of candidates.
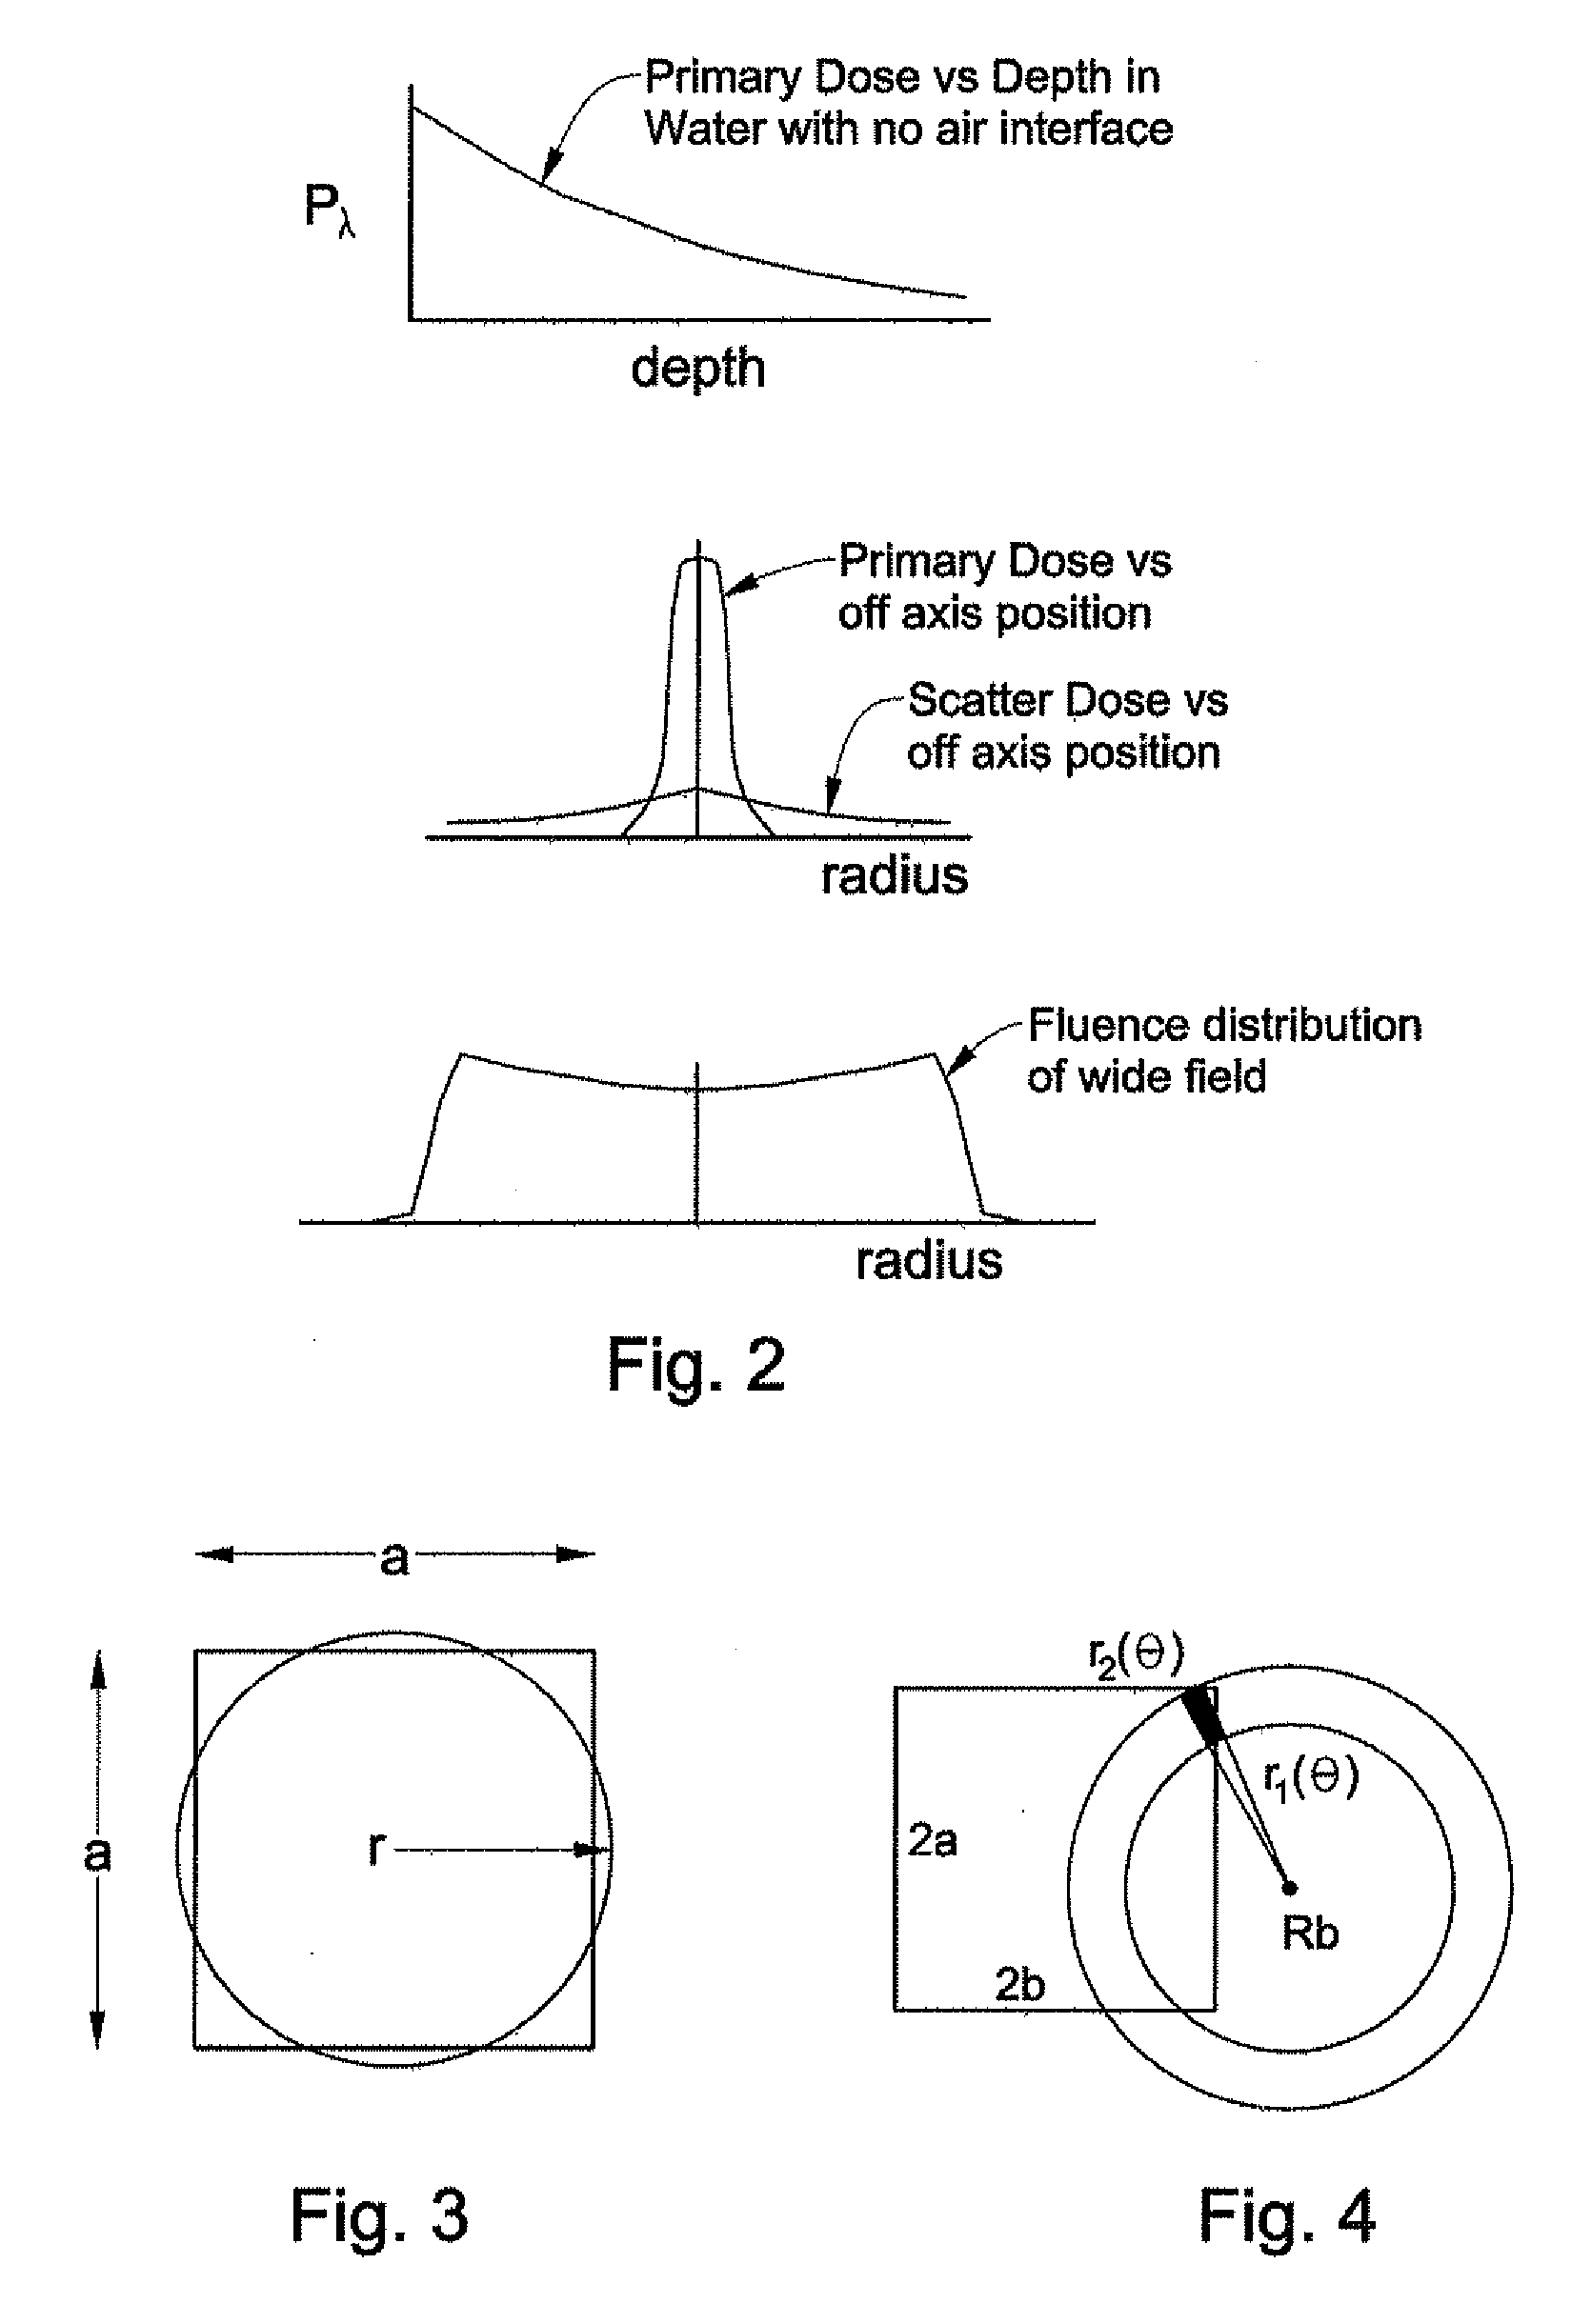
This method, however, has significant inaccuracies in regions of lateral disequilibrium such as for a
narrow beam passing through the
lung or other region of
electron density below that of water as in Nizin, “Electronic Equilibrium and Primary
Dose in Collimated
Photon Beams,” Med. Phys. 20, p.
This method also has significant inaccuracies in media having lateral heterogeneities whereby the beam experiences a variation in
electron density across the beam front at a given depth.
These inaccuracies typically separately result in an overestimate of central axis dose in the lower
electron density portion.
Further, this method has significant inaccuracies in media having a complex
electron density distribution such as the
human body because it does not adequately account for multiple build-up and build-down regions characteristic of media having a complex
electron density distribution.
For complex media, such restriction typically results in an overestimate of central axis dose in points or regions having an electron density other than that of water, particularly with respect to narrow or high-energy beam fields.
Many such efforts, however, assumed the beam was passing through a slab geometry phantom where the electron densities did not vary in a fully three-dimensional manner.
Such attempts to improve the traditional pencil beam method, however, only account for part of the effect of the heterogeneous media through an effective
path length by adding up the electron densities at all the points between the
skin and the depth of interest.
Nor do they address the effects of the complex
electron distribution resulting in continuous density changes, and thus, continuous build-up / build-down.
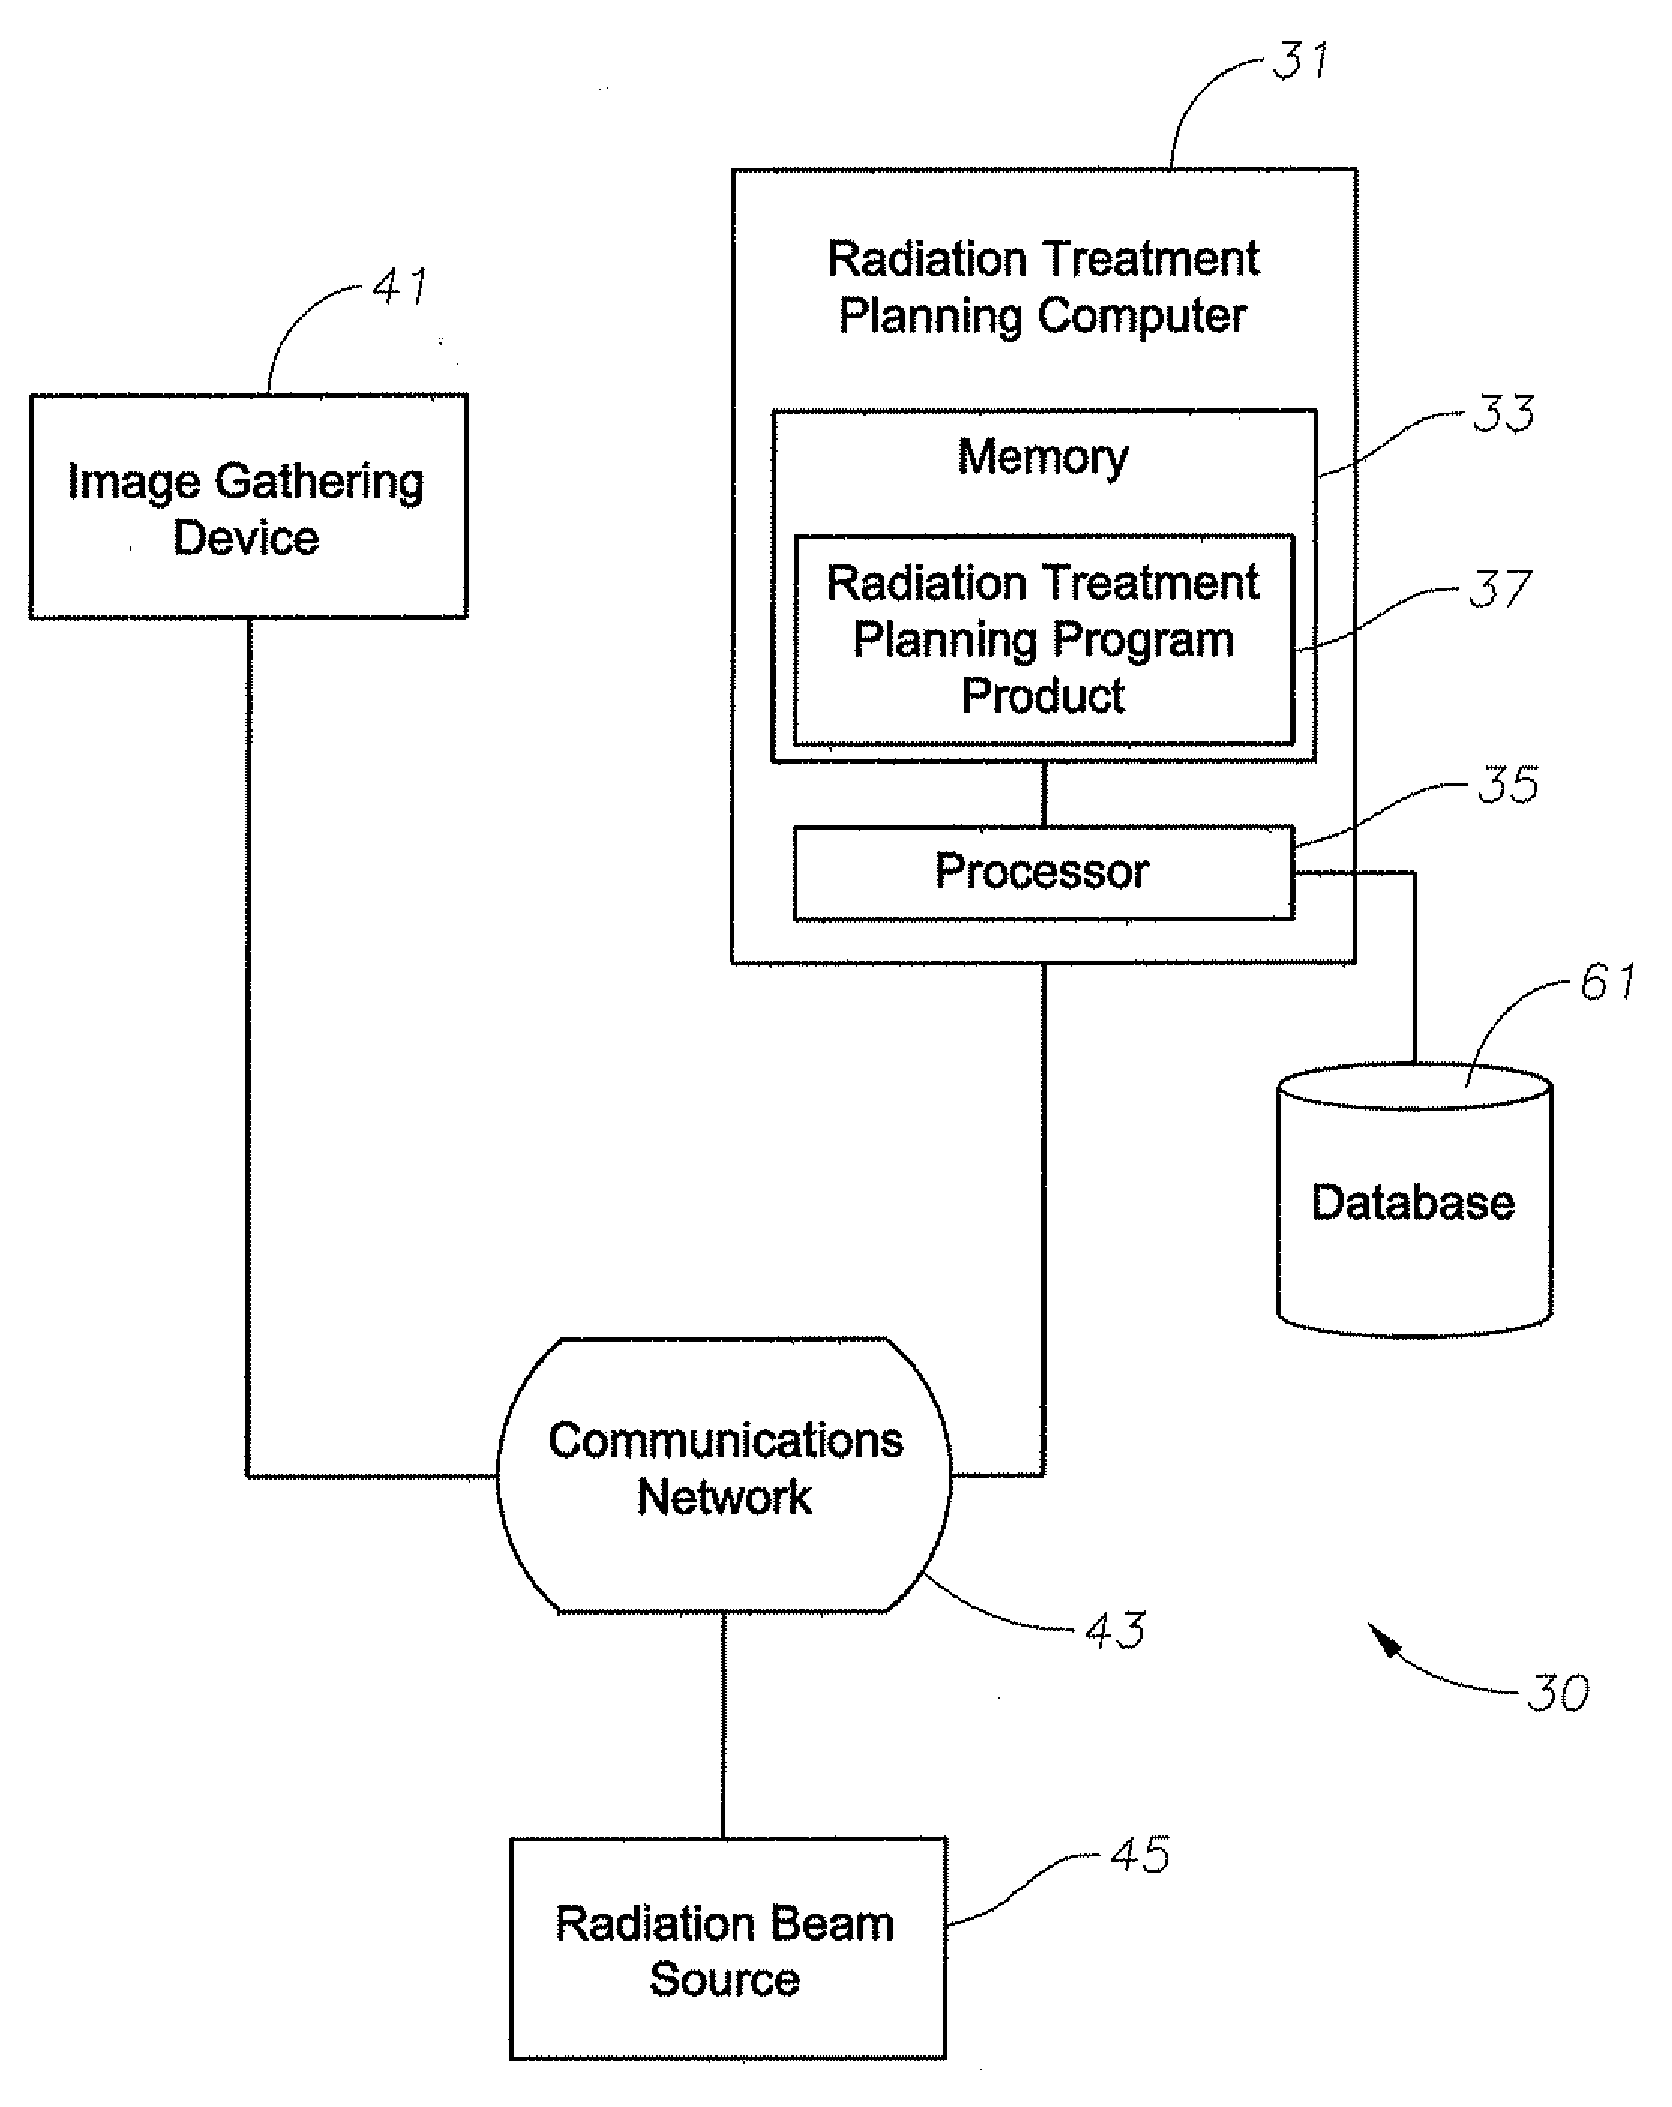
Recognized by the Applicants is that the points of interest used for optimization must be pre-selected rather than arbitrarily placed, that calculating dose at a point of interest that was not preselected would require a complete Monte Carlo
simulation, and that this avenue does not provide a system or a method of updating an arbitrary 2d image profiles in real-time.
If the actual dose is not correct, the result can be under-treating the target tumor or
lesion and / or damaging healthy surrounding tissue and organs.

