Bioinformatic Approach to Disease Diagnosis

a bioinformatics and disease technology, applied in the field of multivariate predictive models, can solve the problems of low sensitivity, low specificity, and high risk of false positives, and achieve the effects of reducing errors, maximizing predictive power, and high specificity

Active Publication Date: 2008-03-13
PORWANCHER RICHARD
View PDF0 Cites 20 Cited by
  • Summary
  • Abstract
  • Description
  • Claims
  • Application Information

AI Technical Summary

Benefits of technology

[0037] The inventive method reduces error because specificity requirements are satisfied; this requirement is particularly important for LD because of overdiagnosis and overtreatment for false-positive results. When the disease is LD, the tests chosen by the proposed method may be employed by the algorithm described in U.S. Pat. No. 6,665,652 after being dichotomized. Alternatively, these tests can be directly utilized by new methodologies for LD prediction.
[0038] Alternative multivariate methods, including but not limited to logistic regression, log-likelihood regression, linear regression, and discriminant analysis, can learn which features are optimal from ROC regression methods. The learning process is particularly valuable for diseases where high specificity is needed. These alternative methods cannot focus their regression methodology on a portion of the ROC curve. By learning the optimal test choices, they can rerun the regression analysis using these specific variables, thus maximizing their predictive power.

Problems solved by technology

Direct cultures of tissue or body fluids are possible, but suffer from low sensitivity.
Performing skin biopsies is unnecessary under most circumstances because a well-trained physician can usually diagnose the characteristic rash, erythema migrans, by visual inspection alone.
All serological methods may lead to false-positive results; however the most common test for B. burgdorferi antibody, the whole-cell EIA, is particularly susceptible to false-positive results.
Most antibody methods are insensitive early in the disease (<4 weeks), but become more sensitive after the first few weeks have passed.
This lack of sensitivity for early disease and a high rate of false-positive serology have undermined public confidence in the two-step process.
This trade-off between sensitivity and specificity is a well recognized limitation in diagnostic testing.
The improved specificity of the two-step method is offset by limited sensitivity.
However, each new component also has its own intrinsic rate of false-positive reactions.
By limiting the choice of antigens and not weighting the ones that are included, this method compromises test performance.
Failing to weight the importance of individual bands might have led to requiring an excessive number of bands to confirm disease, thus limiting sensitivity.
Band results reported in binary fashion were used to create a quantitative rule; however, no likelihood ratios were reported from this regression technique, no partial ROC areas were maximized using the logistic method [as in McIntosh and Pepe (2002)], there were no specificity goals for ROC areas, and there was no attempt to utilize clinical information.
However Robertson et al. did not produce a quantitative rule as a consequence of utilizing multiple Western blot bands.
In the end, the purported rules developed by logistic regression were no better than pre-existing interpretive criteria.
Their failure to quantify their results severely limited its use.
While a predictive rule could be generated, its performance was unclear because the epidemiological data was poorly utilized.
As demonstrated above, the LD field is limited by the lack of a theoretical basis for test strategy.
There has been remarkably little work done using multivariate analysis and Lyme disease.
The cost associated with false-negative results is the difference in regret between those with false-negative and true-positive serology, for which the increased personal, economic, and social cost of delaying disease treatment are factors.
The cost associated with false-positive results is the difference in regret between those with false-positive and true-negative serology, for which the personal, economic, and social costs of administering the powerful intravenous antibiotics to healthy patients are all factors.

Method used


Image

  • Bioinformatic Approach to Disease Diagnosis
  • Bioinformatic Approach to Disease Diagnosis
  • Bioinformatic Approach to Disease Diagnosis

Examples


example

[0058] Studies that generated the current predictive models are described below.

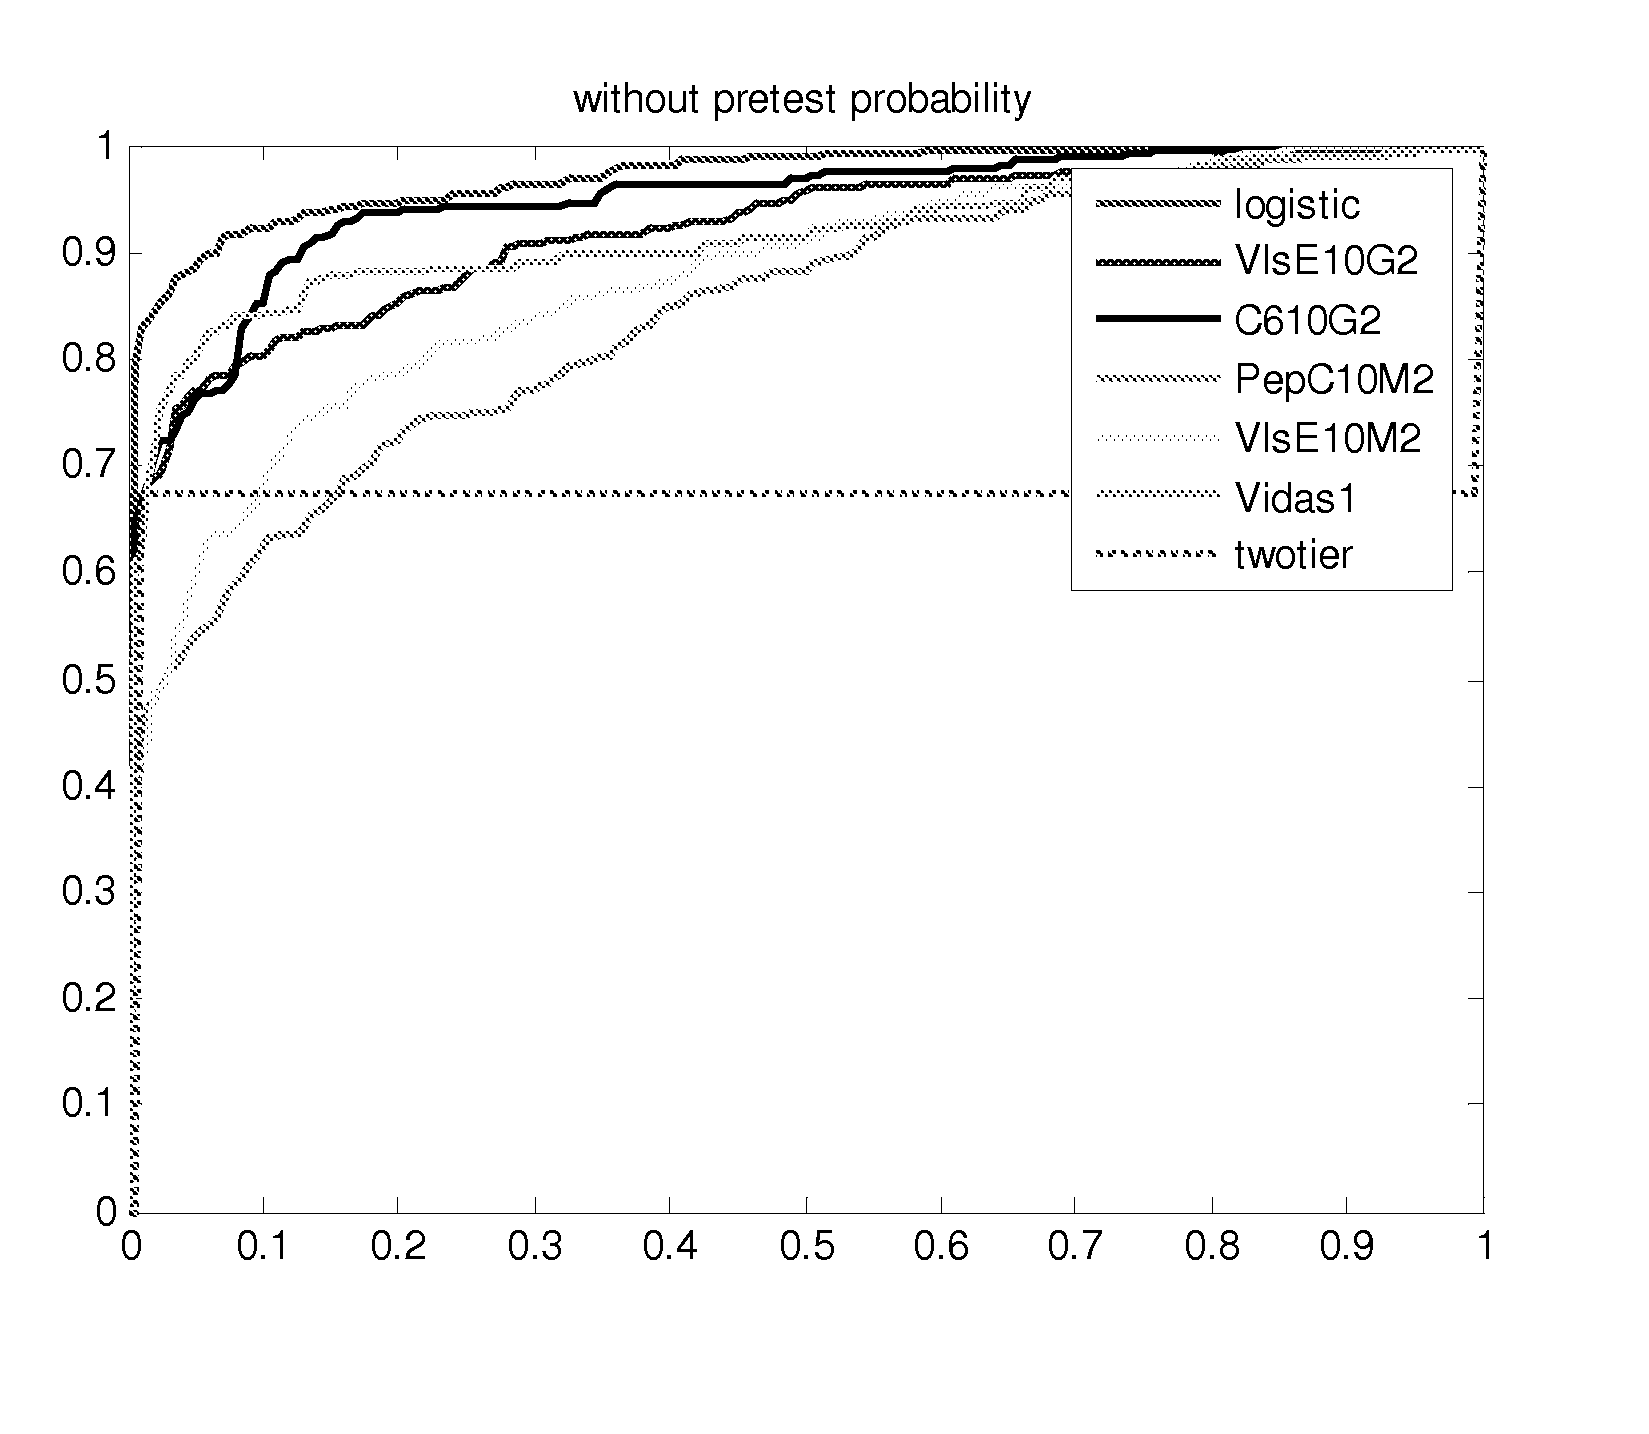
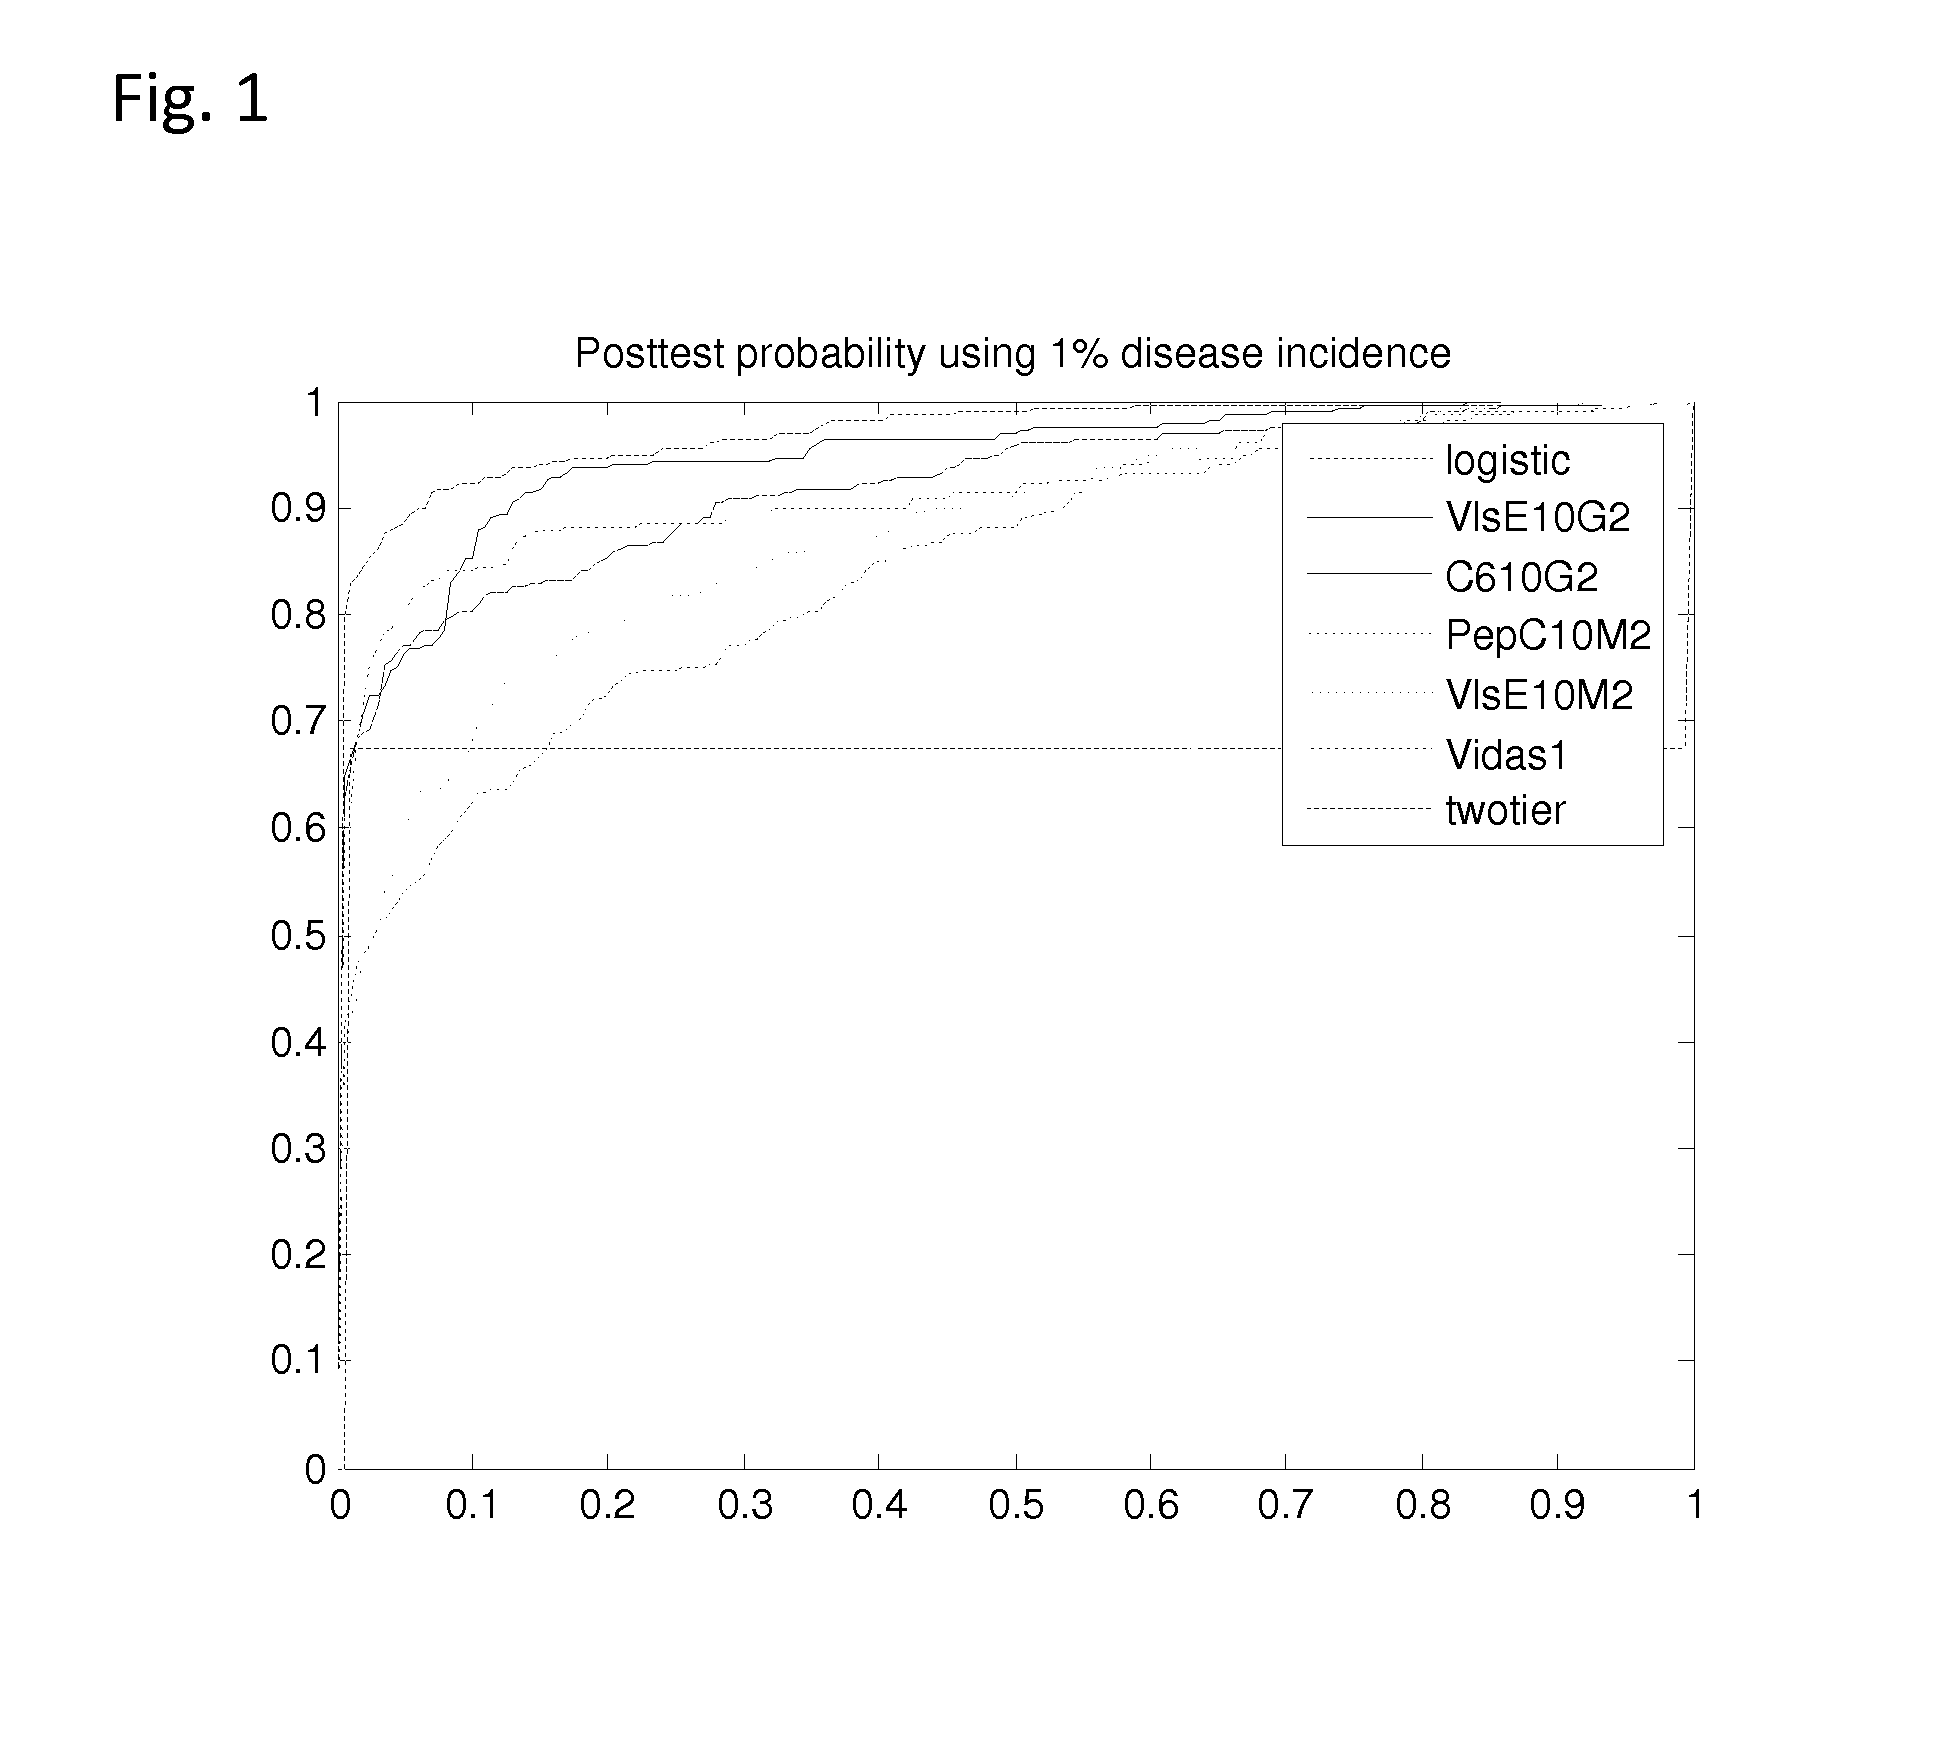
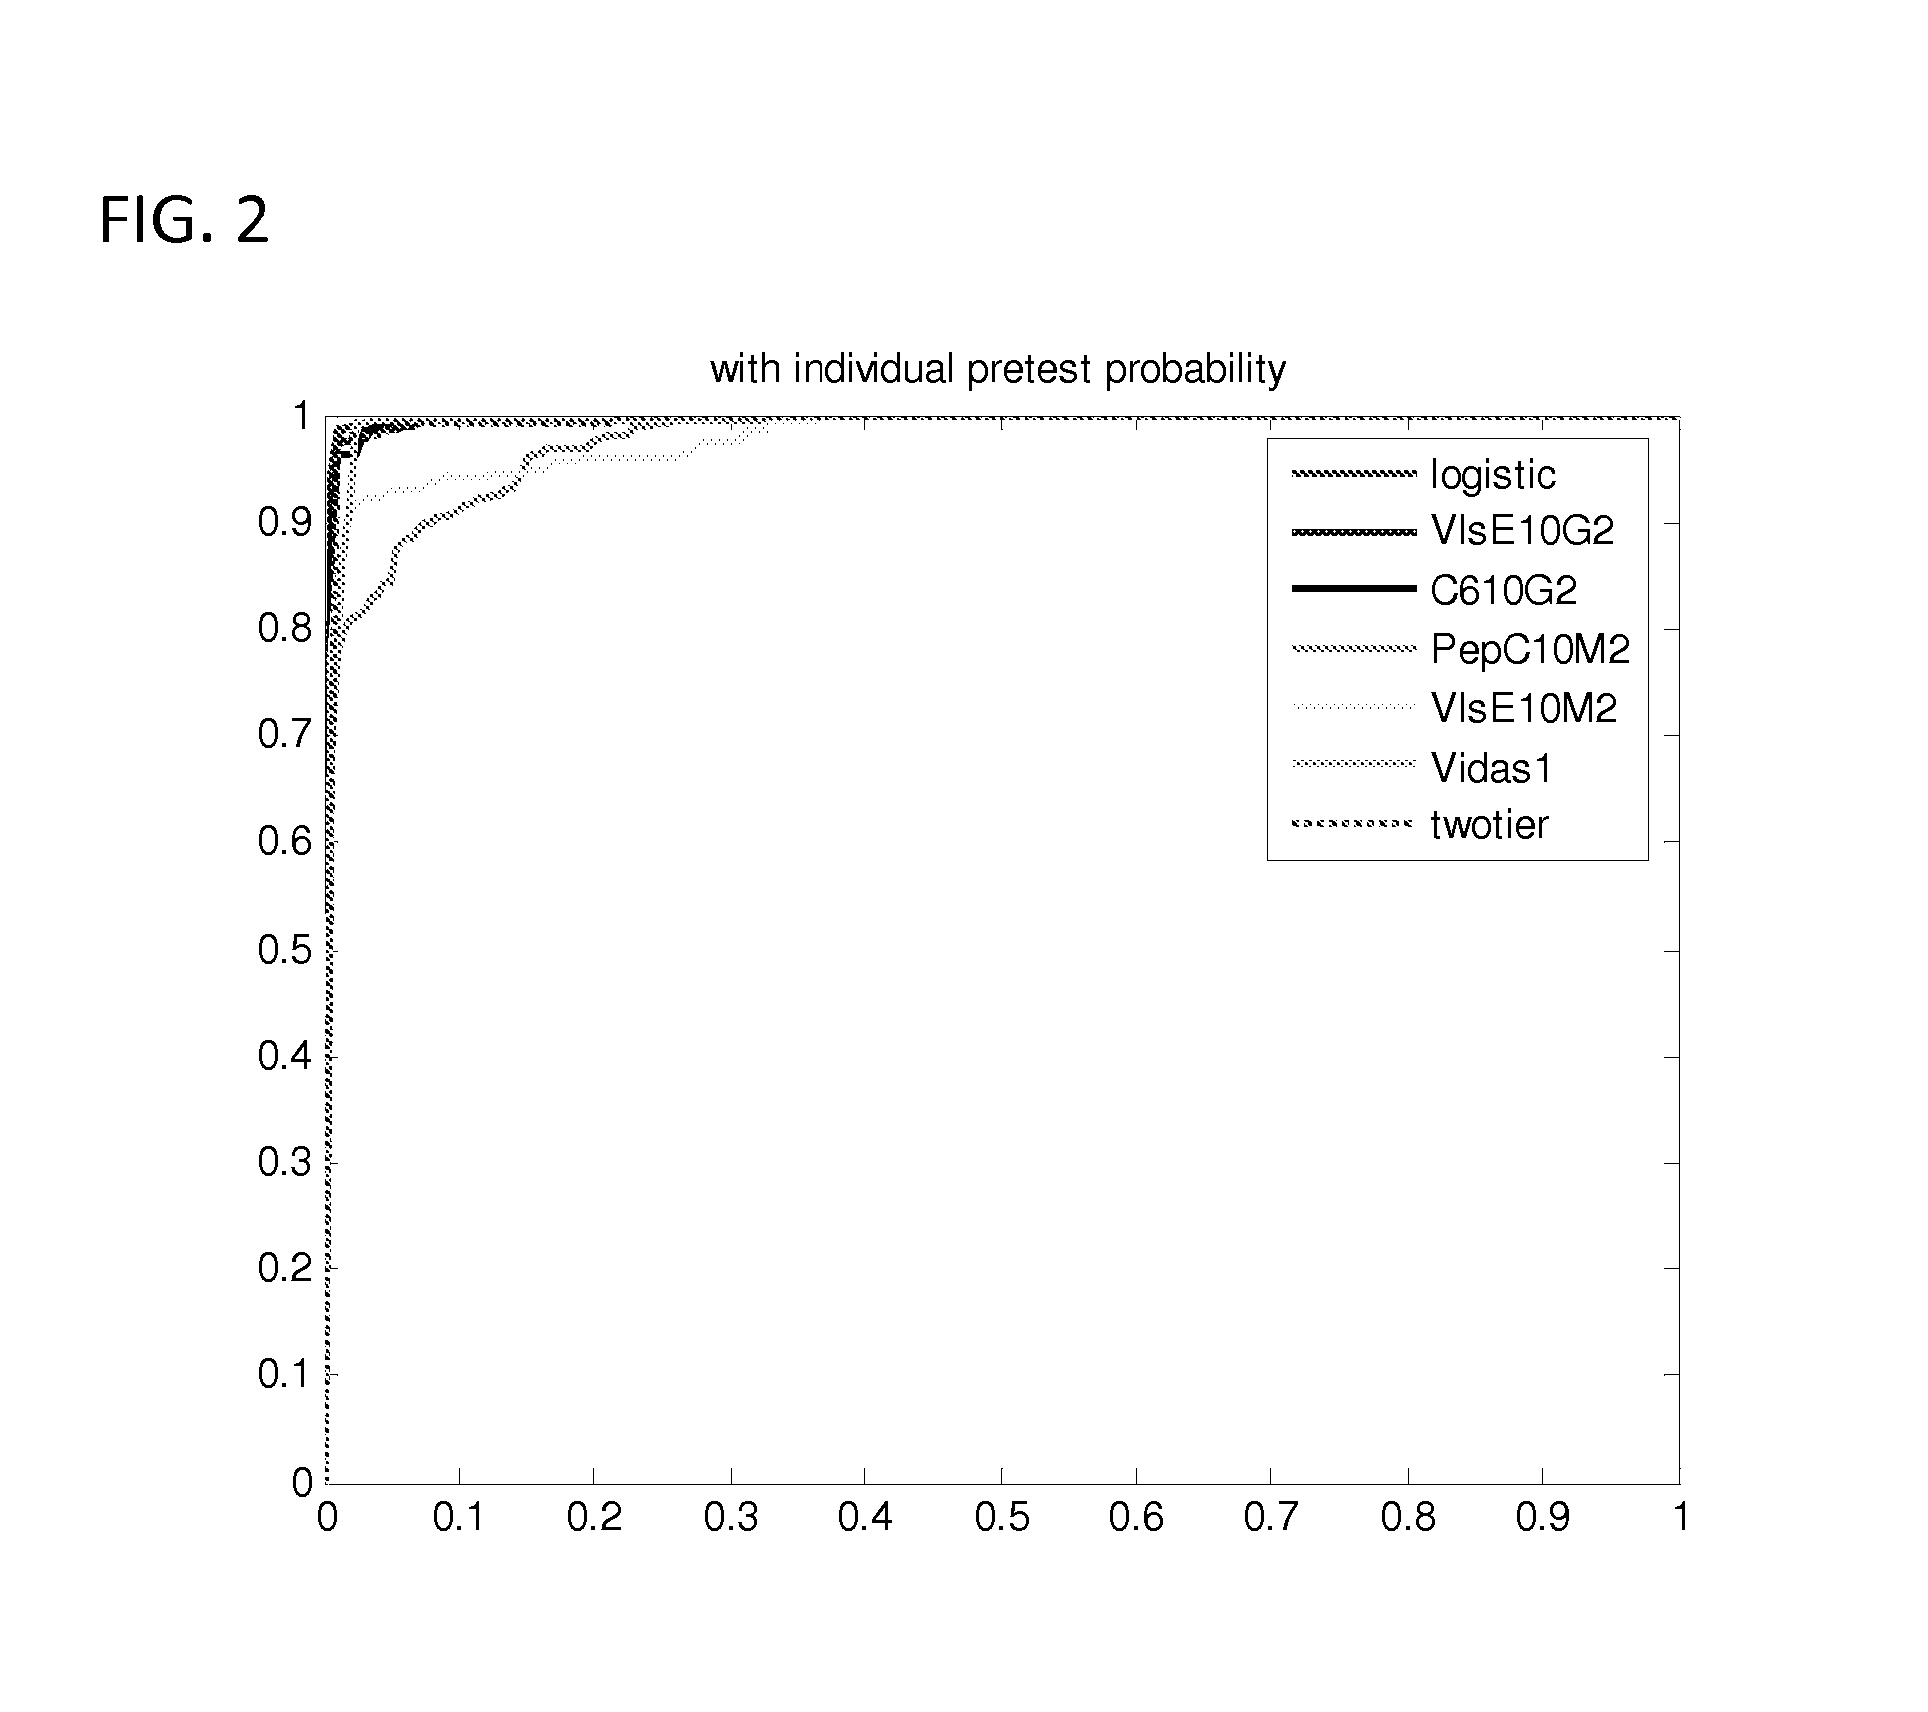
[0059] The prior probability of LD is related to the prevalence of LD in the community and was set at 1% (Nichol et al., Ann. Intern. Med., 128(1), 37-48 (1998); Goodman and Sonenshine (eds.), Tick-Borne Diseases of Humans, (ASM Press, Washington, D.C. (2005)). A clinical algorithm to determine the pretest probability of LD, given a patient's clinical signs and symptoms in an endemic area, will be discussed below.

[0060] Partial ROC regression and logistic regression analyses were performed on a CDC database of LD patients (n=280) and controls (n=559). In order to combine multiple diagnostic tests, a linear combination of test results was used to create a score function. In this case the score for each patient was a likelihood ratio (LR) based on their individual test results. The empiric AUC was approximated for the (1−t0) quantile of patients without LD, where t0 represents the maximum acceptable fals...


PUM

PropertyMeasurementUnit
areaaaaaaaaaaa
weightaaaaaaaaaa
βaaaaaaaaaa

Abstract

Methods for constructing multivariate predictive models for diagnosing diseases for which test methods are individually inadequate, including: (a) performing laboratory tests on a statistically significant test population of individuals; (b) generating a score function from a linear combination of test panel results;
    • (c) performing a receiver operating characteristic (ROC) regression or alternative regression technique of the score function using those tests and β coefficients calculated simultaneously to maximize the area under the curve (AUC) of the function and chosen simultaneously to generate the largest area below that portion of the ROC curve for the (1−t0) quantile of individuals without disease, where t0 represents the maximum acceptable false-positive rate; (d) calculating individual pre-test disease odds; generating a diagnostic likelihood ratio of disease by determining the frequency of each individual's test score in the diseased population relative to the control population; and multiplying pre-test odds by the likelihood ratio to determine individual post-test disease odds; (e) converting a set of posttest odds into posttest probabilities for each potential multivariate methodology and creating an ROC curve for each methodology by altering posttest probability cutoff values; (f) comparing partial ROC areas generated by one or more regression techniques to determine the optimal methodology; and (g) dichotomizing the optimal methodology by finding that point on the ROC curve tangent to a line with slope (1−p) C/p·B, where p is population prevalence of disease, B is regret associated with failing to treat patients with disease and C is regret associated with treating a patient without disease.

Description

CROSS-REFERENCE TO RELATED APPLICATION [0001] The present application claims priority benefit under 35 U.S.C. §119(e) of U.S. Provisional Patent Application Ser. No. 60 / 824,980 filed Sep. 8, 2006, the disclosure of which is incorporated herein by reference.BACKGROUND OF THE INVENTION [0002] The present invention relates to methods for constructing multivariate predictive models to diagnose diseases for which current test methods are considered inadequate in either sensitivity or specificity. In particular, the present invention relates to predictive models for diagnosing diseases with a combination of laboratory tests, generating specificities of at least 80%. [0003] More particularly, the present invention relates to the construction of a multivariate predictive model for diagnosing Lyme disease (LD) by choosing the best tests from among those currently available, utilizing the raw data produced by these tests instead of the manufacturers' binary test results, combining the test va...

Claims


Application Information

Patent Timeline
Patent Type & Authority Applications(United States)
IPC IPC(8): G06G7/48G01N33/53G01N33/563G16B20/00G16B40/00
CPCG06F19/18G06F19/3437G06F19/24G16H50/50G16B20/00G16B40/00Y02A90/10G16H50/20
Inventor PORWANCHER, RICHARD
Owner PORWANCHER RICHARD
Why Eureka
Try Eureka