
Method and test for blood serum component analysis

Active Publication Date: 2008-06-26
NAT RES COUNCIL OF CANADA
View PDF2 Cites 11 Cited by
  • Summary
  • Abstract
  • Description
  • Claims
  • Application Information

AI Technical Summary

Benefits of technology

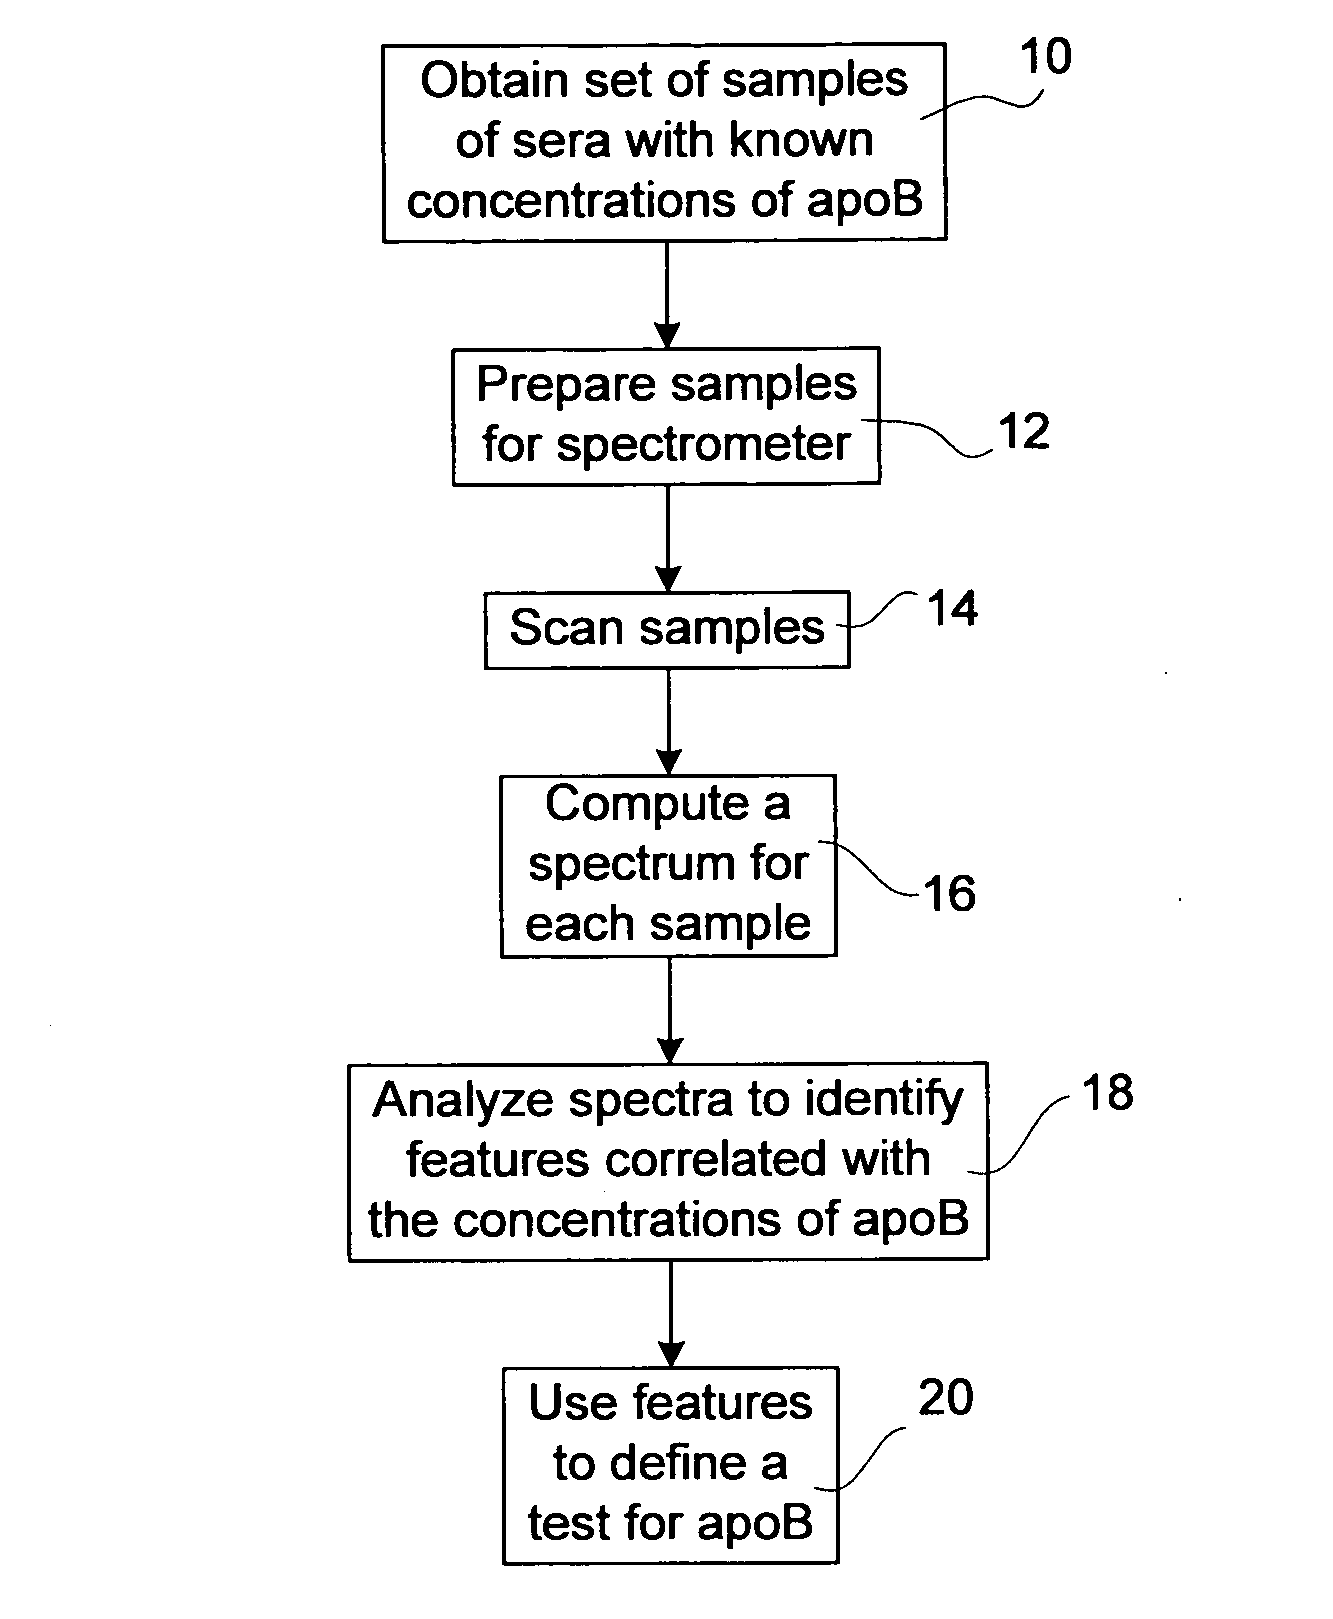
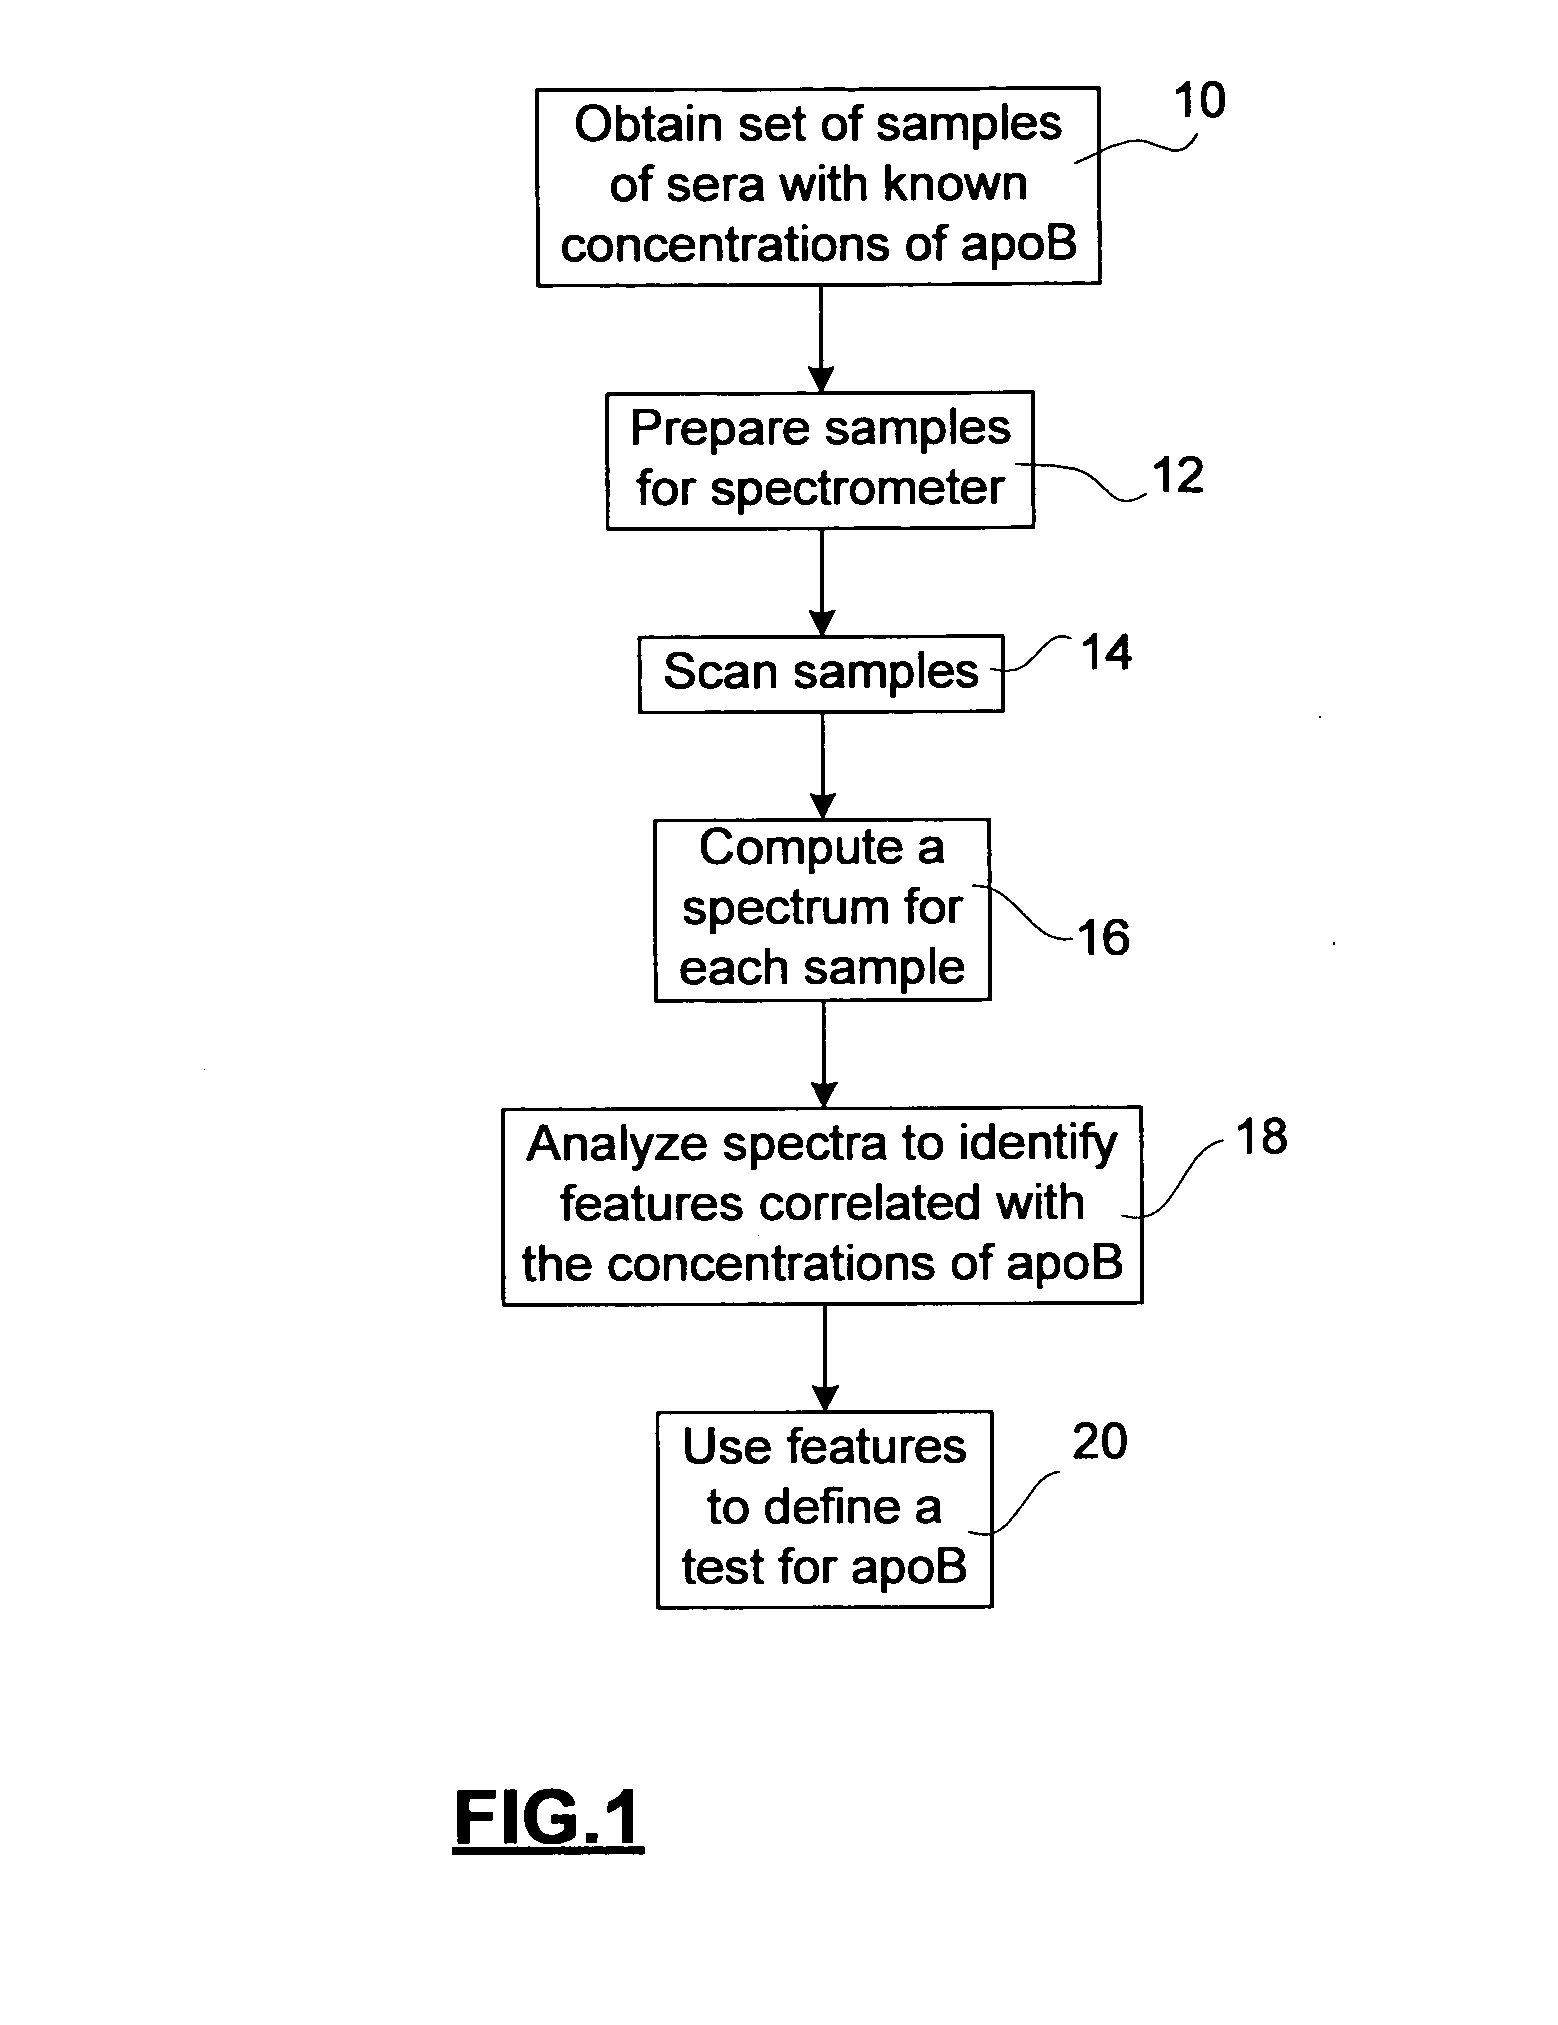
[0023]Further aspects of the invention are provided in terms of tests produced by the method above. As will be appreciated by those of skill in the art, the test may include an operator that is applied to a test spectral representation and an argument, such as the regression coefficient vector if the PLS algorithm is used for computing the statistical correlation. The test may be encoded on computer readable program instructions, and may be associated with instructions for obtaining the test spectral representation of the test sample. Preferably these instructions effectively reproduce the method of obtaining the mid infrared spectral representations for the blood serum samples from the set to minimize systematic error. The computer readable program instructions may comprise program instructions for implementing the test of the test spectral representation, or may comprise program instructions for producing the test spectral representation from collected light from the test blood serum sample. The test may further be associated with a spectrometer used for collecting the infrared light.

Problems solved by technology

Accordingly, the central challenge is to identify those who are at risk.
While there are numerous ways that apoB can be detected according to the prior art (e.g. electroimmunoassay, radial immunodiffusion, radioimmunoassay enzyme-linked immuno-sorbent assays, nephelometric assays and turbidimetric assays), each of these methods has their own drawbacks that are known in the art.
None of these methods has proven easy and cost effective to automate for mass screening.
Some of the drawbacks include the requirement for a large volume of antisera, inherent disadvantages of the use of radioactivity, and matrix effect problems (i.e. problems with interferences caused by other components in the serum).
Naturally a method that analyses sera optically is relatively unconstrained, as the test can be applied on a sample whenever a spectrometer and processor time are available.
These other fluids have shelf-lives and require procedures that are more time consuming, expensive, and difficult to automate.
Nonetheless, IR spectroscopy cannot be reliably used to detect many serum analytes, for example, because they are present in such low concentrations that they do not contribute meaningfully to the infrared spectrum, or because the mid-infrared absorption pattern closely resembles that of one or more components of similar or higher concentration.
Although this concentration range lies above the 0.1 g / L uncertainty level typical of glucose, urea, and cholesterol, the attempt to develop an IR-based assay failed.

Method used


Image

  • Method and test for blood serum component analysis
  • Method and test for blood serum component analysis
  • Method and test for blood serum component analysis

Examples


examples

Materials

[0051]A total of 366 anonymized human serum samples, collected in serum separator tubes, (Becton Dickinson Vacutainer Systems, Franklin Lakes, N.J.) were obtained from the Winnipeg Health Science Centre clinical chemistry laboratory. The corresponding apoB concentrations were determined in the same laboratory by an immunoturbidimetric method, and provided together with the samples. Standard LDL was obtained from Sigma-Aldrich Corp., St. Louis, Mo.

Methods:

[0052]Samples were prepared for spectroscopic measurements by drying duplicate 2 μl serum aliquots under ambient conditions onto a silicon wafer divided into 96 circular wells (each of 5 mm diameter) by an adhesive plastic mask. Infrared spectra of such films were recorded with a Bruker Vector 22 spectrometer (Bruker Optics, Billerica, Mass.) equipped with a HTS (High Throughput Sampling) accessory and a home-built wafer mount. The HTS accessory allows for the automated sequential acquisition of spectra for 95 films (and on...


PUM


Abstract

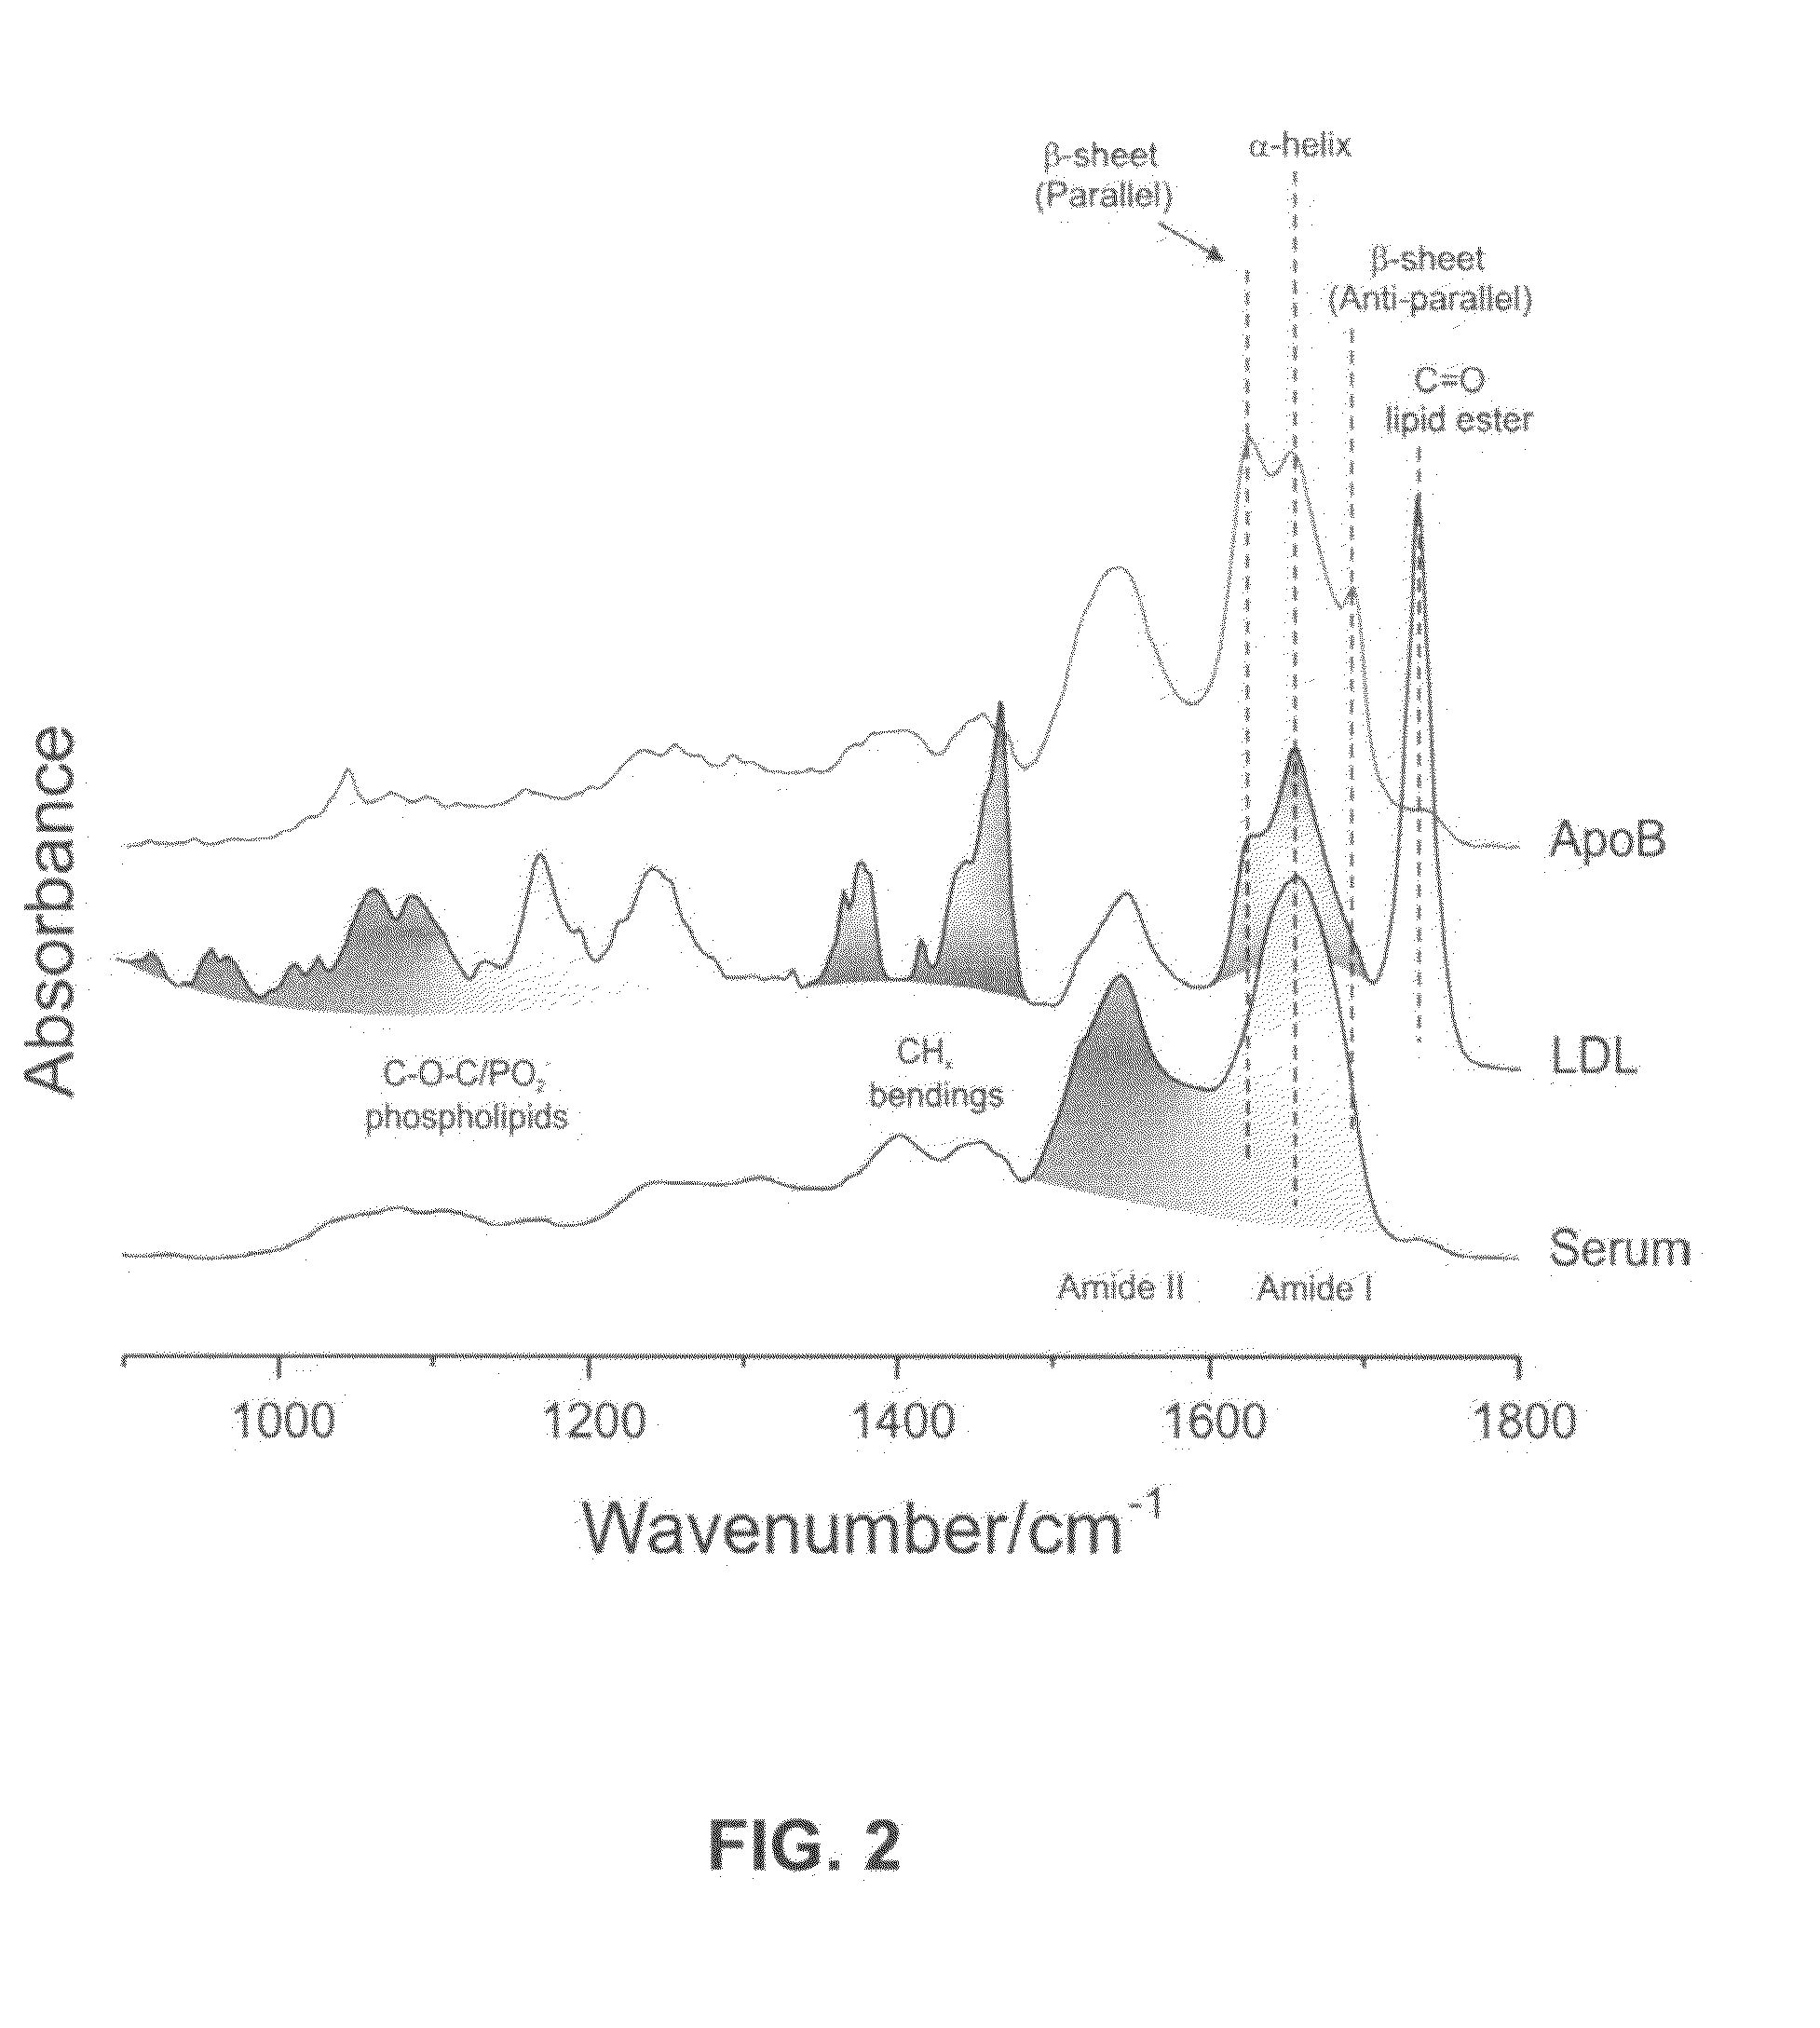
The discovery that apolipoprotein B exhibits spectral features in the mid IR spectrum that make it identifiable within blood serum leads to the invented use of a statistical correlation between a concentration of apolipoprotein-B (apoB) in a sample of blood serum and infrared spectral features of the blood serum sample to produce a test for apoB. A method for providing such a test, and tests produced by the method are taught.

Description

CROSS-REFERENCE TO RELATED APPLICATION[0001]This application claims the benefit of U.S. provisional application No. 60 / 874,677, filed Dec. 14, 2006, the entire content of which is hereby incorporated by reference.FIELD OF THE INVENTION[0002]This invention pertains in general to the field of blood analysis, and, in particular, to the spectroscopic analysis of serum components.BACKGROUND OF THE INVENTION[0003]Cardiovascular disease remains a leading cause of death in North America and Western Europe, with atherosclerosis being the principal cause. It has long been recognized that cholesterol plays a role in the formation of atherosclerotic plaques. The encouraging news, however, is that there are very effective interventions for those at risk of cardiovascular disease. Accordingly, the central challenge is to identify those who are at risk. Of all the factors that are commonly measured to gauge elevated risk, the single most effective indicator is serum low density lipoprotein (LDL) (...

Claims


Application Information

Patent Timeline
IPC IPC(8): G01N33/92G01N31/00
CPCG01N33/92G01N21/35G01N2333/775
Inventor LIU, KAN-ZHISHAW, ANTHONY
Owner NAT RES COUNCIL OF CANADA
Learn More