Thyroglobulin quantitation by mass spectrometry

a mass spectrometry and thyroglobulin technology, applied in the field of thyroglobulin quantitation, can solve the problems of hook effect, particularly troubling interference attributable to tg antibodies, variability in interassay sensitivity and precision, etc., and achieve the effect of improving the removal of solven

Active Publication Date: 2009-06-11
QUEST DIAGNOSTICS INVESTMENTS INC
View PDF11 Cites 25 Cited by
  • Summary
  • Abstract
  • Description
  • Claims
  • Application Information

AI Technical Summary

Benefits of technology

[0035]As used herein, the term “electrospray ionization” or “ESI,” refers to methods in which a solution is passed along a short length of capillary tube, to the end of which is applied a high positive or negative electric potential. Solution reaching the end of the tube is vaporized (nebulized) into a jet or spray of very small droplets of solution in solvent vapor. This mist of droplets flows through an evaporation chamber, which is heated slightly to prevent condensation and to evaporate solvent. As the droplets get smaller the electrical surface charge density increases until such time that the natural repulsion between like charges causes ions as well as neutral molecules to be released.
[0036]As used herein, the term “atmospheric pressure chemical ionization” or “APCI,” refers to mass spectroscopy methods that are similar to ESI; however, APCI produces ions by ion-molecule reactions that occur within a plasma at atmospheric pressure. The plasma is maintained by an electric discharge between the spray capillary and a counter electrode. Then ions are typically extracted into the mass analyzer by use of a set of differentially pumped skimmer stages. A counterflow of dry and preheated N2 gas may be used to improve removal of solvent. The gas-phase ionization in APCI can be more effective than ESI for analyzing less-polar species.

Problems solved by technology

These methods are all subject to methodological problems such as differences in standardization, variability in interassay sensitivity and precision, hook effects, and interference attributable to Tg antibodies.
The problem of interference attributable to Tg antibodies is particularly troubling for clinical application of monitoring Tg levels as a tumor marker because up to 20% of thyroid cancer patients have Tg autoantibodies.

Method used


Image

  • Thyroglobulin quantitation by mass spectrometry
  • Thyroglobulin quantitation by mass spectrometry
  • Thyroglobulin quantitation by mass spectrometry

Examples


example 1

Demonstration of MS Quantitation of Peptide T129

[0086]Several samples with various known concentrations of peptide T129 were prepared by series dilution starting with a sample of known peptide T129 concentration. Peptide T129 LOQ and calibration curves were developed from LC-MS / MS analysis of these samples.

[0087]LC was performed with a Phenomenex analytical column (Phenomenex Corp. Luna 5μ C8 (2) 100 Å New Column 50×1.0 mm). A binary HPLC eluent composed of 0.2% formic acid in ultra pure water (HPLC grade) (mobile phase A) and 0.2% formic acid in 100% methanol (mobile phase B) was applied to the analytical column to separate selected Tg peptides from other species contained in the sample. The binary eluent was applied according to the following gradient profile: as a first step, an 80 / 20 mixture of mobile phase A / mobile phase B was applied for 120 seconds; as a second step, a 30 / 70 mixture of mobile phase A / mobile phase B was applied for 60 seconds; as a third step, the relative am...

example 2

Demonstration of Quantitation of Peptide T129 in Peptide T129 Spiked Processed, Concentrated and Digested Stripped Serum

[0093]A 500 μl sample of stripped serum (e.g., the test sample in this Example) was added atop the filter element of a commercially available 300 kDa molecular weight cut-off filter cartridge (Pall Corp. Nanosep 300 kDa, Pall Corp. Cat. No. OD300C33).

[0094]The test sample was completely filtered upon centrifugation of the cartridge at 13 kg for 6 minutes. The filtrate was removed and discarded. 500 μl of HPLC grade water was then added to the top of the filter and the cartridge was again centrifuged at 13 kg for 6 minutes. The filtrate was again removed and discarded. Next, 200 μl of 20 mM ammonium acetate was added to the top of the filter. The cartridge was again centrifuged at 13 kg for 3 minutes. The filtrate was again removed and discarded and 100 μl of 20 mM ammonium acetate was added to the top of the filter.

[0095]Then, 15 μg of trypsin (Promega Trypsin Gold...

example 3

Demonstration of Quantitation of Peptide T129 in Stripped Serum Containing Various Concentrations of Added Tg

[0100]Several 500 μl samples of stripped serum containing various concentrations of added Tg were prepared according to the procedure detailed in Example 2. LC-MS / MS of the resulting test samples was carried out following the steps detailed in Example 1.

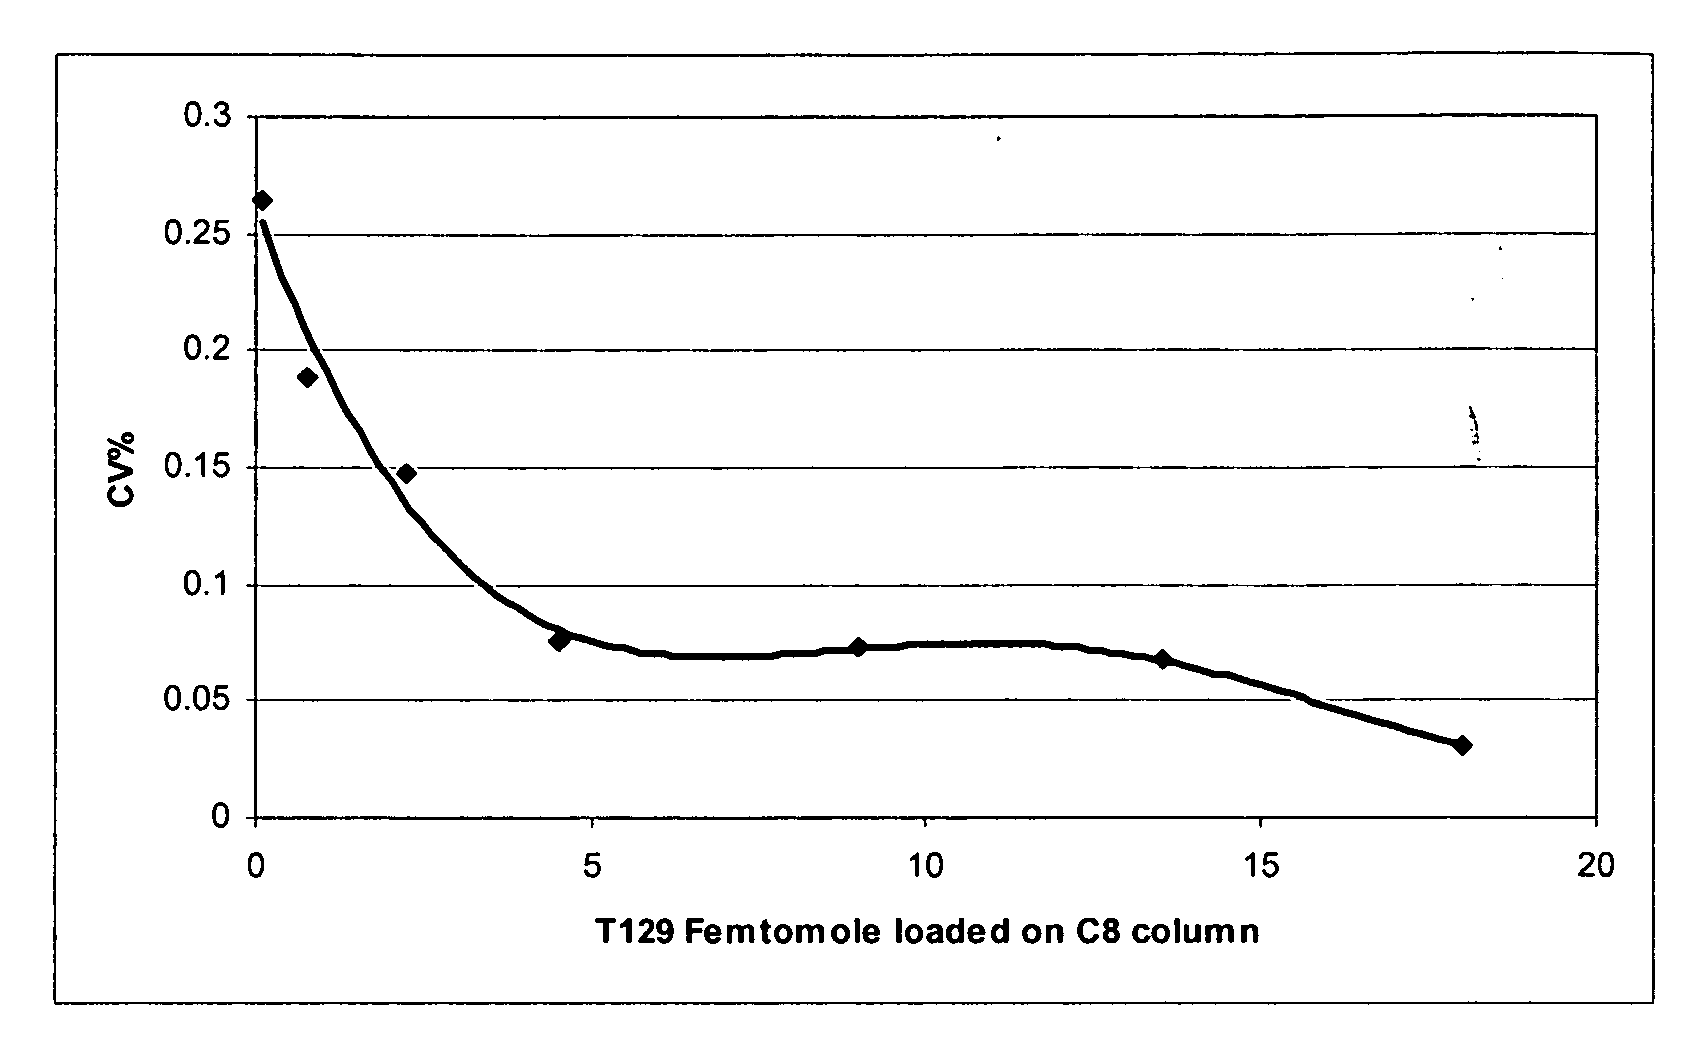
[0101]Data collected and used to develop the calibration curve found in FIG. 9 are found in Table 6.

TABLE 6Data collected and used to develop the calibration curve forpeptide T129 MS / MS in Tg spiked stripped serum(processed and condensed as described in Example 3).Femtomoles ofAverage IonTg in spikedCounts perserum sampleSecondCV (%)08784.6670.1769871.58259.50.2468334.59953.250.18658811.259696.250.2381622.513848.250.2254964518125.50.110826

[0102]The contents of the articles, patents, patent applications, and all other documents and electronically available information mentioned or cited herein, are hereby incorporated by refere...


PUM

PropertyMeasurementUnit
molecular weightaaaaaaaaaa

Abstract

Provided are methods for determining the amount of thyroglobulin in a sample using various purification steps followed by mass spectrometry. The methods generally involve purifying thyroglobulin in a test sample, digesting thyroglobulin to form peptide T129, purifying peptide T129, ionizing peptide T129, detecting the amount of peptide T129 ion generated, and relating the amount of peptide T129 ion to the amount of thyroglobulin originally present in the sample.

Description

FIELD OF THE INVENTION[0001]The invention relates to the quantitation of thyroglobulin. In a particular aspect, the invention relates to methods for quantitation of thyroglobulin by mass spectrometry.BACKGROUND OF THE INVENTION[0002]The following description of the background of the invention is provided simply as an aid in understanding the invention and is not admitted to describe or constitute prior art to the invention.[0003]Thyroglobulin, or Tg, is a large dimeric secretary glycoprotein with a molecular weight of 660 kDa comprised of noncovalently bound homodimers.[0004]Tg molecules exist in several forms. The three major Tg molecule sequences as found in the UniProt Knowledgebase (Swiss-Prot+TrEMBL) are P01266 (Human Thyroglobulin Precursor), P01266-2 (Isoform 2 of P01266), and Q59GF02 (Human Thyroglobulin Variant). (See FIGS. 1, 2, and 3, respectively.)[0005]P01266 is the major variant of P01266 with a length of 2768 AA; P01266-2 is an isoform of P01266 with a length of 2711 ...

Claims


Application Information

Patent Timeline
Patent Type & Authority Applications(United States)
IPC IPC(8): G01N33/00C12Q1/00
CPCG01N33/6848G01N33/78Y10T436/24G01N33/6893G01N33/68G01N2800/52G01N2800/7028
Inventor ZHANG, YANNICLARKE, NIGEL J.REITZ, RICHARD E.
Owner QUEST DIAGNOSTICS INVESTMENTS INC
Why Eureka
Try Eureka