Diagnosis, Prognosis and Prediction of Recurrence of Breat Cancer

a breast cancer and prognosis technology, applied in the direction of instruments, material analysis, measurement devices, etc., can solve the problems of severe impairment of patients' quality of life, low class prediction accuracy, so as to achieve the effect of a general predictor and a higher accuracy of test data

Inactive Publication Date: 2009-09-03
SIEMENS HEALTHCARE DIAGNOSTICS GMBH
View PDF1 Cites 8 Cited by
  • Summary
  • Abstract
  • Description
  • Claims
  • Application Information

AI Technical Summary

Benefits of technology

[0010]It is an unexpected finding that the overall predictor is robust in the sense that in a random permutation of the sample-to-class mapping for each partial classifier, the best possible classifier on the original data is significantly better than the best one on randomized data.
[0011]Compared to the supervised methods mentioned in the previous section, the classification method described in the invention is capable to distinguish between tumours that are genetically very different yet behave very similar with regard to a particular clinical parameter. Furthermore, it uses a much smaller set of genes for class separations and achieves a significantly higher accuracy on test data. In that respect, it out-performs prior classifiers. Special gene sets are provided for the classification of a breast tumor sample into clinically relevant subclasses.

Problems solved by technology

Yet, most if not all of the different drug treatments have numerous potential adverse effects which can severely impair patients' quality of life (Shapiro and Recht, 2001; Ganz et al., 2002).
However, this group with a minimal risk comprises only very few of all node-negative breast cancer patients.
However, this “class discovery” approach based on unsupervised two dimensional hierarchical cluster analysis appeared not to be effective for class prediction.
First, by this technique tumor samples are ordered in a row according to the calculated similarity and slight variations of the algorithm or distance metrics can result in large differences of sample orders.
In addition, inclusion of a few additional samples can have tremendous influence on sample order so that a robust and reproducible classification is difficult.
They noted that poor outlook with respect to survival is related to the vigorous proliferative ability of the tumor.
Since multivariate models usually allow for geometrically more complex separations, the issue of overfitting the data arises.
This is especially a problem if the model has a lot of parameters to be estimated from the training data.
A disadvantage of most studies using the standard strategy of supervised gene identification is the fact that the corresponding algorithms utilize a high number of genes that are potentially unstable as predictors in the general population.
In most cases the number of expression levels measured (p) will exceed the number of patient samples (n) by orders of magnitude (n<
The underlying reasons for the different behaviour of tumors with very similar expression profiles might be subtle and difficult to correlate to gene expression.
In any case, all these aspects make it very difficult to extract the most informative genes and to build a high performance classifier.

Method used


Image

  • Diagnosis, Prognosis and Prediction of Recurrence of Breat Cancer
  • Diagnosis, Prognosis and Prediction of Recurrence of Breat Cancer
  • Diagnosis, Prognosis and Prediction of Recurrence of Breat Cancer

Examples


example 1

Isolation of RNA From Tumor Tissue

[0093]RNA Isolation From Frozen Tumour Tissue Sections

[0094]Frozen sections were taken for histology and the presence of breast cancer was confirmed in samples from 212 patients. Tumor cell content exceeded 30% in all cases and was above 50% in most cases. Approximately 50 mg of snap frozen breast tumour tissue was crushed in liquid nitrogen. RLT-Buffer (QIAGEN, Hilden, Germany) was added and the homogenate spun through a QIAshredder column (QIAGEN, Hilden, Germany). From the eluate total RNA was isolated by the RNeasy Kit (QIAGEN, Hilden, Germany) according to the manufacturers instruction. RNA yield was determined by UV absorbance and RNA quality was assessed by analysis of ribosomal RNA band integrity on the Agilent Bioanalyzer (Palo Alto, Calif., USA).

example 2

Determination of Expression Levels

[0095]Gene Expression Measurement Utilizing HG-U133A Microarrays of Affymetrix

[0096]Starting from 5 μg total RNA labelled cRNA was prepared for all 212 tumour samples using the Roche Microarray cDNA Synthesis, Microarray RNA Target Synthesis (T7) and Microarray Target Purification Kit according to the manufacturer's instruction. In brief, synthesis of first strand cDNA was done by a T7-linked oligo-dT primer, followed by second strand synthesis. Double-stranded cDNA product was purified and then used as template for an in vitro transcription reaction (IVT) in the presence of biotinylated UTP. Labelled cRNA was hybridized to HG-U133A arrays (Santa Clara, Calif., USA) at 45° C. for 16 h in a hybridization oven at a constant rotation (60 r.p.m.) and then washed and stained with a streptavidin-phycoerythrin conjugate using the GeneChip fluidic station. We scanned the arrays at 560 nm using the GeneArray Scanner G2500A from Hewlett Packard. The readings ...

example 3

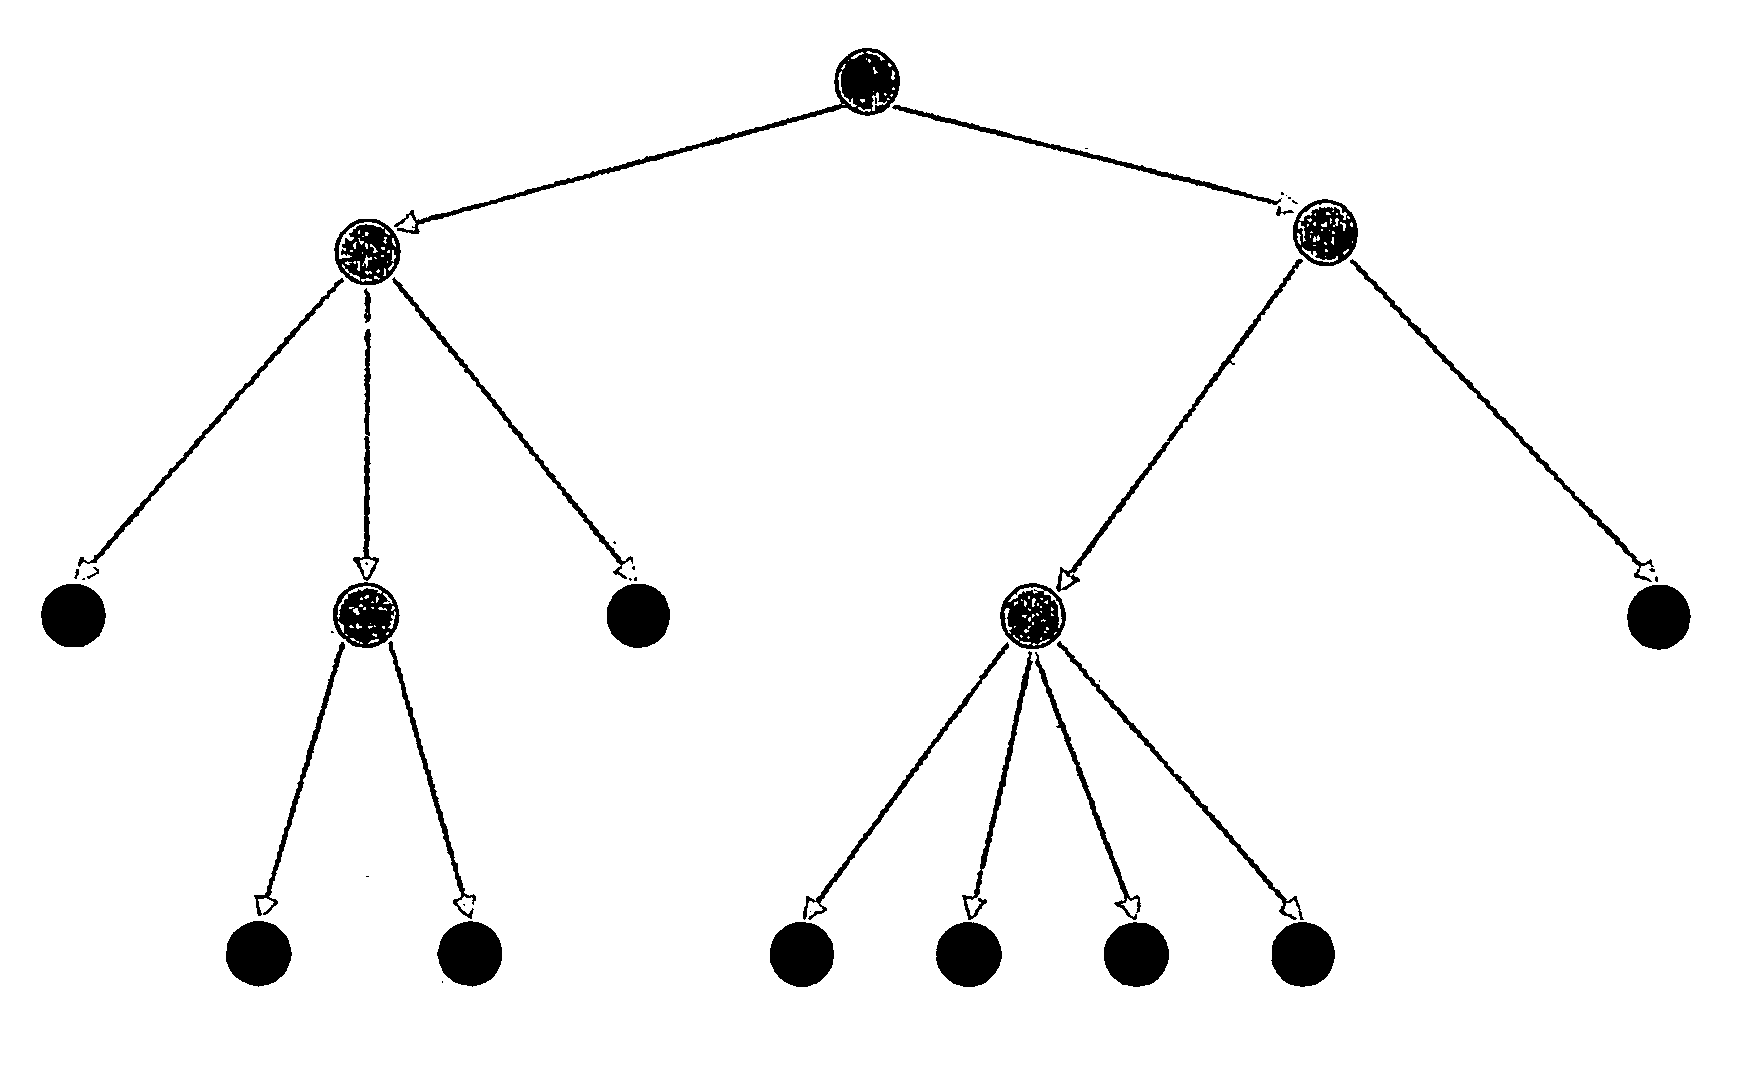
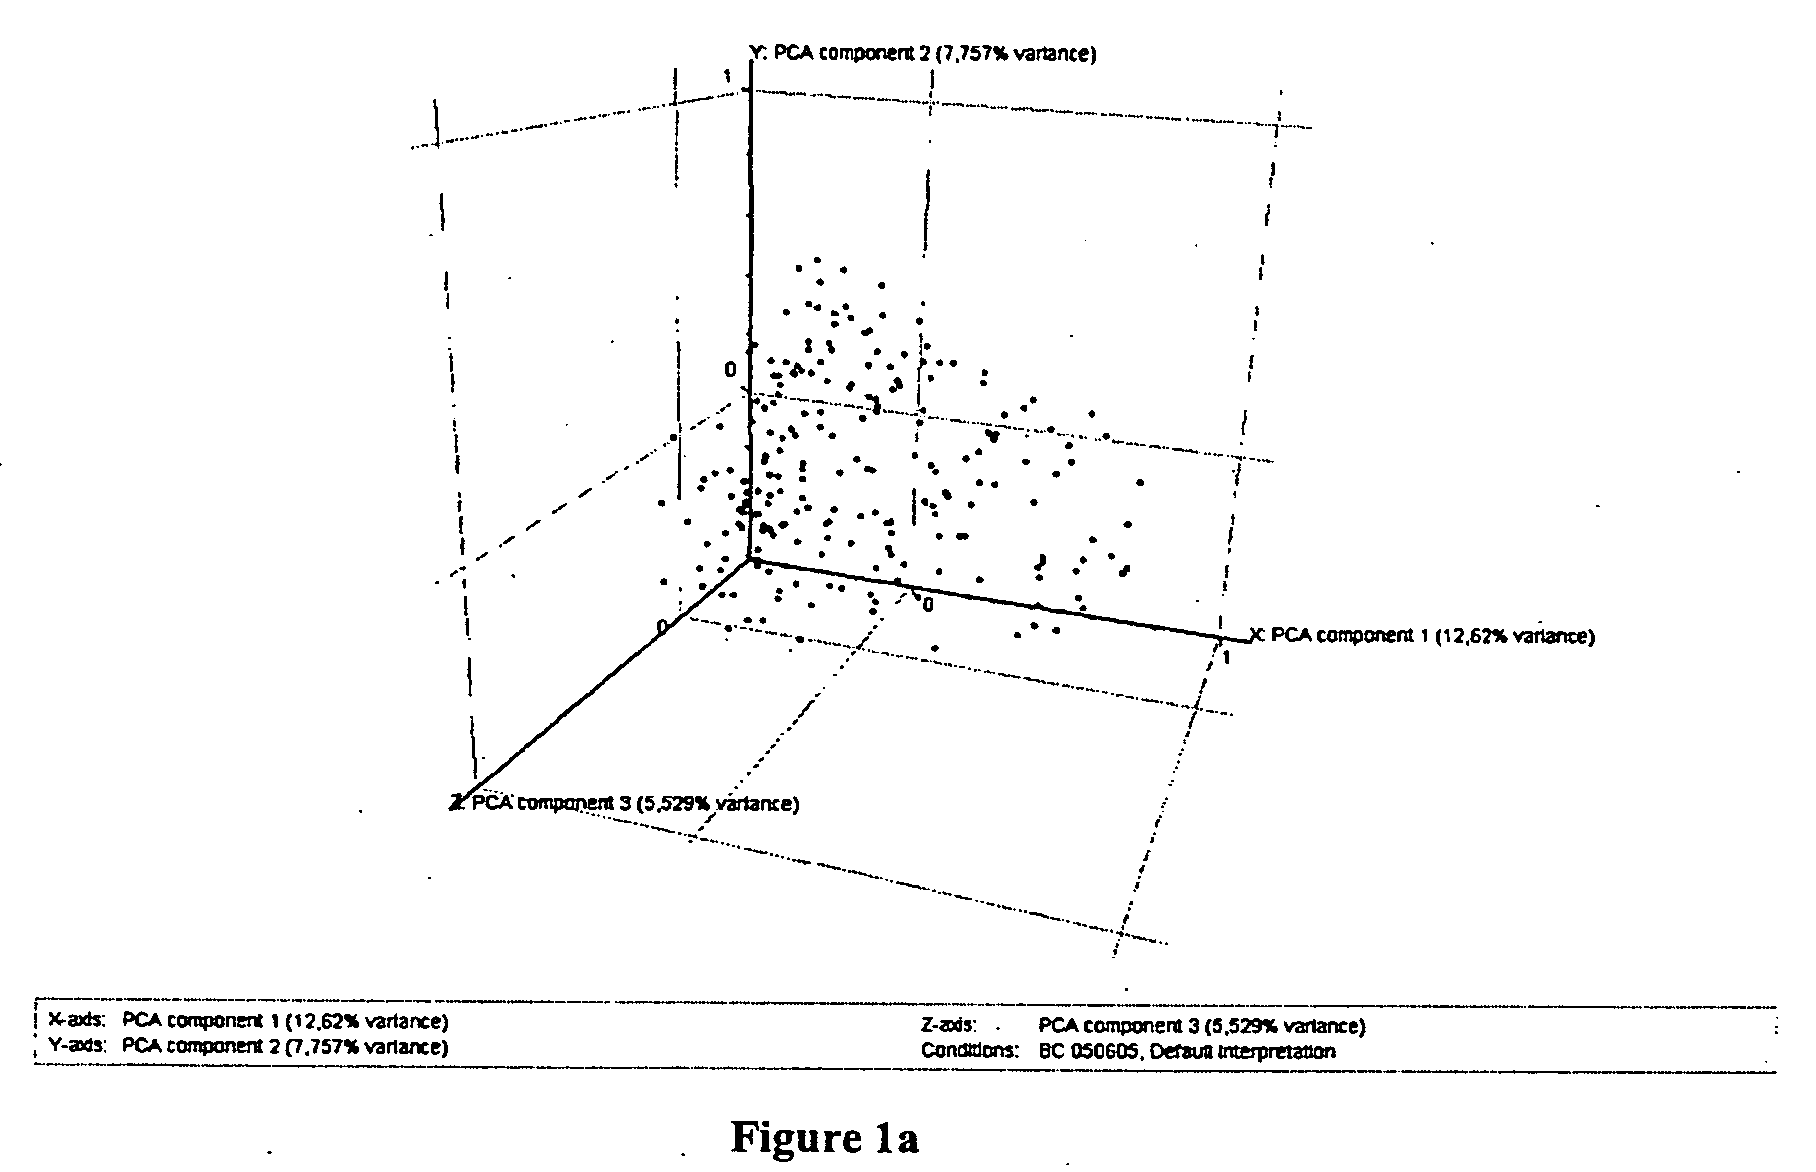
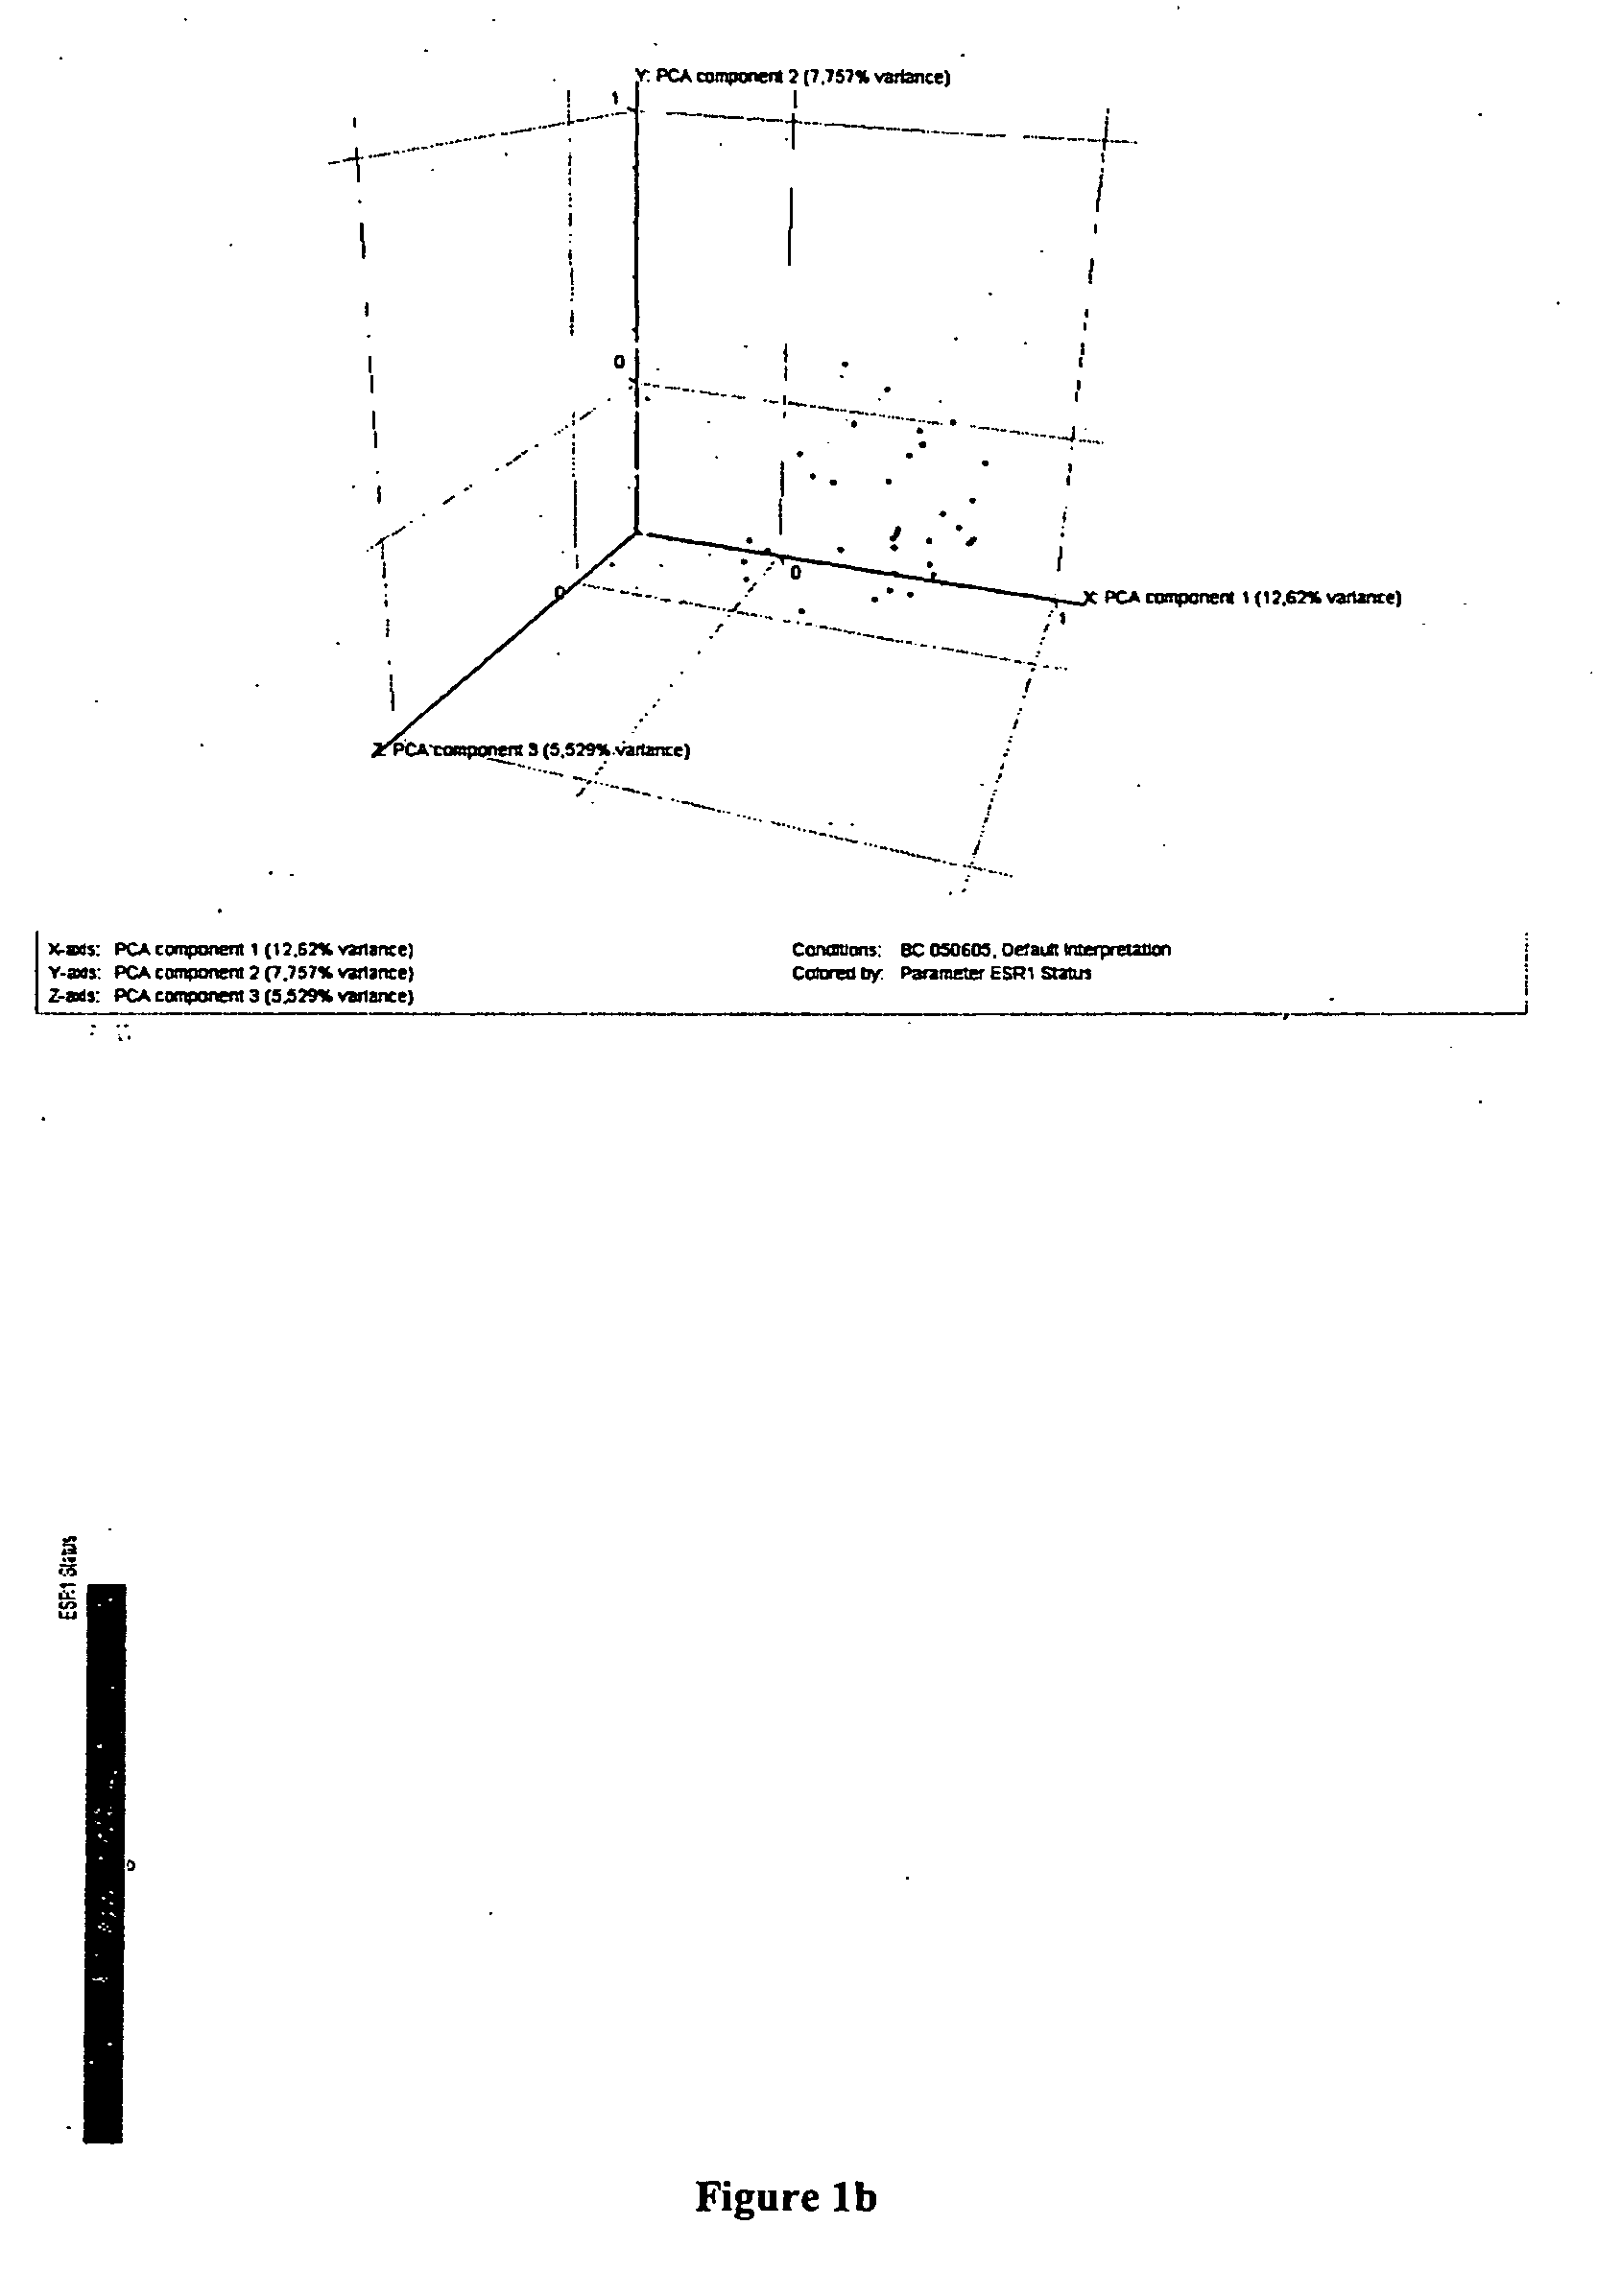
Labelling of Breast Cancer Samples into Subclasses After Principle Component Analysis

[0097]All 212*.chp files generated by MAS 5.0 were converted to *.txt Files and loaded into GeneSpring® software (Silicon Genetics, Redwood City, Calif., USA). An experiment group was created using the following normalisation settings. Values below 0.01 were set to 0.01. Each measurement was divided by the 50th percentile of all measurements in that sample. Each gene was divided by the median of its measurements in all samples. If the median of the raw values was below 10 then each measurement for that gene was divided by 10 if the numerator was above 10, otherwise the measurement was thrown out. Next, genes were filtered for quality with regard to the technical measurement. In a first step genes from the default list “all genes”. whose flags in the experiment group were “Present” in at least 10 of the 212 samples were selected for further analysis. Secondly, remaining genes were filtered for variab...


PUM


Abstract

The present invention relates to methods and compositions for the diagnosis, prognosis, and prediction of breast cancer. More specifically, the invention relates to classification of breast cancer tissue samples based on measuring the expression of a set of marker genes. The set is useful for the identification of clinically important breast cancer subtypes. Methods are disclosed for prediction, diagnosis and prognosis of breast cancer.

Description

TECHNICAL FIELD OF THE INVENTION[0001]The present invention relates to methods and compositions for the diagnosis, prognosis, and prediction of breast cancer. More specifically, the invention relates to classification of breast cancer tissue samples based on measuring the expression of a set of marker genes. The set is useful for the identification of clinically important breast cancer subtypes. Methods are disclosed for prediction, diagnosis and prognosis of breast cancer.BACKGROUND OF THE INVENTION AND PRIOR ART[0002]Breast cancer is one of the leading causes of cancer death in women in western countries. More specifically breast cancer claims the lives of approximately 40,000 women and is diagnosed in approximately 200,000 women annually in the United States alone. Over the last few decades, adjuvant systemic therapy has led to markedly improved survival in early breast cancer (EBCTCG, 1998 a+b). This clinical experience has led to consensus recommendations offering adjuvant syst...

Claims


Application Information

Patent Timeline
Patent Type & Authority Applications(United States)
IPC IPC(8): G06F15/18G16B40/30G16B25/10G16B40/10
CPCG06F19/24G06F19/20G16B25/00G16B40/00G16B40/30G16B40/10G16B25/10
Inventor GEHRMANN, MATHIASVON TORNE, CHRISTIAN
Owner SIEMENS HEALTHCARE DIAGNOSTICS GMBH
Why Eureka
Try Eureka