

Methods and apparatuses for decreasing the co2 concentration of a fluid
a technology of co2 concentration and fluid, applied in the direction of liquid gas reaction of thin film type, gas-gas reaction process, separation process, etc., can solve the problems of global energy consumption increasing significantly, the long-term efficiency of such sequestering remains subject of intense study and debate, and the long-term integrity of such systems is seriously doubted
- Summary
- Abstract
- Description
- Claims
- Application Information
AI Technical Summary
Benefits of technology
Problems solved by technology
Method used
Image

Examples
example 1
The Flow Cell Apparatus Stimulated CO2-Dependent pH Changes
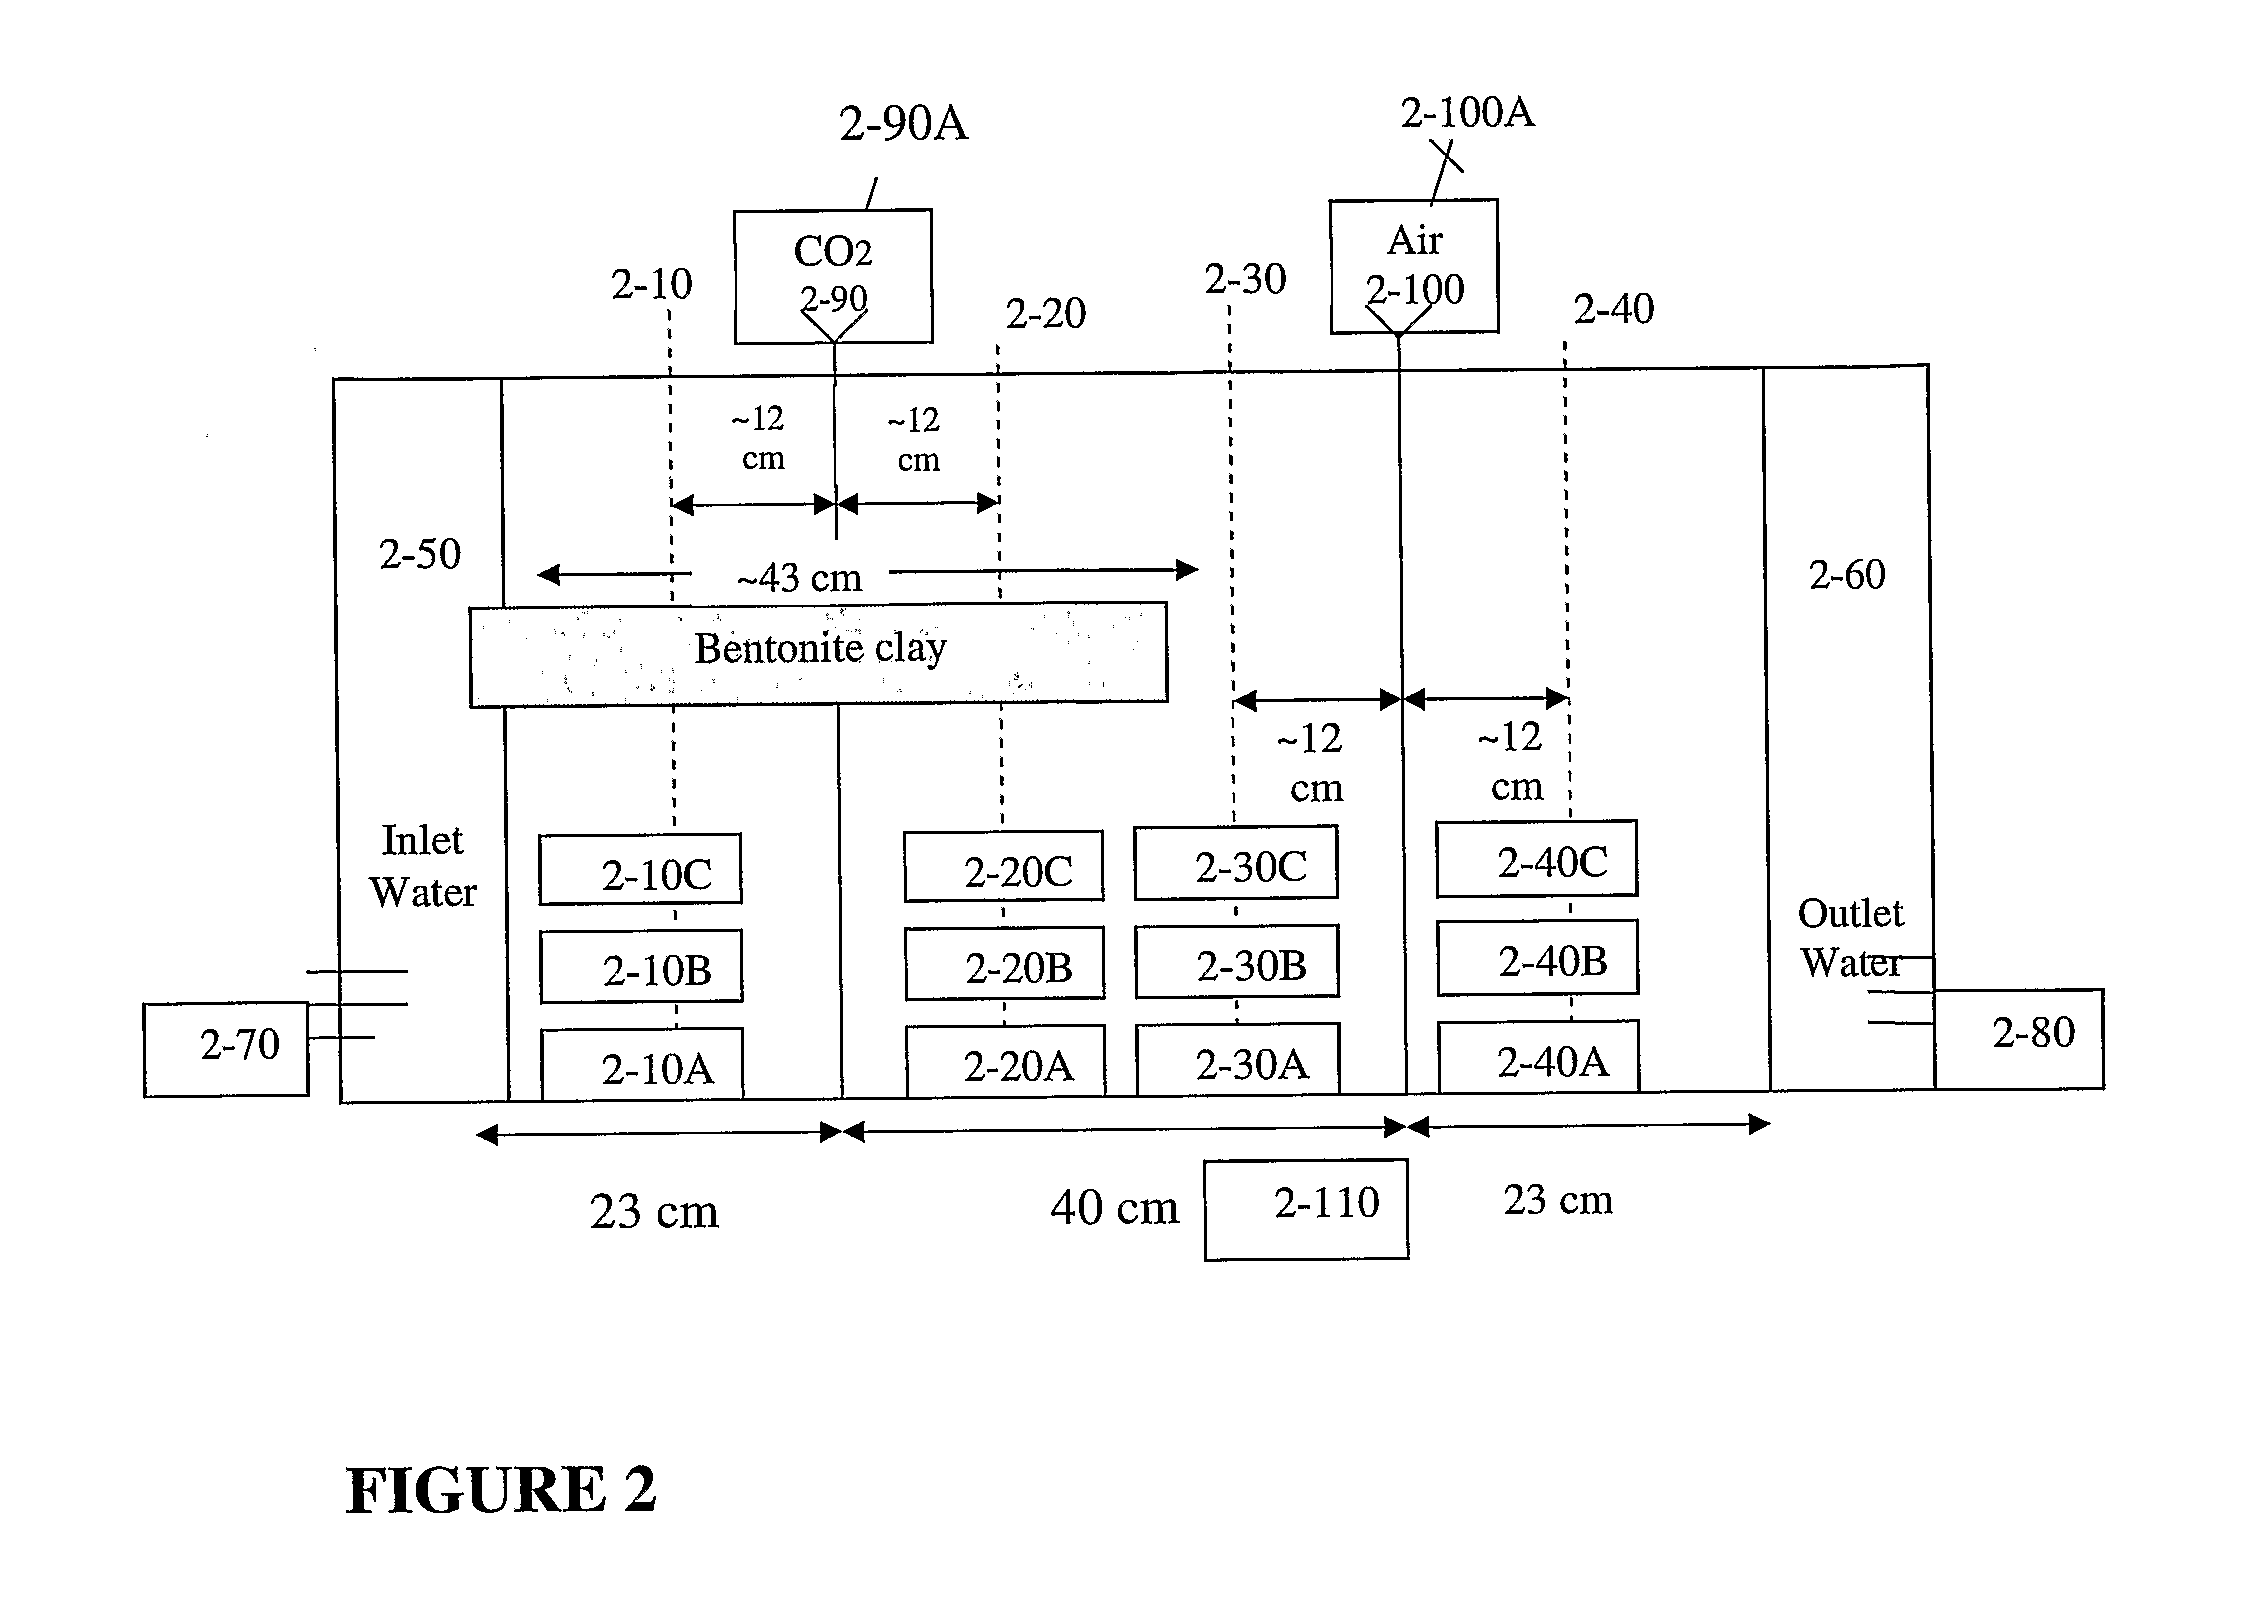
[0194]Samples from different heights and locations in the flow cell (as presented in FIG. 2) were analyzed and their pH was measured. Measurements of pH serve as an indicator for CO2 content. With low pH correlating to high CO2 concentration. Increased promotion of carbonate precipitation occurred in a short time (minutes to hours in the flow cell), and was evident by the rise in pH (Table 1).
TABLE 1pH samples after 7 hours, one week and two weeks.pH afterpH afterpH afterSample7 hoursone weektwo weeks2-10A—7.5-87.52-10B6.57.5-87.52-10C6.57.5-87.52-20A7.56 6-6.52-20B—5.5-65.52-20C5.5-6 5-5.55-5.52-30A8 6-6.57 2-30B——7.5-8 2-30C6 5.55.52-40A8.57.5-87.52-40B8.57.5-87.52-40C8.57.5-87.5
[0195]Table 1 indicates a trend in terms of the pH of the samples, where samples taken from the CO2 injection region presented a more acidic pH, while those at the air injection region presented more basic pH.
[0196]Small changes in the flow...
example 2
The Flow Cell Apparatus Stimulated CO2 Sequestering
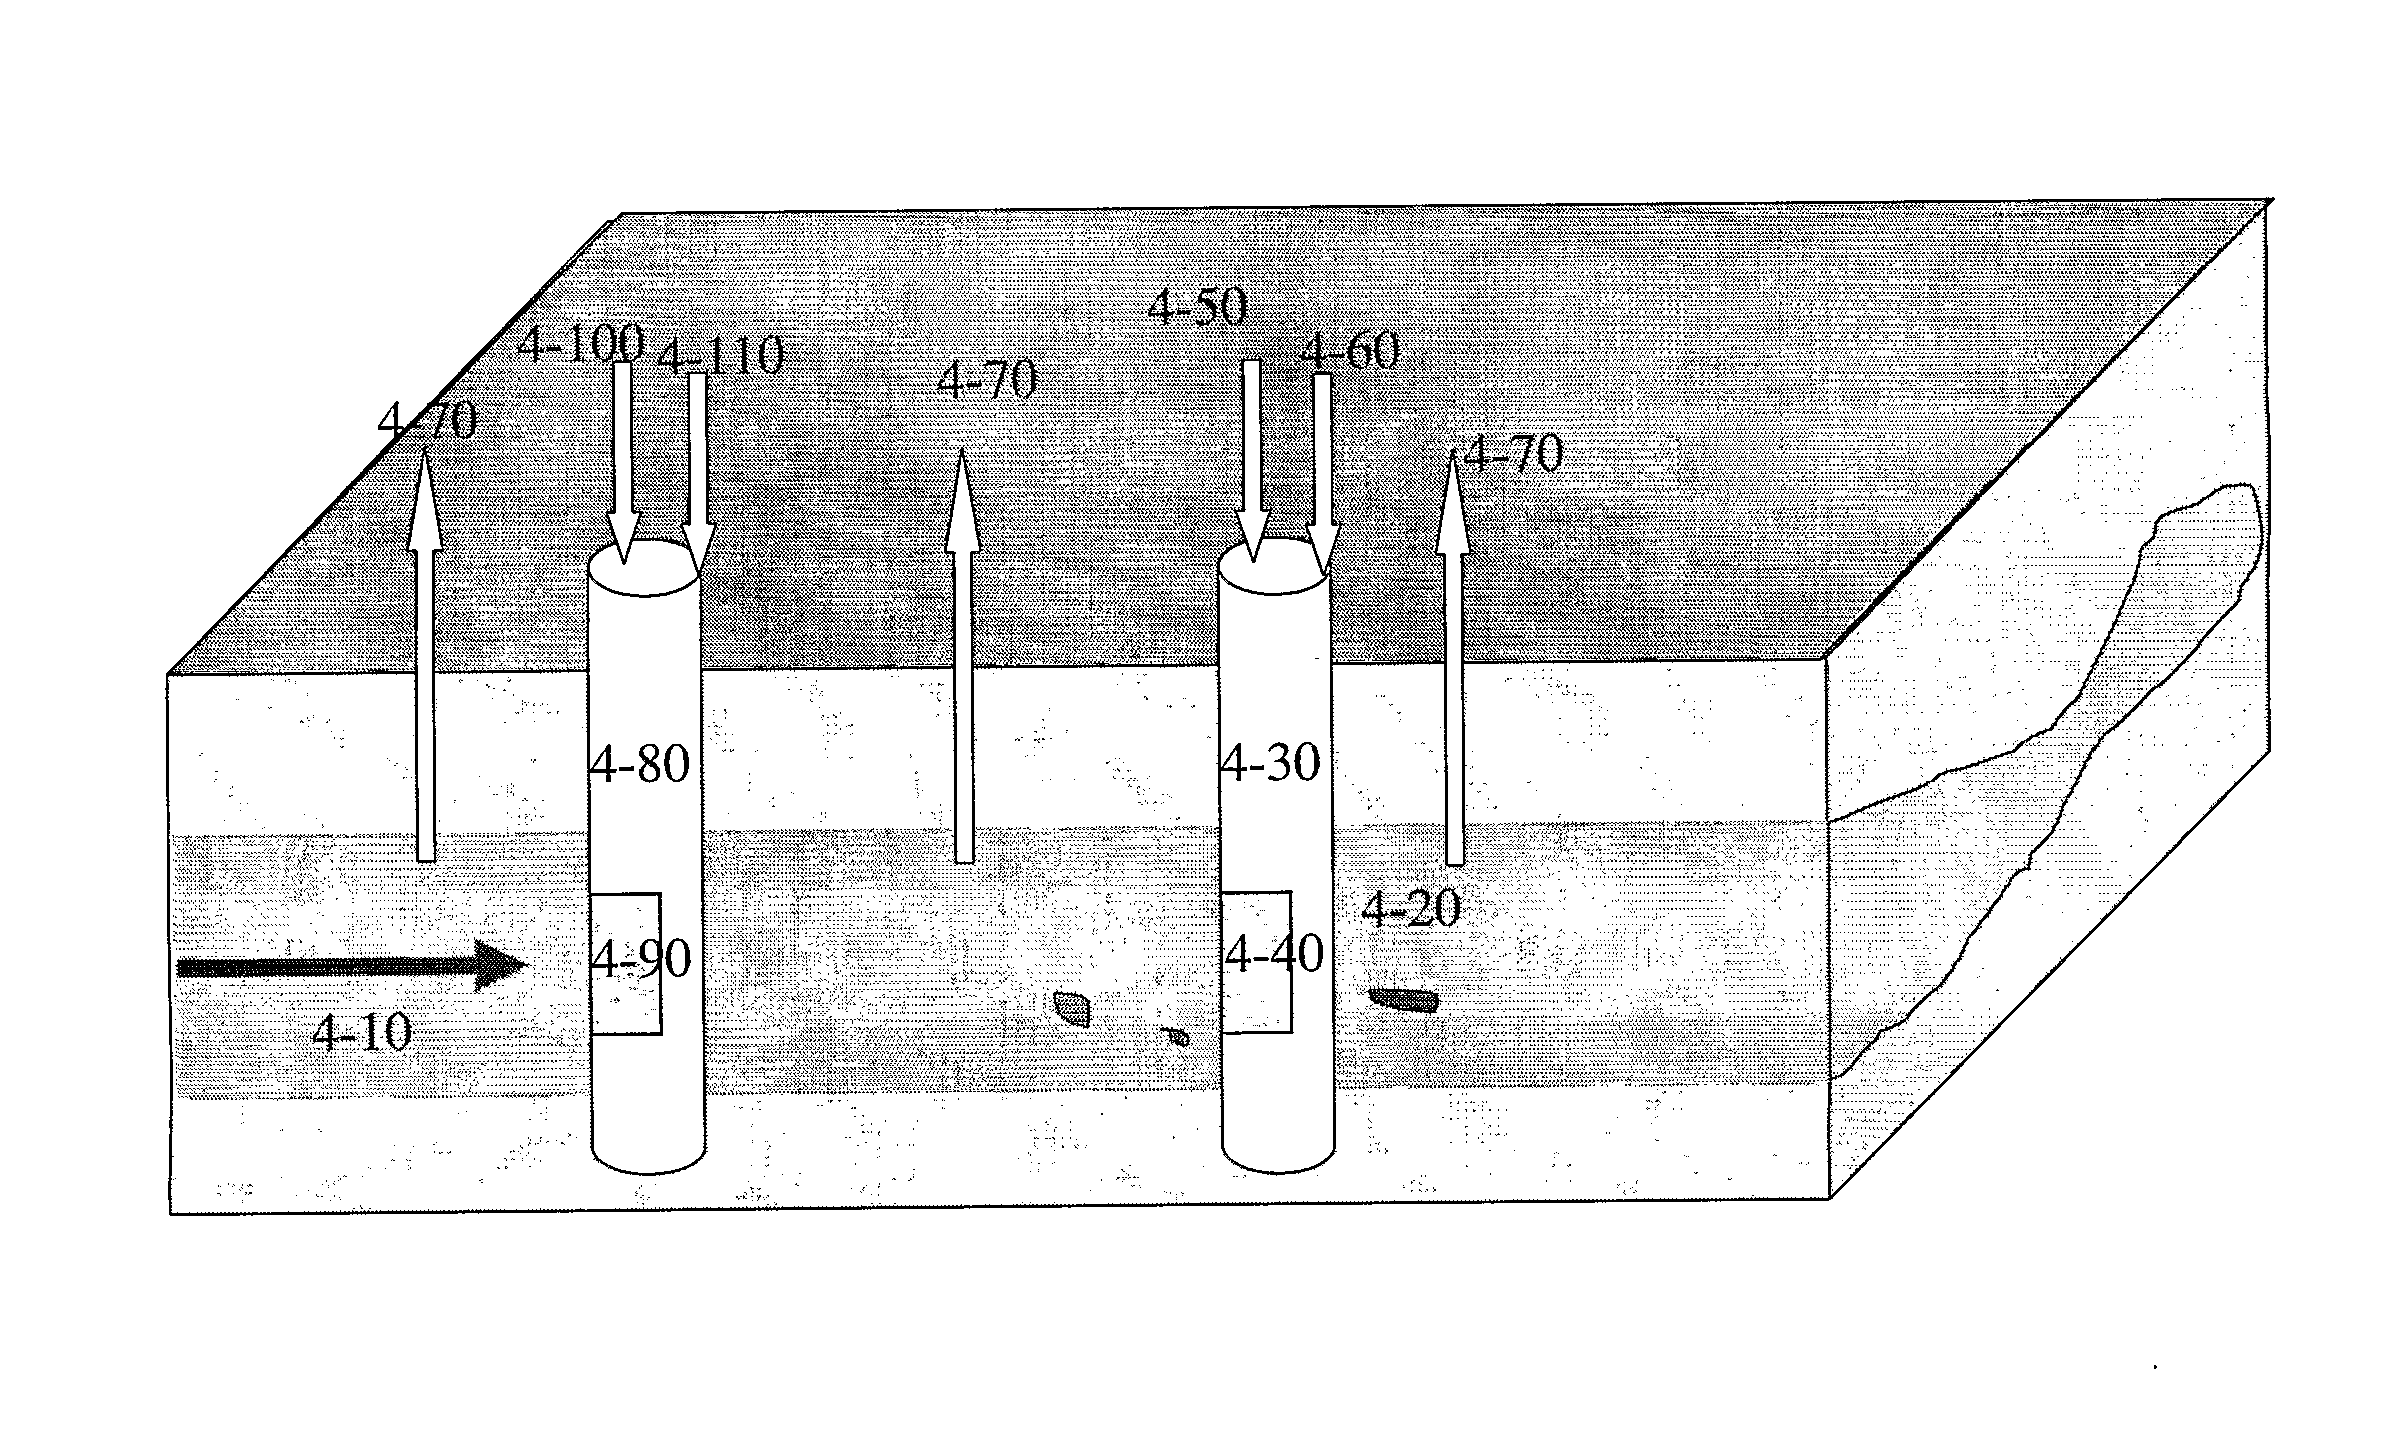
[0197]Five representative samples (sand and precipitated carbonate) were analyzed and carbonate precipitate was measured as percentage by weight of the sand sample, by dissolving deposited carbonate in acid solutions and analyzing the content of the released gases, wherein 1 g of precipitated calcium carbonate is equivalent to 0.44 g of CO2. The analyzed samples were in the region between the two injection wells. The location of the samples is presented in FIG. 3.
[0198]Sample 3-20 results in ˜0.2-˜0.3% w / w of calcium carbonate in the sand sample; Sample 3-30 results ˜0.2% w / w of calcium carbonate in the sand sample;
[0199]Sample 3-40 results ˜0.4% w / w of calcium carbonate in the sand sample; Sample 3-50 results ˜1.2-˜1.3% w / w of calcium carbonate in the sand sample;
[0200]Sample 3-60 results ˜0.4% w / w of calcium carbonate in the sand sample.
[0201]Thus samples close to the air injection (for example sample 3-50) possessed a higher conc...
example 3
Carbonate Precipitate Forms from Injected CO2
[0202]CO2 isotope signature values differ as a function of the environment in which the gas is formed. Isotope analysis of the sample regions depicted in FIG. 3 was conducted:
[0203]Sample 3-20: −19.4‰
[0204]Sample 3-30: −17.6‰
[0205]Sample 3-40: −10.5‰
[0206]Sample 3-50: −5.5‰
[0207]Sample 3-60: −9.6‰
[0208]Sample 3-10: −18.2‰
[0209]Sample 3-70: −21.1‰
[0210]Sample 3-80: −21.6‰
[0211]Sample 3-90: −4.8‰
[0212]Based on the isotopic analysis results, carbonate formation clearly arose as a function of the injected CO2, as the CO2 isotopic signature is affected by both the CO2 contained in the injected air and the injected CO2, from an organic source.
PUM
| Property | Measurement | Unit |
|---|---|---|
| Length | aaaaa | aaaaa |
| Acidity | aaaaa | aaaaa |
| Electrical inductance | aaaaa | aaaaa |
Abstract
Description
Claims
Application Information