Methods And Systems For Mass Spectrometry
- Summary
- Abstract
- Description
- Claims
- Application Information
AI Technical Summary
Benefits of technology
Problems solved by technology
Method used
Image
Examples
example 1
[0074]A surface acoustic wave transducer was constructed. FIG. 6 is a schematic diagram of the electrode design of the transducer, and FIG. 7 is a photograph of the transducer surface, showing two sets of interdigitating electrodes with an aperture disposed between them. The device was built on a 128 Y-cut X-propagating 3″ LiNbO3 wafer diced into four segments of equal size (i.e., to make four devices), each with a 1.5″ front edge. Each device included 10 pairs of 100 μm thick interdigitating electrodes on a 400 μm pitch, with an about 10 mm square aperture. The transducer was created using photolithography and lift-off techniques familiar to the person of skill in the art on the LiNbO3 substrate. Briefly, 51828 photoresist was first spun onto the wafer segment at 4000 rpm for 30 s, then patterned using UV exposure through a chrome mask for 6.5 s and developing in the appropriate developer for 40 s. The interdigitating electrodes were produced by deposition of 20 nm Ti (as a bonding...
example 2
[0081]Mass spectra were acquired using a hybrid linear ion trap Fourier-transform ion cyclotron resonance mass spectrometer (LTQ-FT, Thermo Scientific). For comparative experiments using ESI, samples were delivered via a fused silica capillary with a pulled tip at 1 μL / min via a syringe pump. The ESI voltage was set at 1.6 kV, with the voltage delivered via a liquid junction electrode as described in Yi, E. C., et al., Rapid Commun. Mass Spectrom. 2003, 17, 2093-2098, which is hereby incorporated herein by reference in its entirety.
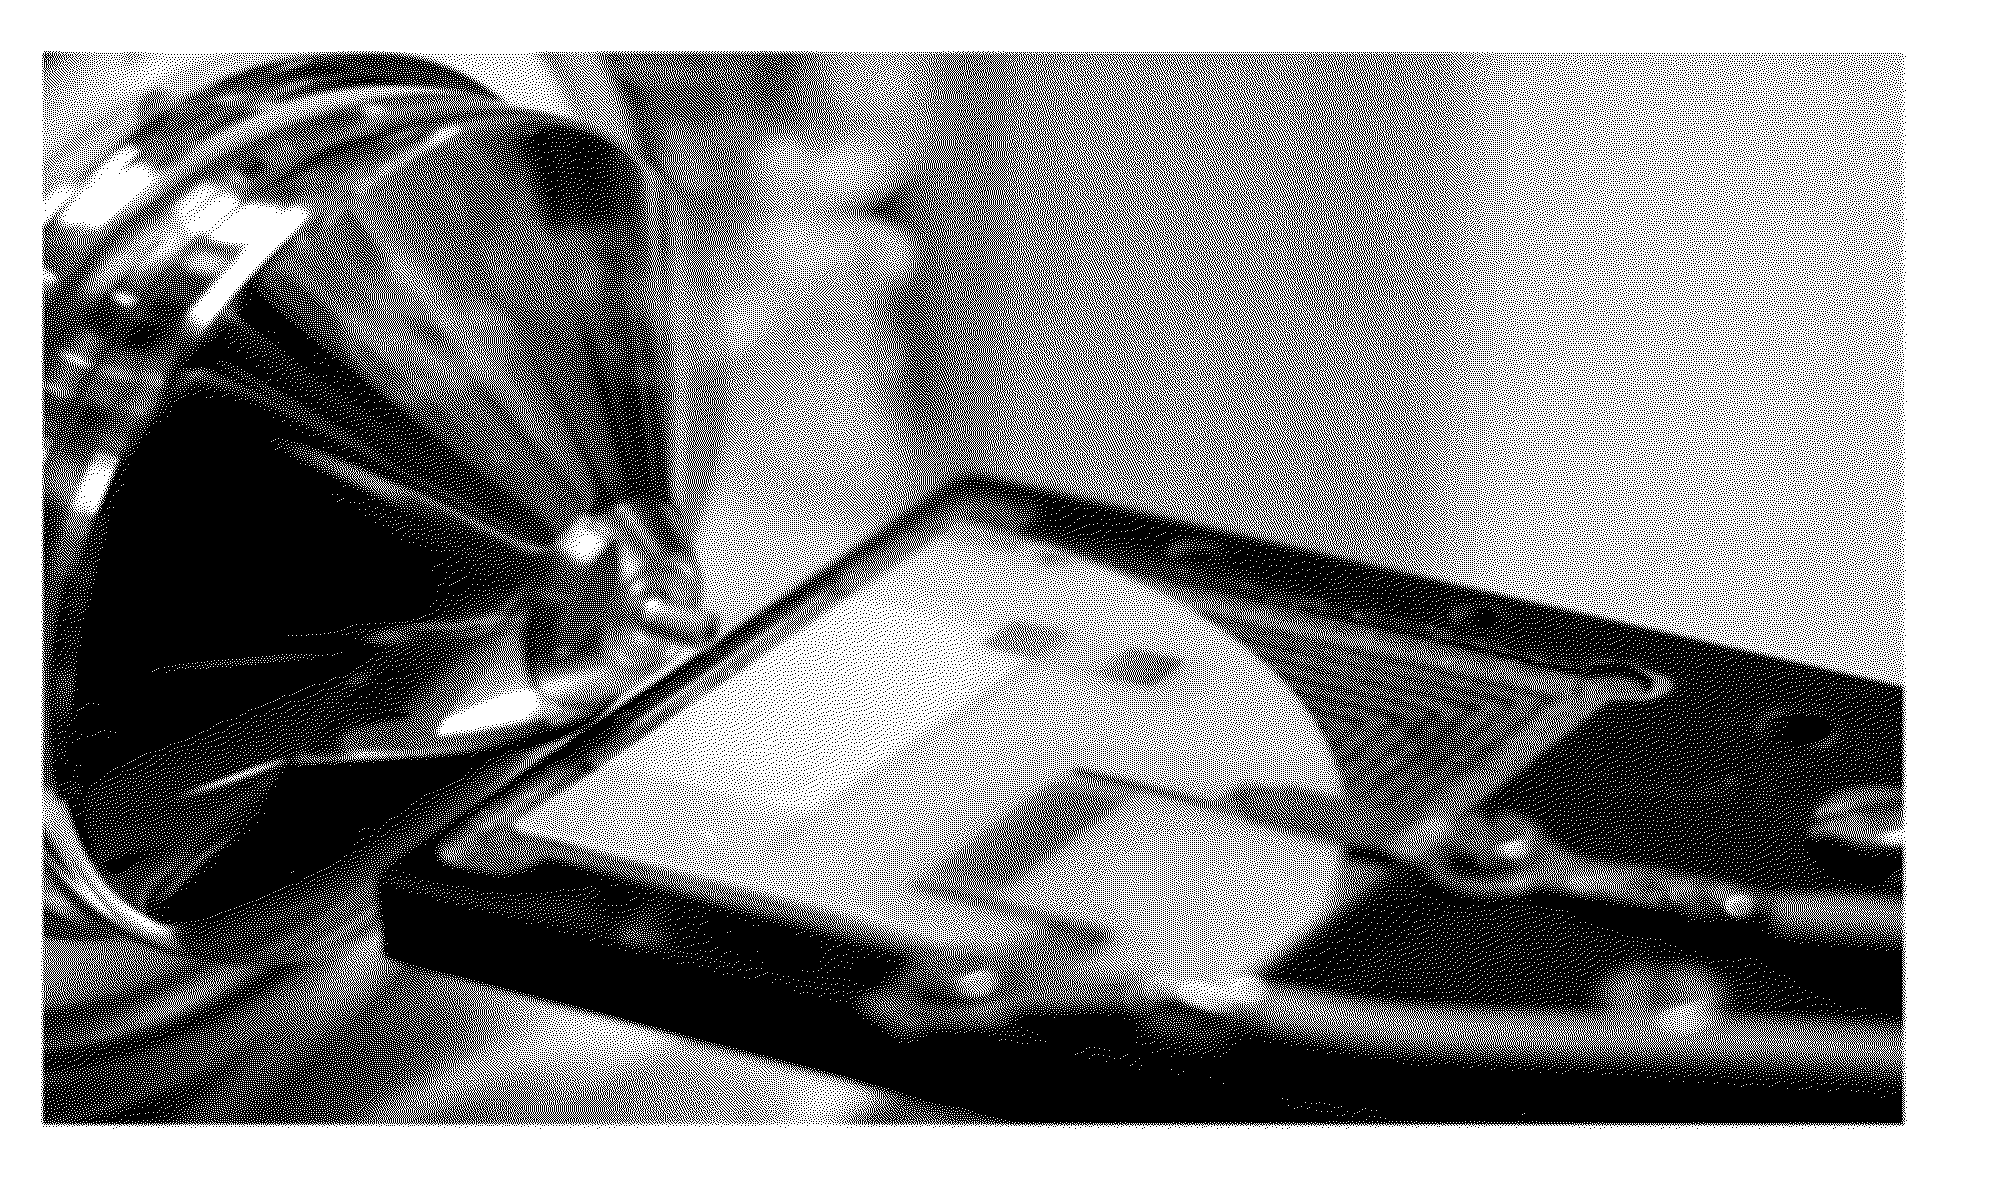
[0082]The surface acoustic wave transducer of Example 1 was interfaced with the LTQ-FT mass spectrometer. A picture of the experimental setup is provided as FIG. 12. Using a three dimensional adjustable stage, the transducer was positioned 1 cm below the heated capillary inlet of the mass spectrometer, with the center of the surface acoustic wave device being in line with the capillary inlet. The inlet orifice was maintained at 100 V, and the heated capil...
example 3
[0085]Lipid A endotoxin from Gram-negative bacteria was analyzed. Lipid A is a glycolipid which typically (and problematically for structure determination) displays more monosaccharide modifications when measured by ESI than MALDI. FIG. 16 shows example mass spectra (on different m / z scales) of Yersinia pestis Lipid A obtained by (A) MALDI-TOF and (B) ESI-LTQFT-ICR-MS. Notably, the same sample produces drastically different data. While the MALDI spectrum is dominated by a tetra-acylated structure (m / z˜1403 g / mol) with minor ions representing monosaccharide additions, the ESI spectrum displays a dramatically lower abundance at m / z˜1403 g / mol. The dominant ESI generated ions represented tetra-acylated structure with both single and double aminoarabinose modifications (m / z˜1534 and 1665, respectively). Moreover, lipid A extracts can clog ESI tips.
[0086]FIG. 17 is a set of mass spectra and the structure of Lipid A generated using surface acoustic wave transduction of a 50:50 methanol / ch...
PUM
 Abstract
Description
Claims
Application Information
 - R&D
- Intellectual Property
- Life Sciences
- Materials
- Tech Scout
- Unparalleled Data Quality
- Higher Quality Content
- 60% Fewer Hallucinations
Browse by: Latest US Patents, China's latest patents, Technical Efficacy Thesaurus, Application Domain, Technology Topic, Popular Technical Reports.
© 2025 PatSnap. All rights reserved.Legal|Privacy policy|Modern Slavery Act Transparency Statement|Sitemap|About US| Contact US: help@patsnap.com


