Method accounting for thermal effects of lighting and radiation sources for spectroscopic applications
a technology of radiation source and thermal effect, applied in the field of spectral measurements, can solve the problems of large temperature coefficient of electrical resistance, device will diminish, but not completely remove, and intensity fluctuations, and achieve the effect of improving light intensity
- Summary
- Abstract
- Description
- Claims
- Application Information
AI Technical Summary
Benefits of technology
Problems solved by technology
Method used
Image
Examples
example 1
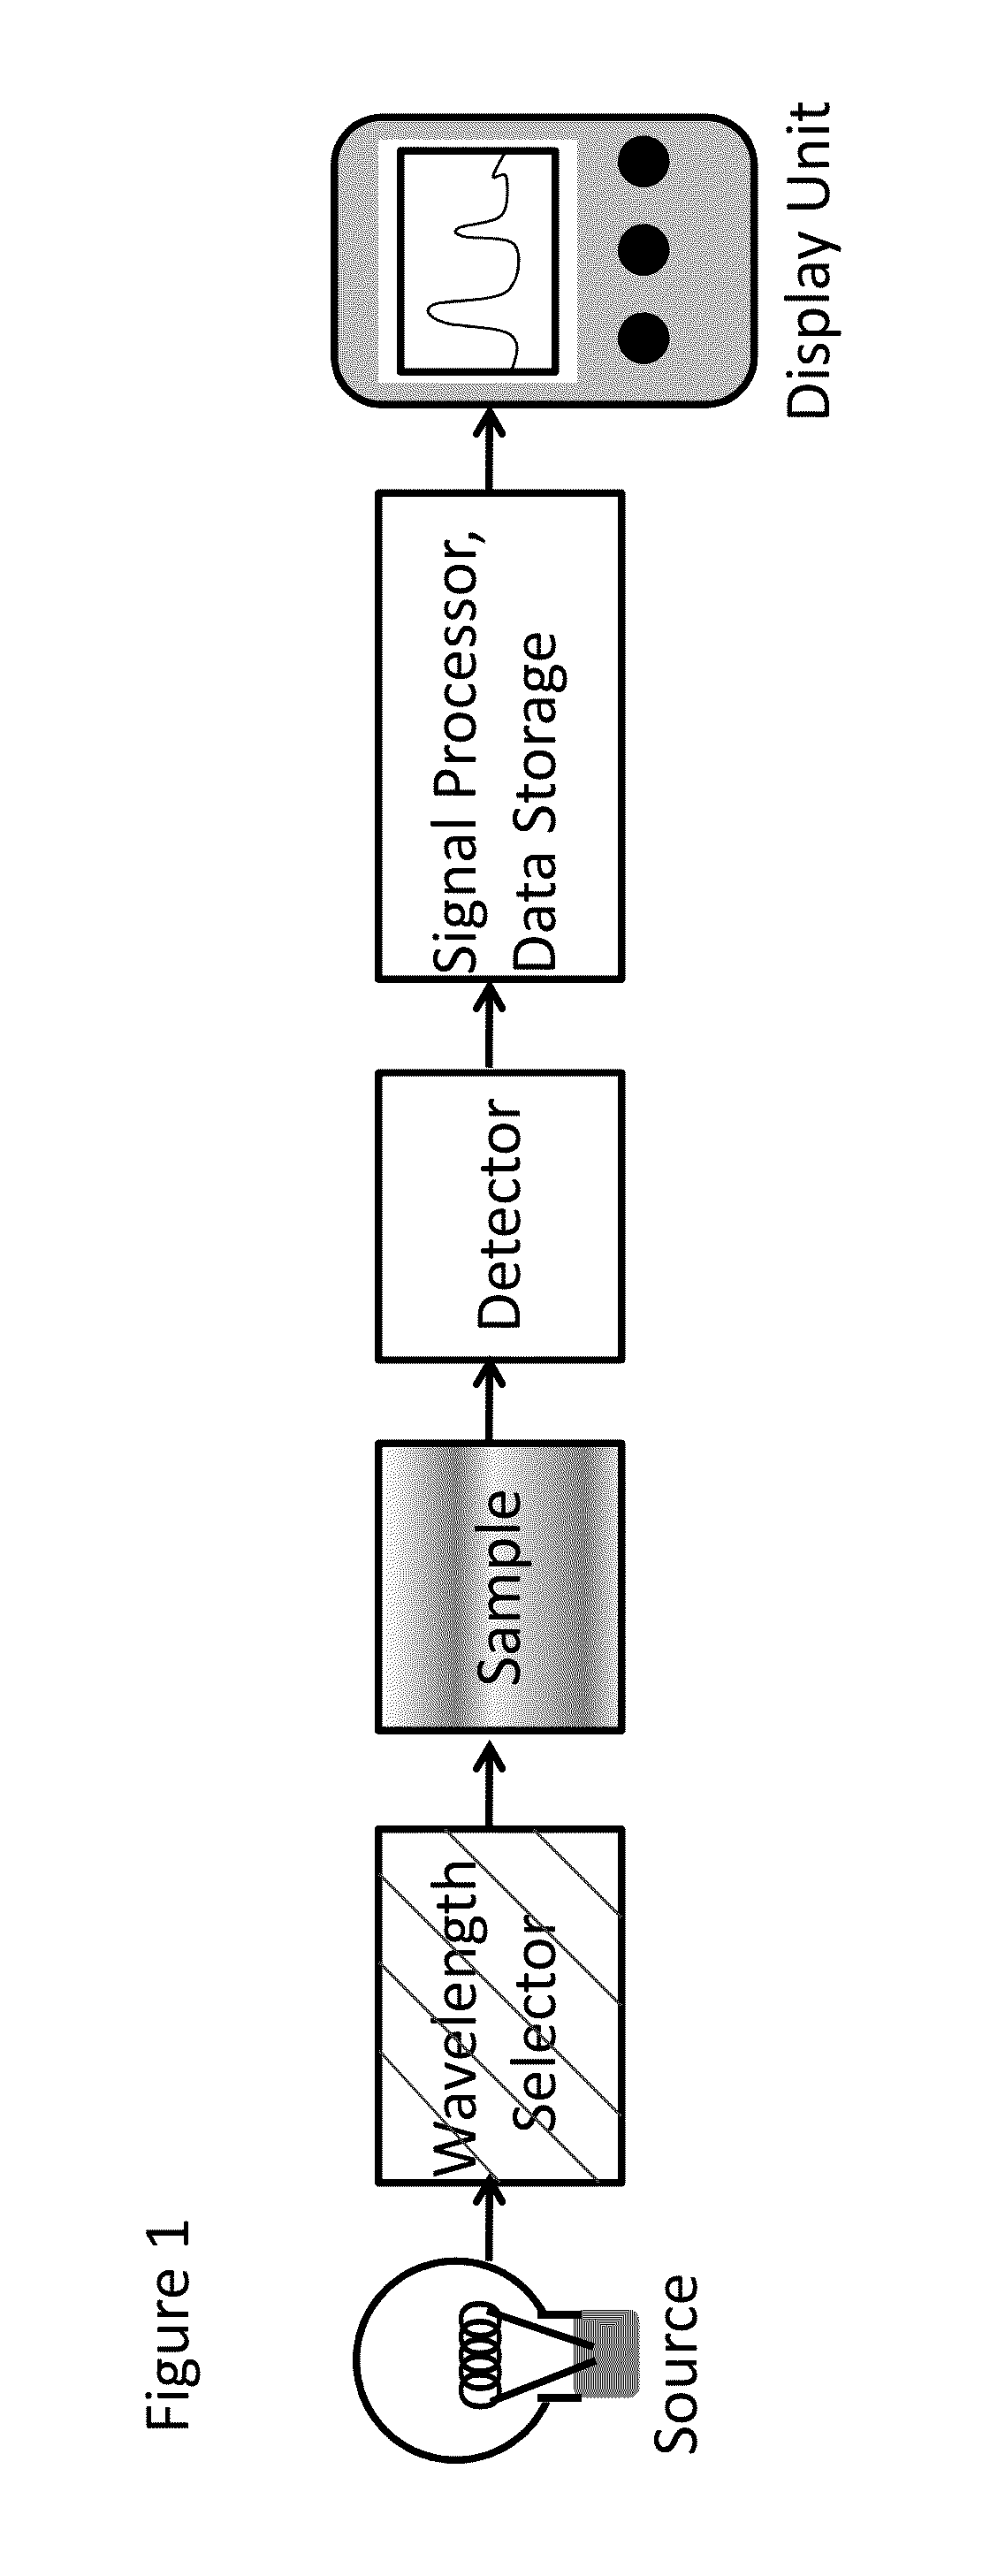
[0053]A spectrophotometer (i-Lab® Model S560 with surface reader adapter) was initially calibrated with a white Teflon and carbon-based black standards. The goal was to then measure the visible spectra (400 nm to 700 nm) of a red Avery® 5472™ color coding label while the temperature of the light source varied.
[0054]In the study, two stickers were affixed to the bottom of a white Teflon calibrator well. A tubular surface reader adapter on the instrument was then placed into the well. The well was then taped onto the spectrophotometer with black duct tape to ensure that its position would not change. The instrument with attached calibrator was placed into a thermal regulating unit (Euro Cuisine Model YM 100 Yogurt Maker) and allowed to equilibrate for one hour. The instrument with calibrator was then removed from the thermal regulating unit. The instrument was turned on and the temperature of the light source (three LEDs) was measured, as was a spectrum of the immobile, red sticker, a...
example 2
[0056]The spectra of EXAMPLE 1 were processed at each wavelength using an algorithm such that a theoretical, normalized spectrum was generated using 25° C. as the reference temperature. FIG. 6 shows the Absorbance of three wavelengths (417 nm, 475 nm, and 536 nm) as a function of temperature from −17° C. to −30° C. that was part of the algorithm. FIG. 6 shows that there is a linear dependency of Absorbance on light source temperature, although the linearity varies at each wavelength. The variance may be attributed to light source differences in intensities since there were three LEDs used, and also absorbance characteristics of the sample. FIG. 7 shows the normalized spectrum from 400 nm to 700 nm using 25° C. as the calculated standard, along with two measured spectra at light source temperatures of 17.31° C. and 29.31 ° C., for comparative purposes. Thus, this example shows that there is a relationship between the temperature of a light source or sources and the resulting spectrum...
example 3
[0057]The spectra of EXAMPLE 1 was used to determine the International Commission on Illumination (CIE) L*, a*, b* color values. The three values taken together can define a specific color; where L* is lightness, with L*=0 being an all-absorbing black and L*=100 an all-reflecting white; a* is the degree of magenta to green, with negative values being green in color and positive values being magenta; and b* is the degree of yellow to blue, with negative values being blue in color and positive values being yellow. The L*, a*, b* values indicate color as observed by the human eye and are calculated from weighted absorbance at various wavelengths.
[0058]The spectral data of EXAMPLE 1 was to calculate L*, a* and b* values. FIGS. 8-10 show, respectively, the L*, a* and b* values of the red sample as a function of light source intensity. The values may be normalized with an algorithm to calculate color values for a specific temperature.
[0059]The algorithm was made by initially measuring the...
PUM
 Abstract
Description
Claims
Application Information
 - R&D
- Intellectual Property
- Life Sciences
- Materials
- Tech Scout
- Unparalleled Data Quality
- Higher Quality Content
- 60% Fewer Hallucinations
Browse by: Latest US Patents, China's latest patents, Technical Efficacy Thesaurus, Application Domain, Technology Topic, Popular Technical Reports.
© 2025 PatSnap. All rights reserved.Legal|Privacy policy|Modern Slavery Act Transparency Statement|Sitemap|About US| Contact US: help@patsnap.com


