DNA markers for feed efficiency in cattle
- Summary
- Abstract
- Description
- Claims
- Application Information
AI Technical Summary
Benefits of technology
Problems solved by technology
Method used
Image

Examples
example 1
Feed Efficiency Phenotype
[0096]For this study, 174 Nellore-Angus F2 steers in 13 full-sibling families, produced by embryo transfer, from the Texas A&M McGregor Genomics research population located in central Texas (latitude: 31.3865, longitude: −97.4105) were utilized. Calves were produced in the spring and fall calving seasons, and this study used calves born from 2003 to 2005. After weaning (approximately 230 d of age) the animals were grass fed for approximately 130 d until they reached 11 to 13 mo of age. Steers were moved to a Calan Broadbent Feeding System (American Calan; Northwood, N.H.) to enable measurement of individual feed intake. Over 28 d, the steers were adjusted to the finishing diet (Table 1). Feeding was ad libitum and uneaten food was removed and measured every 7 d. Animals were weighed every 28 d for ˜140 d at the same time of day and in the same order of pens at each weigh day to equalize gut fill effects across time, as much as possible.
[0097]Using the Nation...
example 2
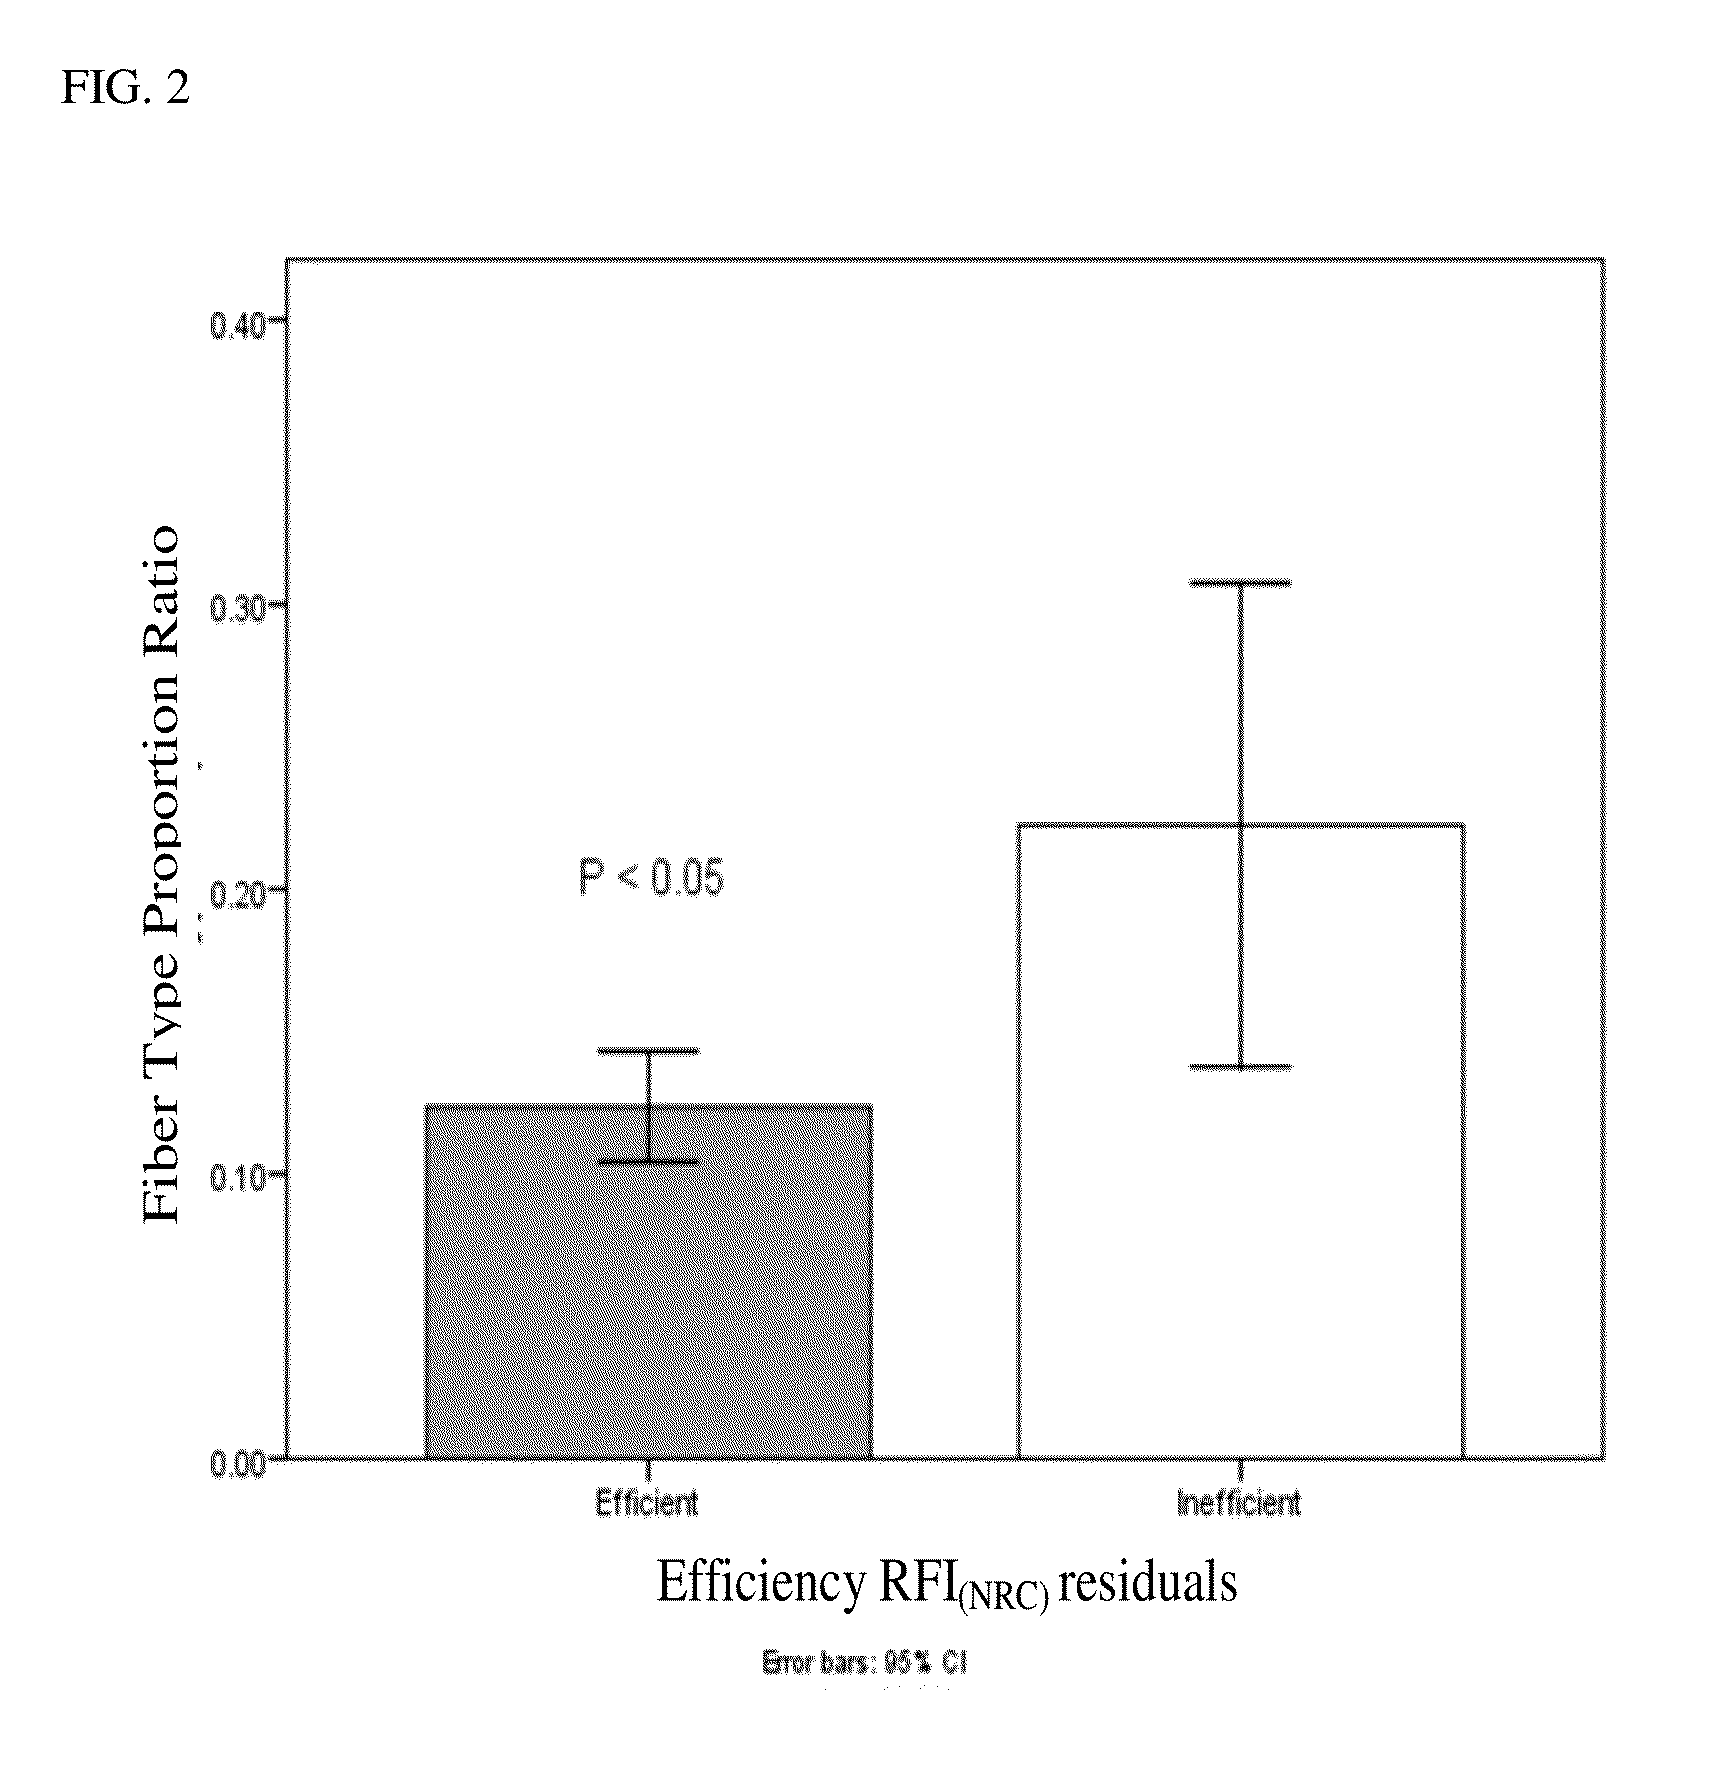
[0098]For gene expression analysis, 36 animals were identified at the tails of the efficiency distribution based on RFINRC as described above. A total of 18 animals were classified as most “efficient” for this population and had negative RFINRC residuals, indicating that they had consumed less feed than would be expected based on the model. A total of 18 animals were classified as most “inefficient” with positive RFINRC residuals, indicating they had consumed more feed than would be expected based on the model. Muscle samples from these 36 animals were used for subsequent expression analysis. A statistically average group of 18 animals with an RFINRC residual clustered around zero was added for comparison purposes. Thus, a total of 54 animals from the middle and both tails of the residual distribution were analyzed for gene expression. Means for these groups are presented in Table 2.
TABLE 2Simple means (±std err) for RFI residuals by efficiency groupsItemEfficientAve...
example 3
Tissue Collection and Extraction of RNA
[0099]Steers were harvested at 18 mo of age at the Rosenthal Meat Center at Texas A&M University in College Station, Tex., using humane harvesting procedures, as described by Savell and Smith (2000). Animals were restricted from feed for approximately 12 hr before harvest, but had continual access to water. Animals were immobilized using a captive bolt stunning mechanism and further processed using standard industry procedures. Approximately 1 g of muscle tissue from the Longissimus cervicis (in the neck region of the carcass) was collected shortly after death and before electrical stimulation (ES), less than 1 hr post-exsanguination of the carcass. The muscle sample was flash frozen in liquid nitrogen to prevent mRNA degradation. Samples were stored at −80° C. until RNA was extracted.
[0100]Total RNA was extracted from approximately 100 to 200 mg of whole muscle tissue (L. cervicis) from each of the 54 animals with TRI Reagent® (Molecular Resea...
PUM
| Property | Measurement | Unit |
|---|---|---|
| Efficiency | aaaaa | aaaaa |
Abstract
Description
Claims
Application Information
 - Generate Ideas
- Intellectual Property
- Life Sciences
- Materials
- Tech Scout
- Unparalleled Data Quality
- Higher Quality Content
- 60% Fewer Hallucinations
Browse by: Latest US Patents, China's latest patents, Technical Efficacy Thesaurus, Application Domain, Technology Topic, Popular Technical Reports.
© 2025 PatSnap. All rights reserved.Legal|Privacy policy|Modern Slavery Act Transparency Statement|Sitemap|About US| Contact US: help@patsnap.com