Phase determination of a radiation wave field

a radiation wave field and phase determination technology, applied in image data processing, photometry, instruments, etc., can solve the problems of introducing significant computational complexity, reducing the accuracy of phase shift measurement, so as to reduce the spatial resolution and improve the rate of change. the effect of the rate of chang

Inactive Publication Date: 2005-04-26
MELBOURNE UNIV OF THE
View PDF10 Cites 19 Cited by
  • Summary
  • Abstract
  • Description
  • Claims
  • Application Information

AI Technical Summary

Benefits of technology

[0107]Preferably the first focus corresponds to an in focus image at the surface and the changed focus to a slightly defocussed image. Either negative or positive defocus may be used. The defocus is preferably small so that degradation in spatial resolution is minimised. In some applications more than two images may be obtained to obtain a better estimate of the rate of change of intensity.

Problems solved by technology

This approach only provides for phase visualisation and does not provide for the measurement of phase shift.
Whilst this approach can be used for non-uniform intensity distributions the extent of the non uniformity is limited and introduces significant computational complexity.
Consequently this approach is not able to cope with non uniformities introduced by some sample absorption profiles or in some intensity illumination distributions.
Again the technique described cannot be applied to a non-uniform intensity distribution.
This approach is based on a method of orthogonal expansions and can be computationally complex in implementation.
In many applications this complexity makes the technique impractical.

Method used


Image

  • Phase determination of a radiation wave field
  • Phase determination of a radiation wave field
  • Phase determination of a radiation wave field

Examples


example 1

Simulations with Normally Incident Plane Wave Irradiation

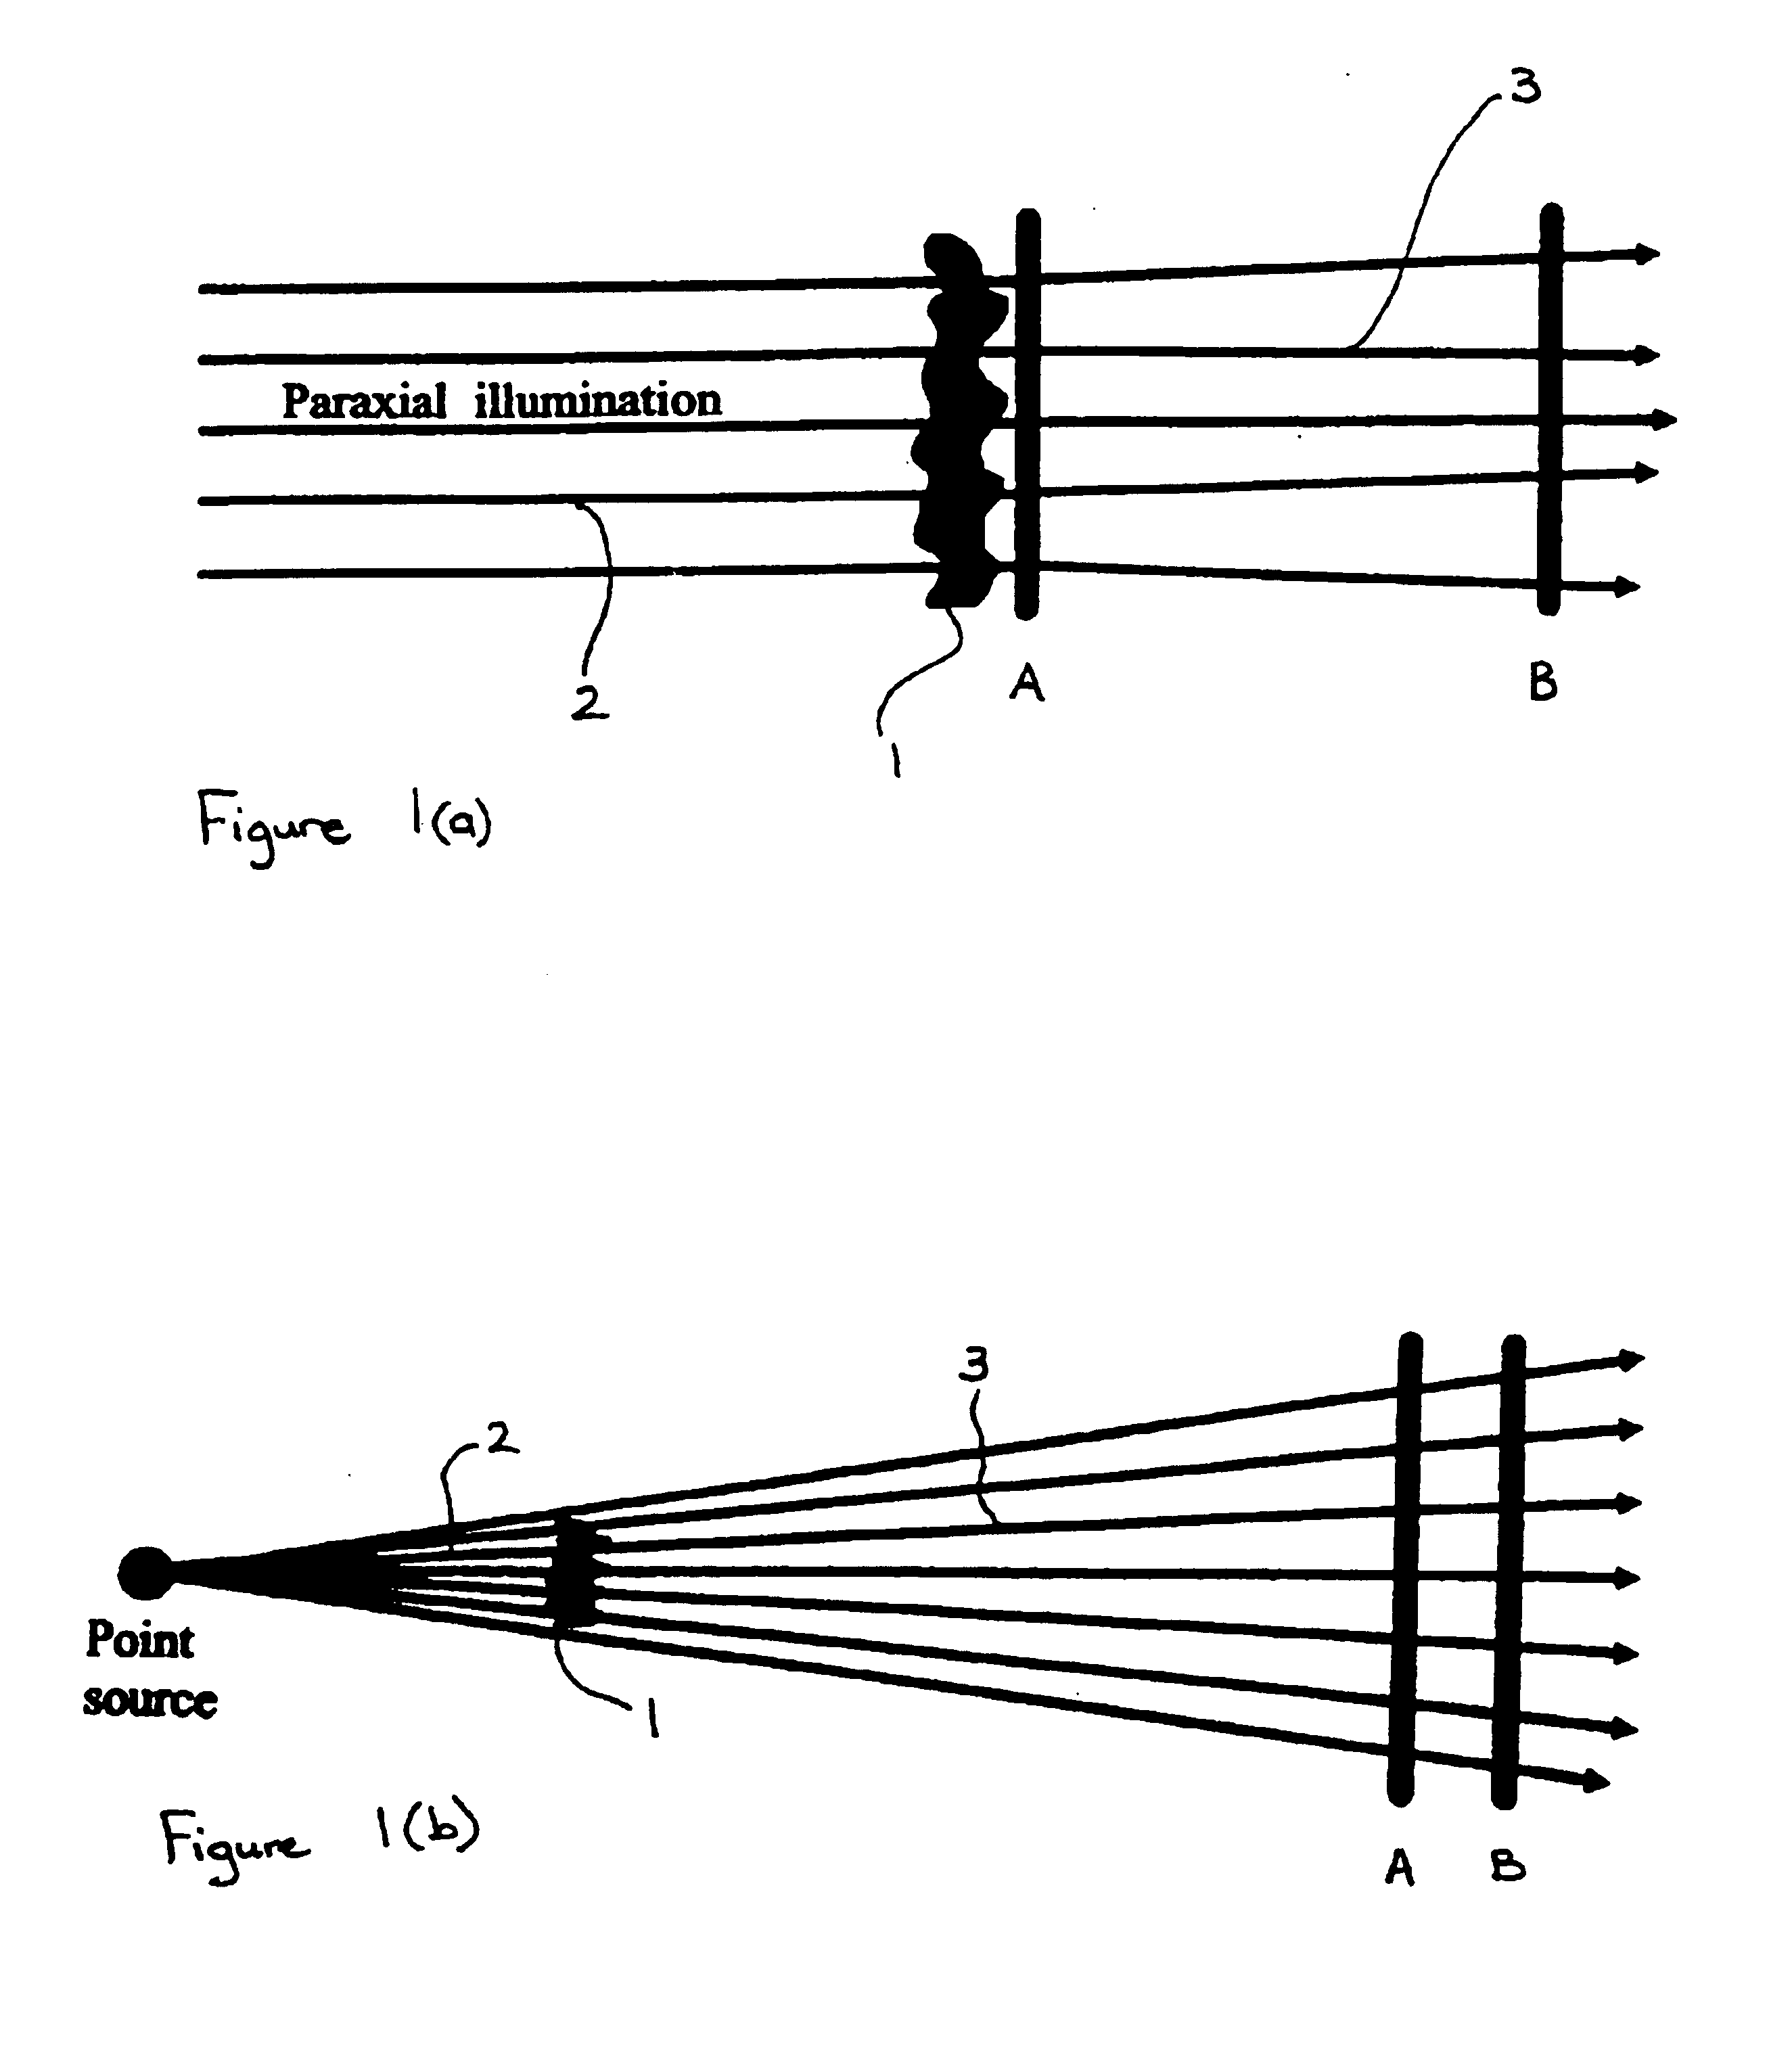
[0169]A simulation was conducted in accordance with the arrangement shown in FIG. 1(a) corresponding to planar illumination. The example shows the operation of the method on simulated noise-free data. Diffraction patterns are calculated using the “angular-spectrum” formalism, an orthodox procedure. FIGS. 3(a) to 3(f) show images produced in the simulation.

[0170]Dimensions of all images are 1.00 cm square and provide a sampling array of 256×256 pixels in a plane extending perpendicularly across the propagation direction of the radiation. The wavelength of the light was taken to be 632.8 nm. The intensity in the plane z=0, which varies from 0 to 1 in arbitrary units, is shown in FIG. 3(a). Within the area of nonzero illumination, the minimum intensity was 30% of the maximum intensity. (The black border around the edge of the intensity image corresponds to zero intensity.) The input phase, which varies from 0 to π radians, is sho...

example 2

Point Projection Microscopy

[0174]As shown in FIG. 5, radiation such as X-rays, visible light or electrons from a point source 10 is allowed to propagate through free space to the object 11, located at a distance dso from the source. The radiation passes through the object 11, and is allowed to propagate a further distance dod to one of the image planes I1, I2 . . . In in which the intensity of the radiation is detected. This detection is performed using a standard device such as a CCD camera, image plate or other device capable of registering and digitising the intensity distribution. One or both of the distances dso and / or dsd is then changed so as to introduce defocus into the images and the intensity distribution is measured once again. The case of dod=0 corresponding to contact-imaging with zero propagation distance is included as one possible measurement.

[0175]The intensity data is then processed using the above phase recovery method, to recover the decoupled intensity and phas...

example 3

Quantitative Phase Amplitude Microscopy

[0178]FIG. 6 schematically shows an arrangement for quantitative phase amplitude microscopy. A sample is illuminated using a source of white light Köhler illumination 15, commonly found on optical microscopes. The light is transmitted through an object 16 and collected by a microscope imaging system 17 and relayed to a CCD camera 18 or other digital imaging device having a planar imaging surface. Three images are collected: an in-focus image, Io, and two slightly out of focus images I+ and I−. The defocus is obtained by suitable means such as a drive system 19 to adjust the microscope focus knob. The defocus introduced is usually quite small so that degradation in spatial resolution is minimised, although the optimal amount of defocus to use is determined by sample properties and imaging geometry such as magnification, numerical apertures, etc.

[0179]When taking the images the numerical aperture of the condenser is chosen to be less than the num...


PUM


Abstract

A method of quantitative determination of the phase of a radiation wave field including the steps of producing a representative measure of the rate of change of intensity of the radiation wave field over a selected surface extending generally across the wave field; producing a representative measure of intensity of the radiation wave filed over the selected surface; transforming the measure of rate of change of intensity to produce a first integral transform representation and applying to the first integral transform representation a first filter corresponding to the inversion of a first differential operator reflected in the measure of rate of change of intensity to produce a first modified integral transform representation; applying an inverse of the first integral transform to the first modified integral transform representation to produce an untransformed representation; applying a correction based on the measure of intensity over the selected surface to the untransformed representation; transforming the corrected untransformed representation to produce a second integral transform representation and applying to the second integral transform representation a second filter corresponding to the inversion of a second differential operator reflected in the corrected untransformed representation to produce a second modified integral transform representation; and applying an inverse of the second integral transform to the second modified integral transform representation to produce a measure of phase of the radiation wave field across the selected plane.

Description

FIELD OF THE INVENTION[0001]This invention relates to the determination of phase of a radiation wave field.[0002]The invention also relates to a range of applications in which phase information about a radiation wave field can be used. As used in this specification the term “radiation wave field” is intended to include all forms of radiation that propagate in a wave like manner including but not limited to examples such as X-rays, visible light and electrons.BACKGROUND OF THE INVENTION[0003]Techniques for the measurement of the phase of a radiation wave field have many applications in fundamental physics and as a basis for a number of measurement techniques involving various physical properties. Examples of applications of phase measurement techniques include the fields of x-ray imaging, electron microscopy, optical microscopy as well as optical tomography and x-ray phase tomography.[0004]Phase is typically measured using interferometers of various types. The key feature of interfer...

Claims


Application Information

Patent Timeline
Patent Type & Authority Patents(United States)
IPC IPC(8): G01B9/02G01J9/00G02B27/46G06T5/10
CPCG01J9/00G02B27/46G06T5/10G01B9/02084G06T5/002G01B9/02083G06T2207/20056G01J9/02G01J1/44G01J2009/0203G01J2003/282
Inventor NUGENT, KEITHPAGANIN, DAVIDBARTY, ANTON
Owner MELBOURNE UNIV OF THE
Why Eureka
Try Eureka