Method and apparatus for processing electrochemical signals

a technology of electrochemical signals and processing methods, applied in the direction of liquid/fluent solid measurement, material electrochemical variables, instruments, etc., can solve the problems of reducing the selectivity and concentration reading of electrodes, inaccurate readings, and erroneous readings, so as to improve the selectivity and productivity of sensors

Active Publication Date: 2006-08-15
AGAMATRIX INC
View PDF22 Cites 140 Cited by
  • Summary
  • Abstract
  • Description
  • Claims
  • Application Information

AI Technical Summary

Benefits of technology

[0011]Systems and methods are provided herein for improving the selectivity and productivity of sensors via digital signal processing techniques. According to one illustrative embodiment, in an electrochemical method for monitoring of a select analyte in a mixed sample with an interfering analyte, an improvement is provided that includes applying a large amplitude potential

Problems solved by technology

Electrochemical biosensors are an attractive offering due to their low cost and ease of manufacture, however other blood chemicals, such as ascorbic acid (vitamin C), acetaminophen (“TYL” in FIG. 1), and uric acid can interfere with the biosensor action resulting in erroneous readings. FIG. 1 shows the effect of the interferent ascorbic acid (“C”), in which a molecule of ascorbic acid 5 has diffused through the enzyme layer, been directly oxidized by the electrode 1, and generated a current 7.
The current generated at the electrode results from all analytes from the sample that can be electro-oxidized or electro-reduced at the given elect

Method used


Image

  • Method and apparatus for processing electrochemical signals
  • Method and apparatus for processing electrochemical signals
  • Method and apparatus for processing electrochemical signals

Examples


example 1

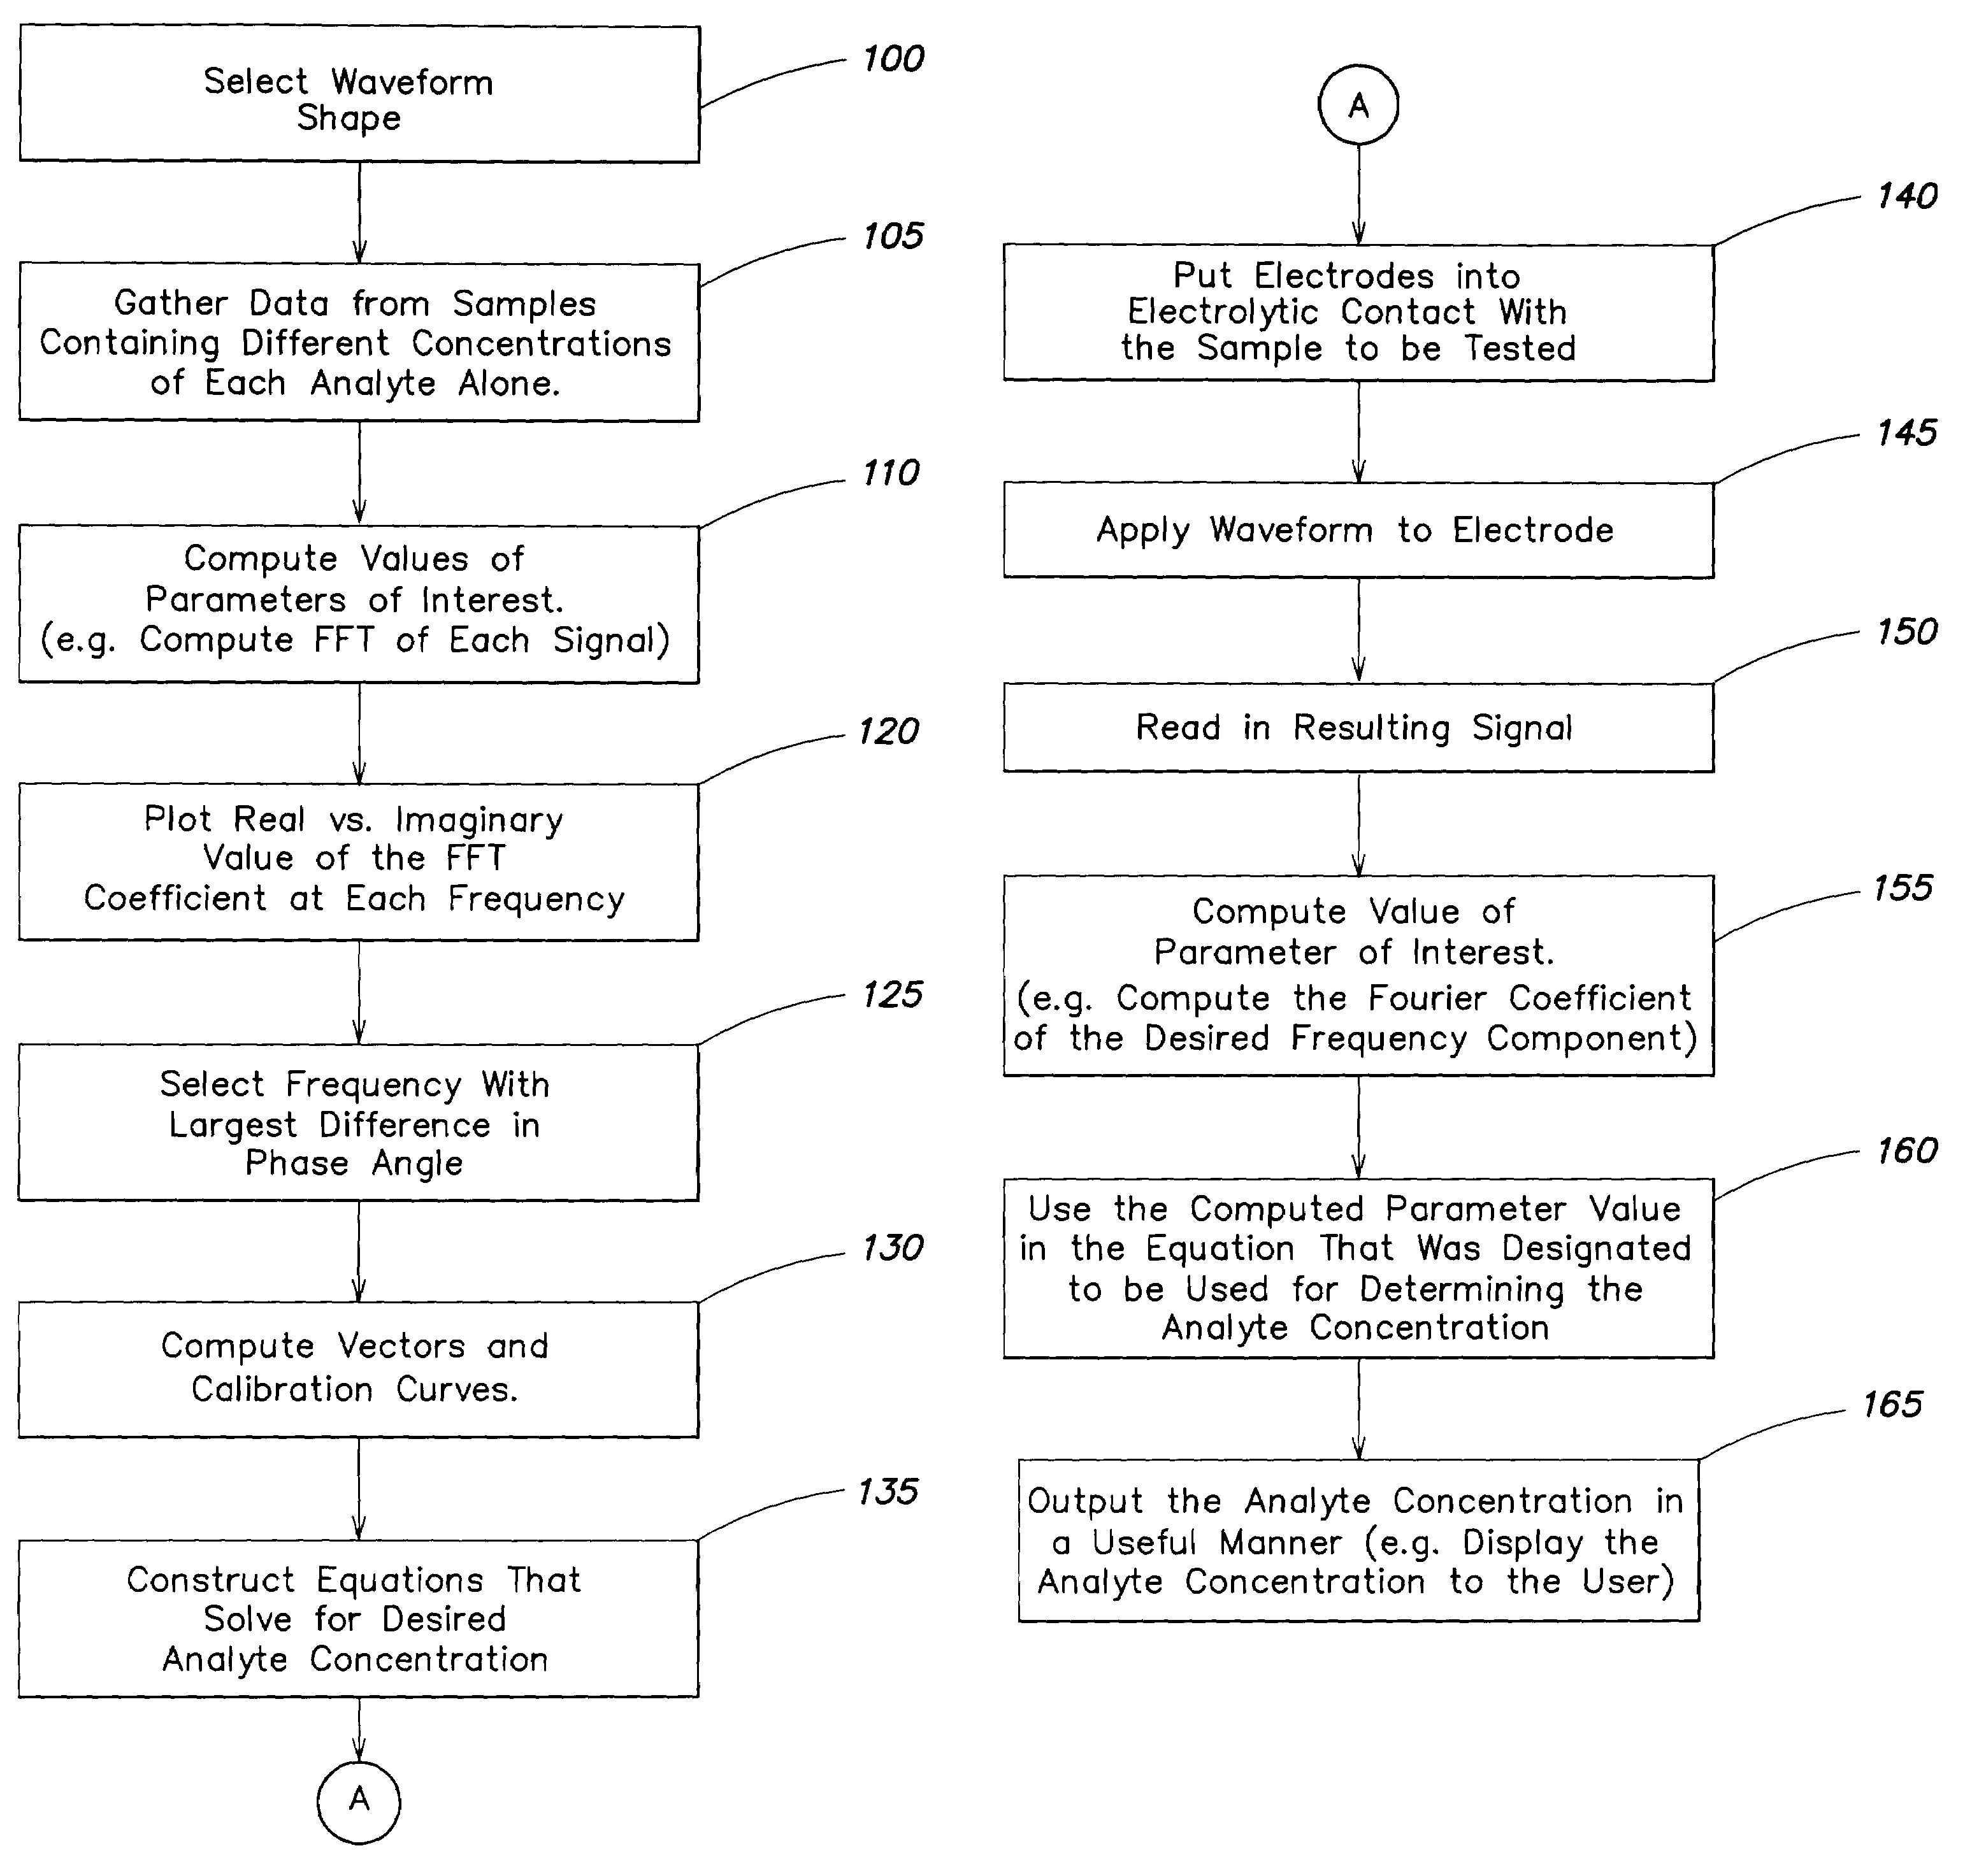
[0067]An example of the method of FIG. 6 and system as carried out by, for example, a system of FIG. 7, is now described in terms of analyzing the concentration of a sample containing peroxide and ascorbic acid. A 700 mV potential stimulus waveform shown in FIG. 9 was used (step 100). The scan rate of the stimulus waveform was 100 mV per second in both the upscan and downscan directions. The resulting current was sampled in time at a sampling frequency of 40 hz. The spectral content of the current signal was computed with the fast Fourier transform (step 110).

[0068]FIG. 10 shows the complex Fourier coefficients for 0.4506 hz, which had the best separation between the analyte vectors. The open squares represent measurements made with the sample that contained peroxide and no ascorbic acid. The black triangles represent measurements made with a sample that contained ascorbic acid and no peroxide. (See steps 105–120). Vector 101 represents the baseline background signal ({right arrow o...

example 2

[0101]An example was performed using the method shown in FIG. 14. Glucose was the target analyte with ascorbic acid acting as the interferent, and blood as the sample matrix. The waveform shown in FIG. 16 was selected as the stimulus to be applied to the sample.

[0102]The waveform combines both cyclic voltammetry and DC amperometry. The potential is ramped in the upward direction at 250 mV / s, in the downward direction at −250 mV / s (the CV part of the signal), and is held constant at 0.4 V beginning at 57.6 seconds and ending at 64 seconds (DC amperometric part of the signal).

[0103]The “head” of the signal refers to the signal collected with this waveform between 0 seconds and 20.8 seconds, inclusive. In this case, the signal is sampled at 40 Hz, thereby providing 833 samples. The “tail” of the signal refers to the signal collected with this waveform between 61.475 seconds and 63.975 seconds, inclusive, giving 101 samples.

[0104]In this example, the following principles were observed.[...


PUM


Abstract

Systems and methods are provided herein for improving the selectivity and productivity of sensors via digital signal processing techniques. According to one illustrative embodiment, in an electrochemical method for monitoring of a select analyte in a mixed sample with an interfering analyte, an improvement is provided that includes applying a large amplitude potential stimulus waveform to the sample to generate a nonlinear current signal; and resolving a signal contribution from the select analyte in the generated signal by a vector projection method with an analyte vector comprising a plurality of real and imaginary parts of one or more Fourier coefficients at one or more frequencies of a reference current signal for the select analyte.

Description

[0001]This application claims priority to provisional application 60 / 350,175, filed Jan. 15, 2002.BACKGROUND OF THE INVENTION[0002]Since their advent in the 1960s, the use of biosensors has become widespread. A biosensor is a device that couples a biological recognition element (e.g., an enzyme or antibody), with a transducer (e.g., an electrode or photodiode), to convert biochemical information into an electric signal.[0003]FIG. 1 shows the action of a glucose biosensor that includes an enzyme coated electrode 1 to which a voltage potential is applied. The biosensor of FIG. 1 is an example of amperometric detection in which a voltage is applied to the electrode 1 which causes a particular analyte (the substance being measured) in the sample to oxidize or (i.e., give up electrons to the electrode). The oxidation cause a current 3 to be generated which can then be detected and analyzed. The potential at which the analyte oxidizes is called the “oxidation potential” of the analyte.[00...

Claims


Application Information

Patent Timeline
IPC IPC(8): G01N27/26C12Q1/00G01N27/416G01N31/00G01N27/48G01N27/49
CPCG01N27/3274C12Q1/00C12Q1/54G01N27/26
Inventor IYENGAR, SRIDHAR G.HAAS, DANIELBOLON, CRAIG
Owner AGAMATRIX INC
Why Eureka
Try Eureka