Apparatus and systems for processing samples for analysis via ion mobility spectrometry
a technology of ion mobility spectrometry and apparatus, which is applied in the direction of corona discharge, separation process, instruments, etc., can solve the problems of increasing reducing its utility, and difficulty in conversion into a gas phase, so as to reduce the complexity of the dms spectra generated, the effect of increasing the utility
- Summary
- Abstract
- Description
- Claims
- Application Information
AI Technical Summary
Benefits of technology
Problems solved by technology
Method used
Image
Examples
experimental examples
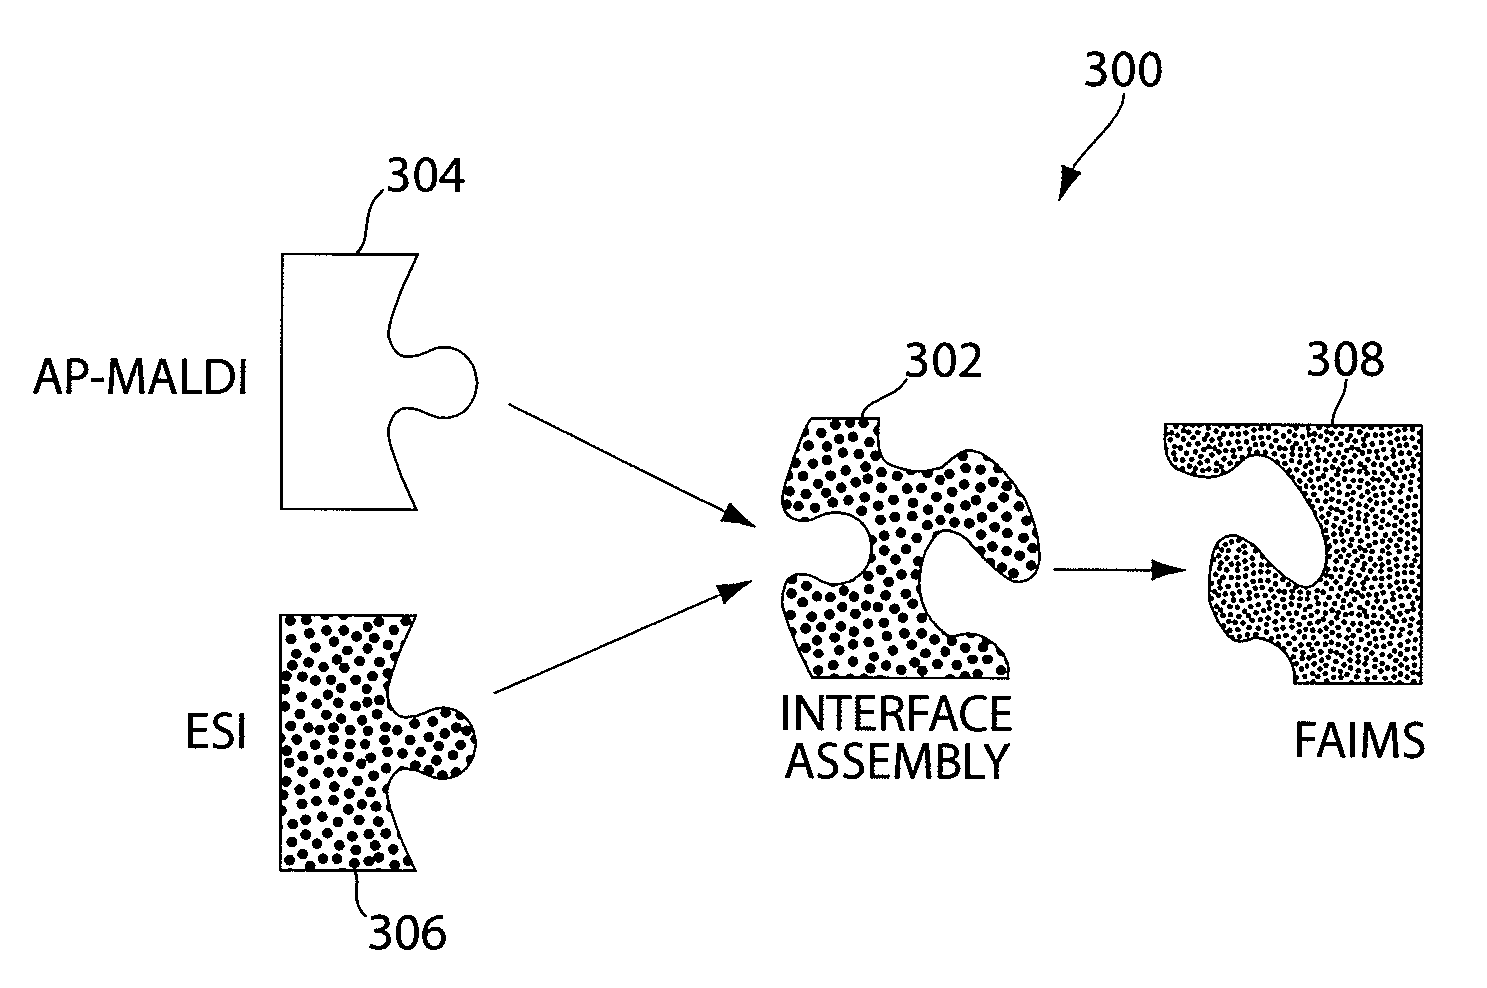
[0100]Experiments were conducted to demonstrate the workability of various embodiments of the invention. In the experiments, ESI and AP-MALDI systems, manufactured by Agilent Technologies of Palo Alto, Calif., were used. These units are described in more detail hereinabove, and operational details are described hereinbelow with respect to each experiment. The experiments use the AP-MALDI matrix, α-cyano-2-hydroxycinnamic acid, manufactured by Agilent Technologies. The experiments also use methyl tert-butyl ether, product number 306975, manufactured by Sigma Aldrich; the protein, bovine serum albumin (BSA), product number A7638, manufactured by Sigma Aldrich; and the protein, ubiquitin, product number U-6253, manufactured by Sigma Aldrich.
experiment 1
MS (DMS) Experiment with α-Cyano-2-Hydroxycinnamic Acid
[0101]An example of AP-MALDI-DMS operation was conducted with α-cyano-2-hydroxycinnamic acid, a matrix substance used in AP-MALDI. A small area of 2 μg crystallized α-cyano-2-hydroxycinnamic acid was ablated and introduced into the DMS sensor. FIG. 16 is a graph 1600 showing Fourier transform plots of concatenated spectra of α-cyano-2-hydroxycinnamic acid and a blank, using the above-described interface assembly (without the voltage divider setup shown in FIG. 14). The red and green traces in FIG. 16 were produced by applying the Fast Fourier Transform algorithm to calculate the Discrete Fourier Transform of a chronologically concatenated vector of DMS scans. The graph 1600 shows the magnitude of the first 500 hundred calculated frequency values produced by the transform operation. The green trace represents the magnitude of the transform of data taken when α-cyano-2-hydroxycinnamic acid was ablated, while the red line represent...
experiment 2
MS) Experiment with Methyl Tert-Butyl Ether
[0103]ESI-DMS spectra of various organic and biological molecules including methyl t-butyl ether, desmosine, urea, bovine serum albumin (BSA), and leucine-enkephalin have been obtained (only results with methyl tert-butyl ether in water are shown in FIGS. 17 and 18). FIG. 17 is a graph showing a Fourier transform plot 1700 of ESI / FAIMS spectral of 10 μM solution of methyl tert-butyl ether in water, using the interface assembly described hereinabove.
[0104]The x-axis corresponds to the scans taken during the entire DMS analysis. Scans 0-60 are DMS background with all other components off. During scans 60-120, the high voltage on the HVA was turned on; the sample began infusion into the ESI needle, and subsequently the DMS, during scans 120-190. From 190-250, the high voltage of the orifice was turned off. As can be seen, a change in the plot around scan 120 is observed. This response corresponds to the time when sample was being introduced in...
PUM
 Abstract
Description
Claims
Application Information
 - R&D
- Intellectual Property
- Life Sciences
- Materials
- Tech Scout
- Unparalleled Data Quality
- Higher Quality Content
- 60% Fewer Hallucinations
Browse by: Latest US Patents, China's latest patents, Technical Efficacy Thesaurus, Application Domain, Technology Topic, Popular Technical Reports.
© 2025 PatSnap. All rights reserved.Legal|Privacy policy|Modern Slavery Act Transparency Statement|Sitemap|About US| Contact US: help@patsnap.com


