Method for controlling the appearance of products and process performance by image analysis

Inactive Publication Date: 2012-03-06
MCMASTER UNIV
View PDF15 Cites 4 Cited by
  • Summary
  • Abstract
  • Description
  • Claims
  • Application Information

AI Technical Summary

Benefits of technology

[0015]The applications for which the invention are suitable include optimizing and controlling flotation froth in industrial mineral flotation processes, in particular froth flotation of zinc concentrate and zinc concentrate, optimizing surface quality of plastic injection molded materials; and creating suitable formulations for the production of artificial counter tops.

Problems solved by technology

However, most successful techniques and their applications in this area have been confined to a specific type of environment where certain assumptions can be made about the scene.

Method used


Image

  • Method for controlling the appearance of products and process performance by image analysis
  • Method for controlling the appearance of products and process performance by image analysis
  • Method for controlling the appearance of products and process performance by image analysis

Examples


example 1

Control of Flotation Froth Appearance / Health in Industrial Mineral Flotation Process

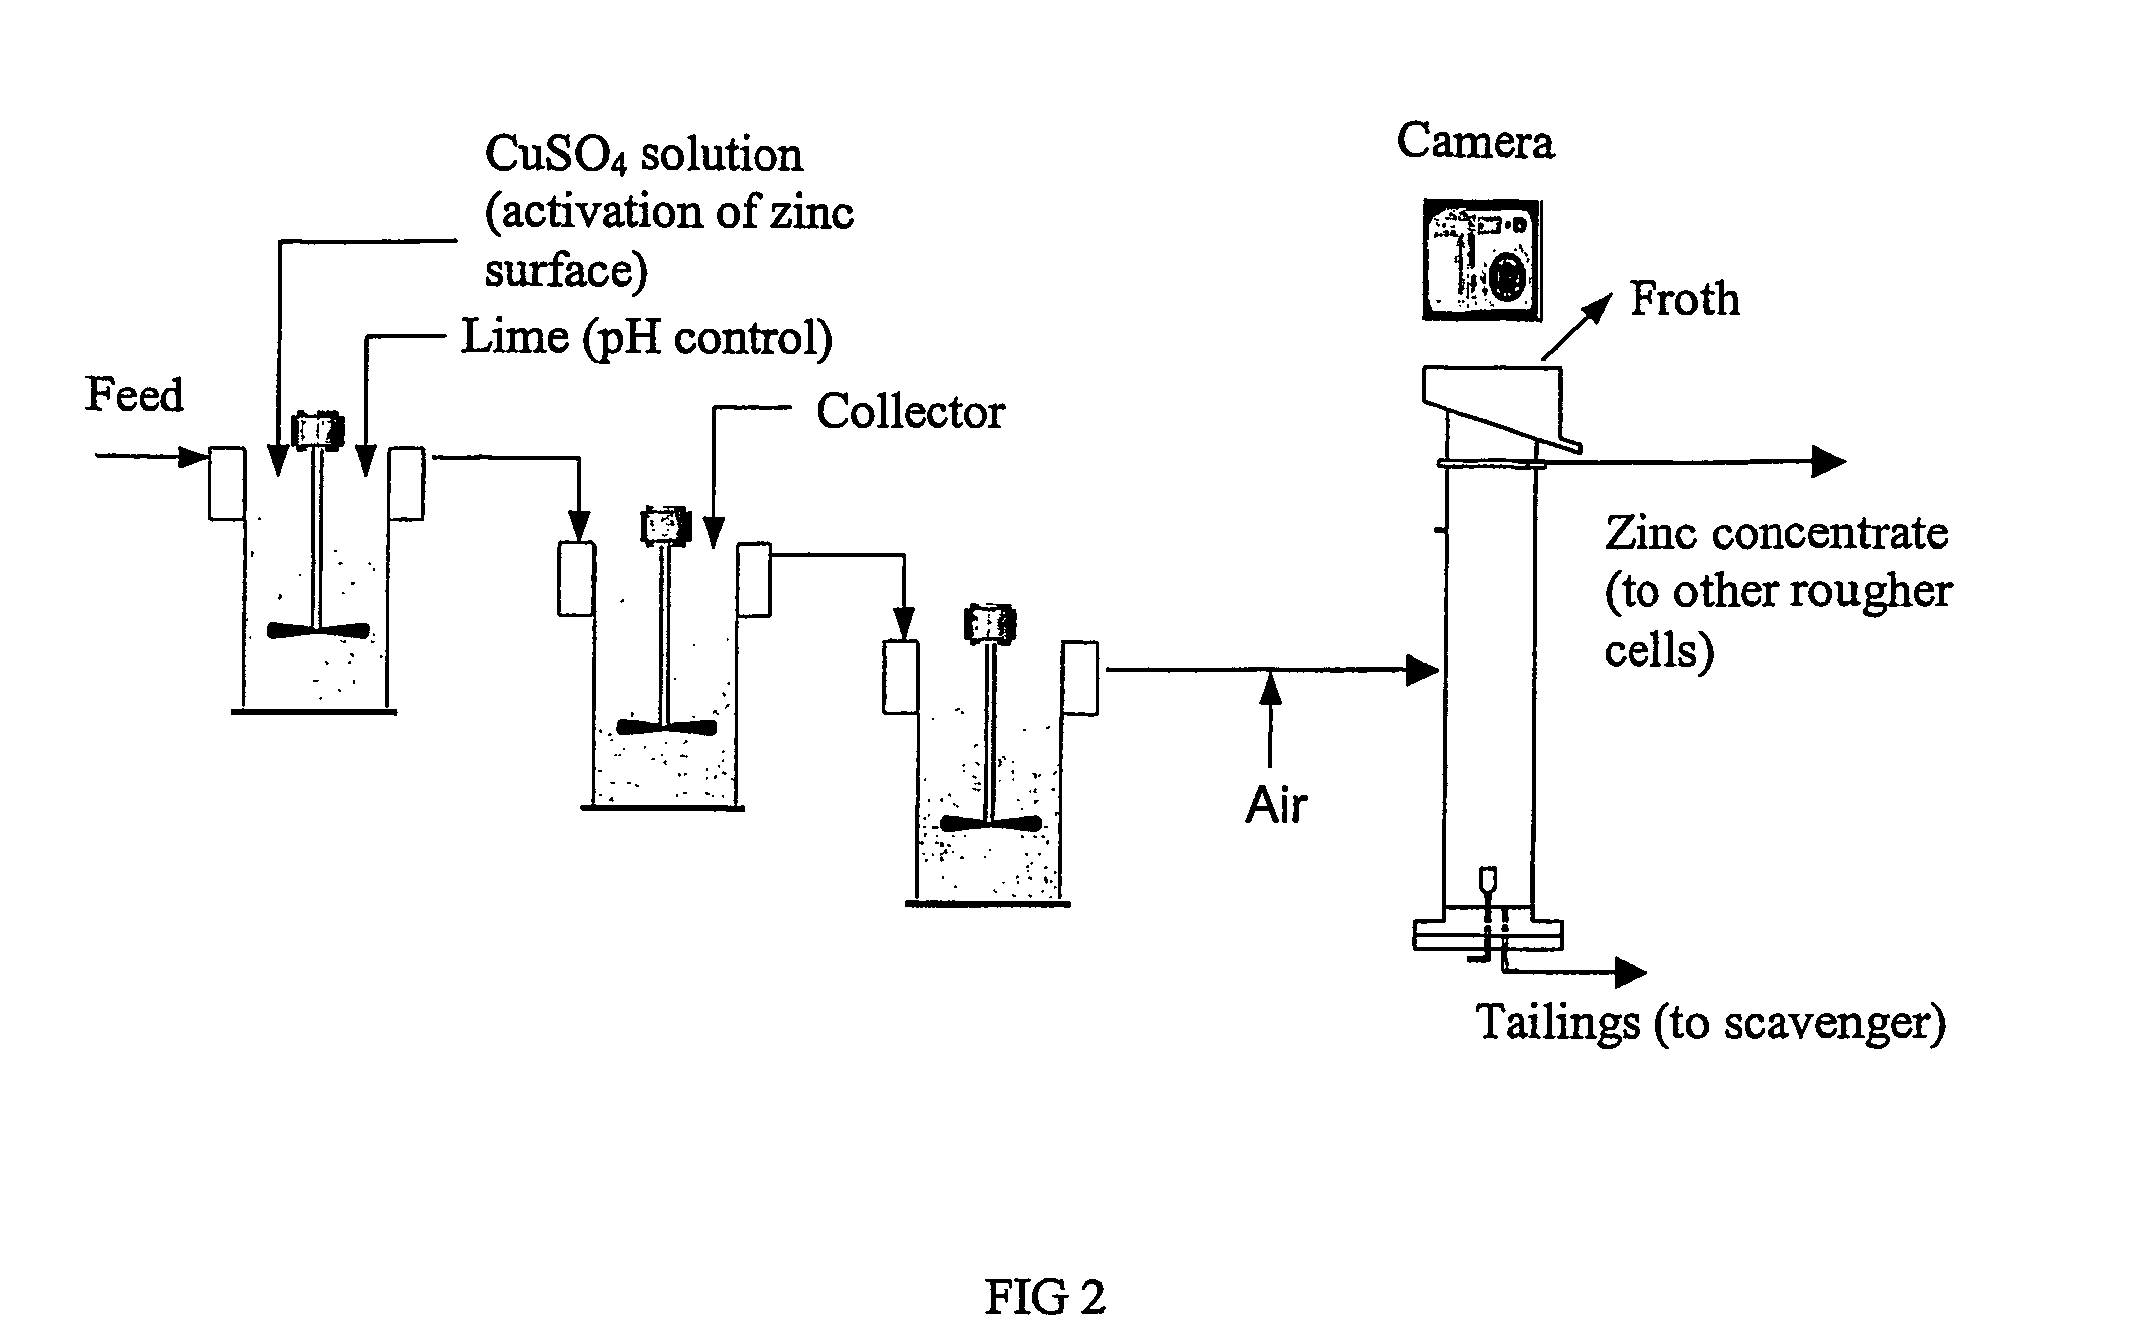
[0072]FIG. 2 is a schematic process diagram of part of Agnico-Eagle's Laronde plant in Quebec, Canada. The camera was installed on top of the flotation column. It samples 24-bit, 720′480 (width′height) color images at every minute. The manipulated variables include pH level, froth level, air flow rate, CuSO4 flow rate, and collector flow rate. Currently, operators change some of these manipulated variables by observing and assessing froth status. Typical froth status described by operators is shown in FIG. 3.

Image Acquisition 20

[0073]RGB images collected every 30 sec by an automated imaging system.

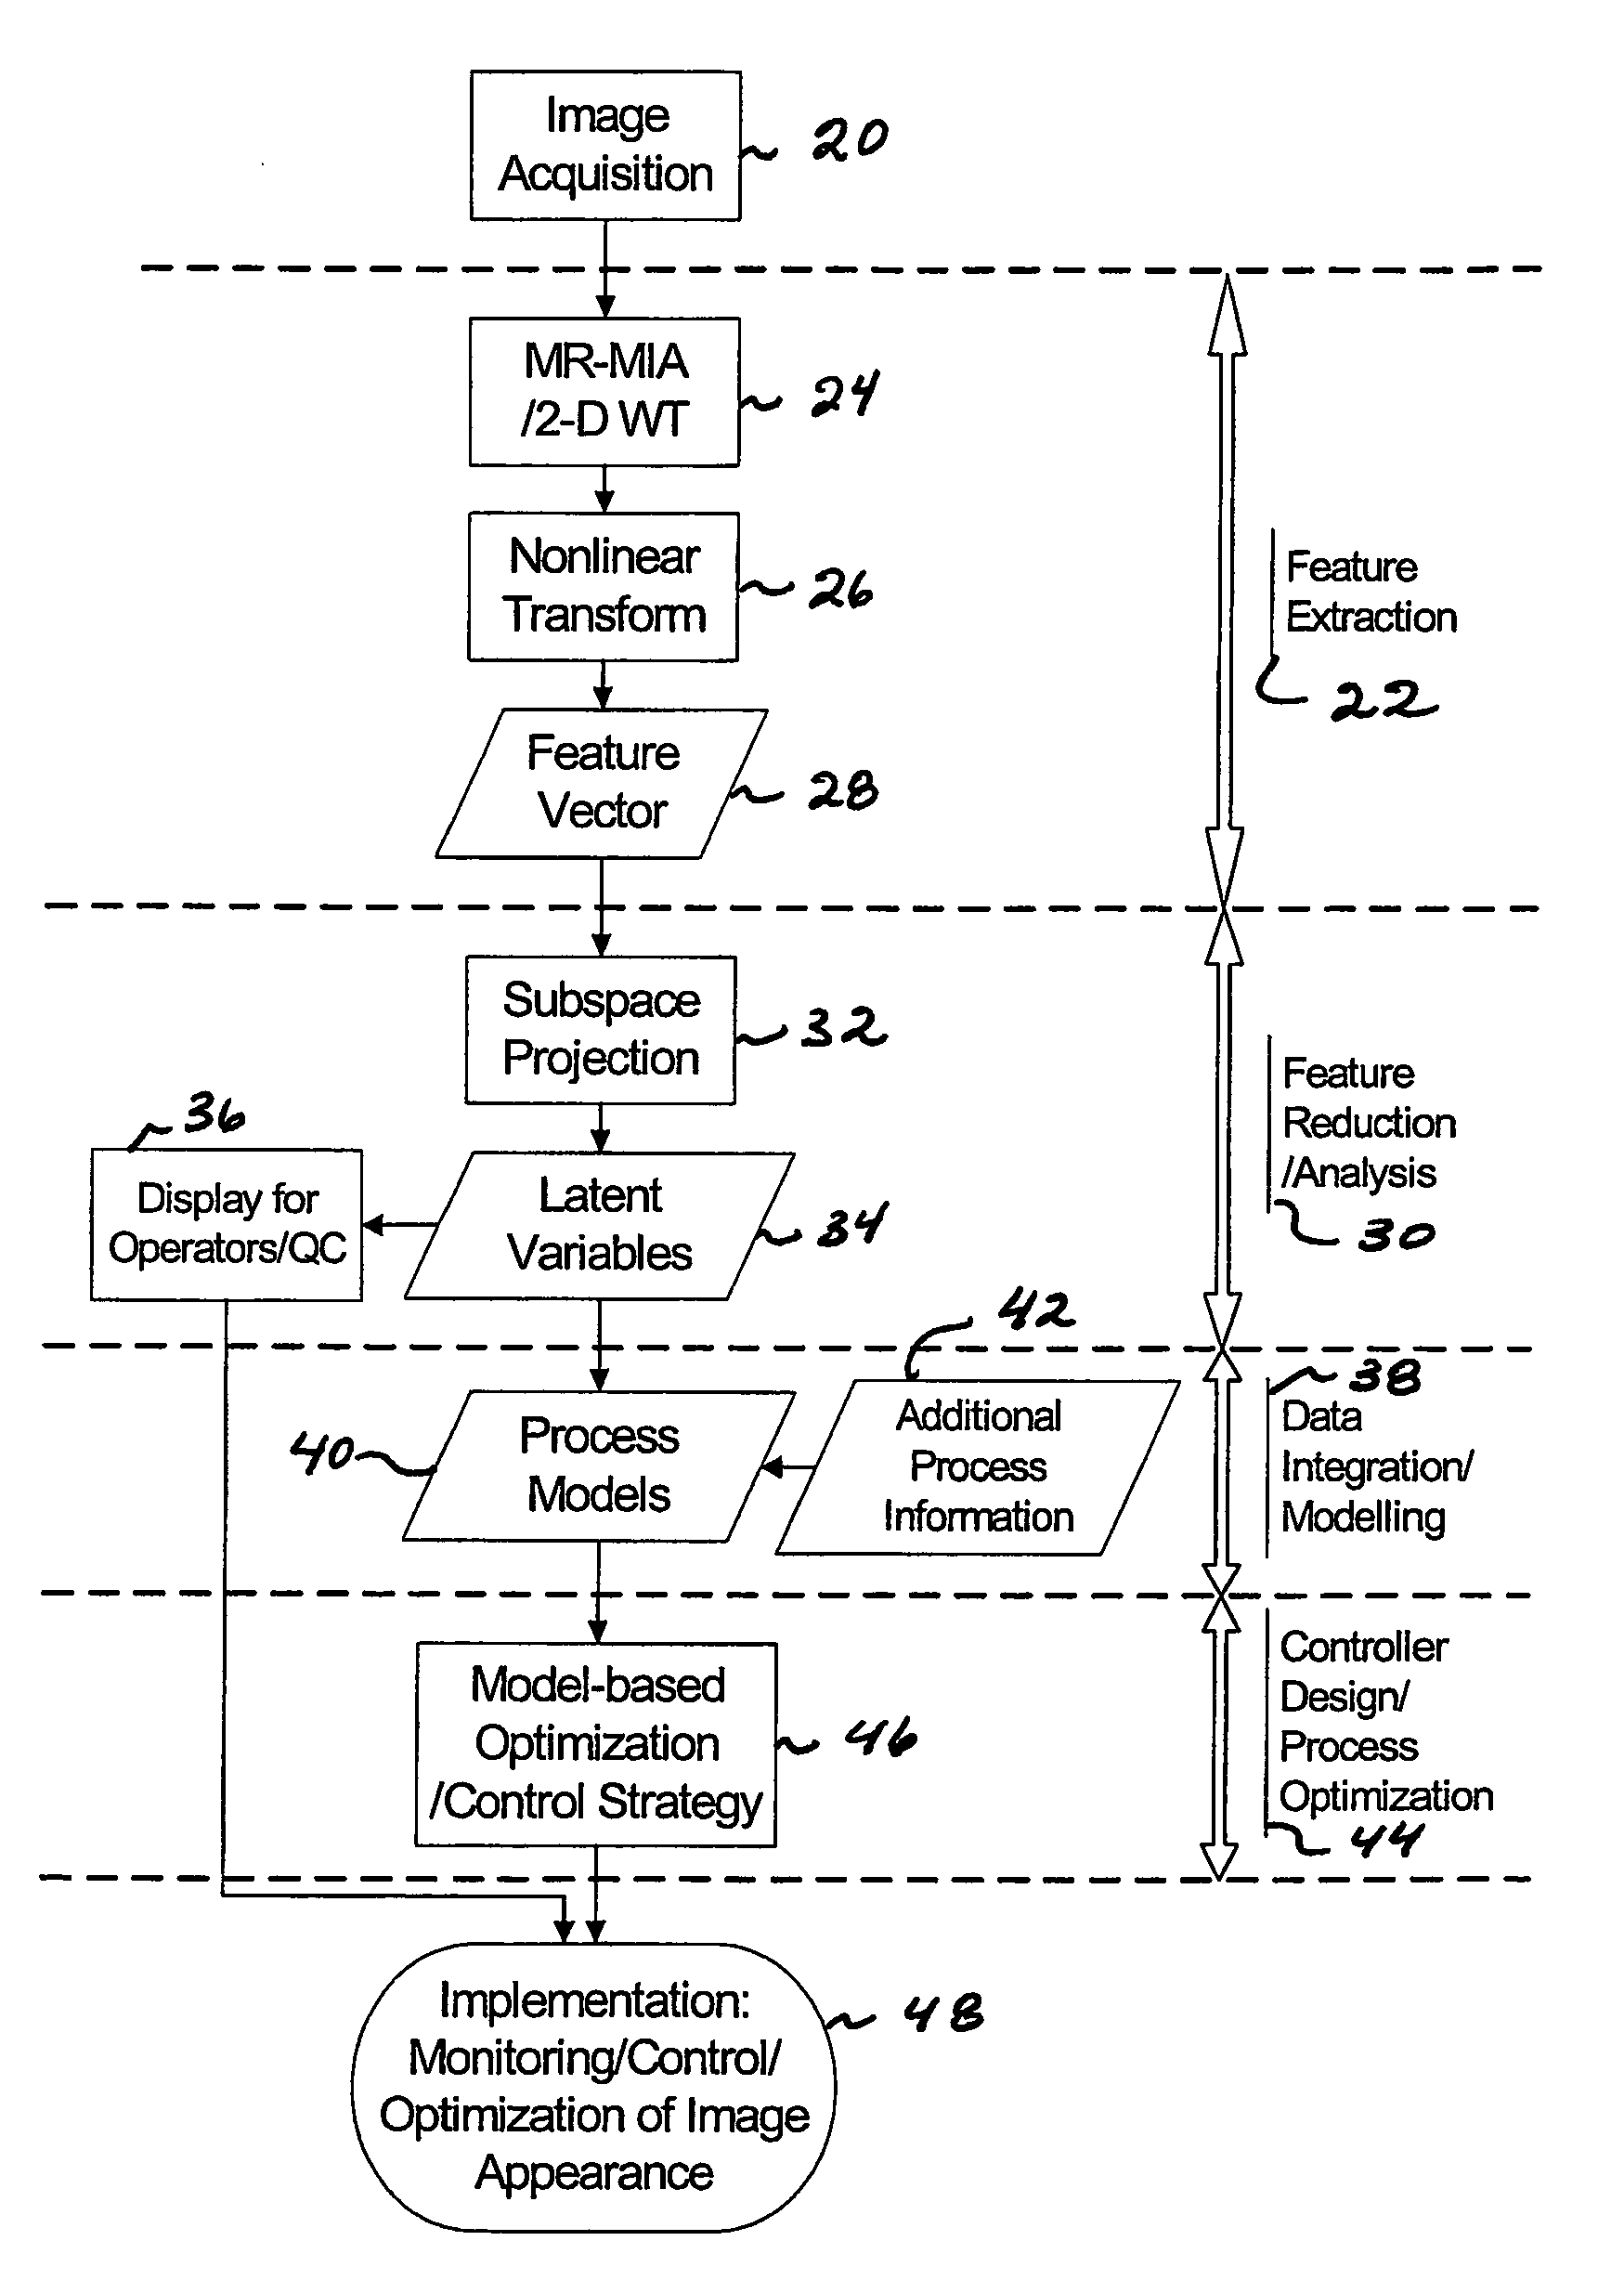
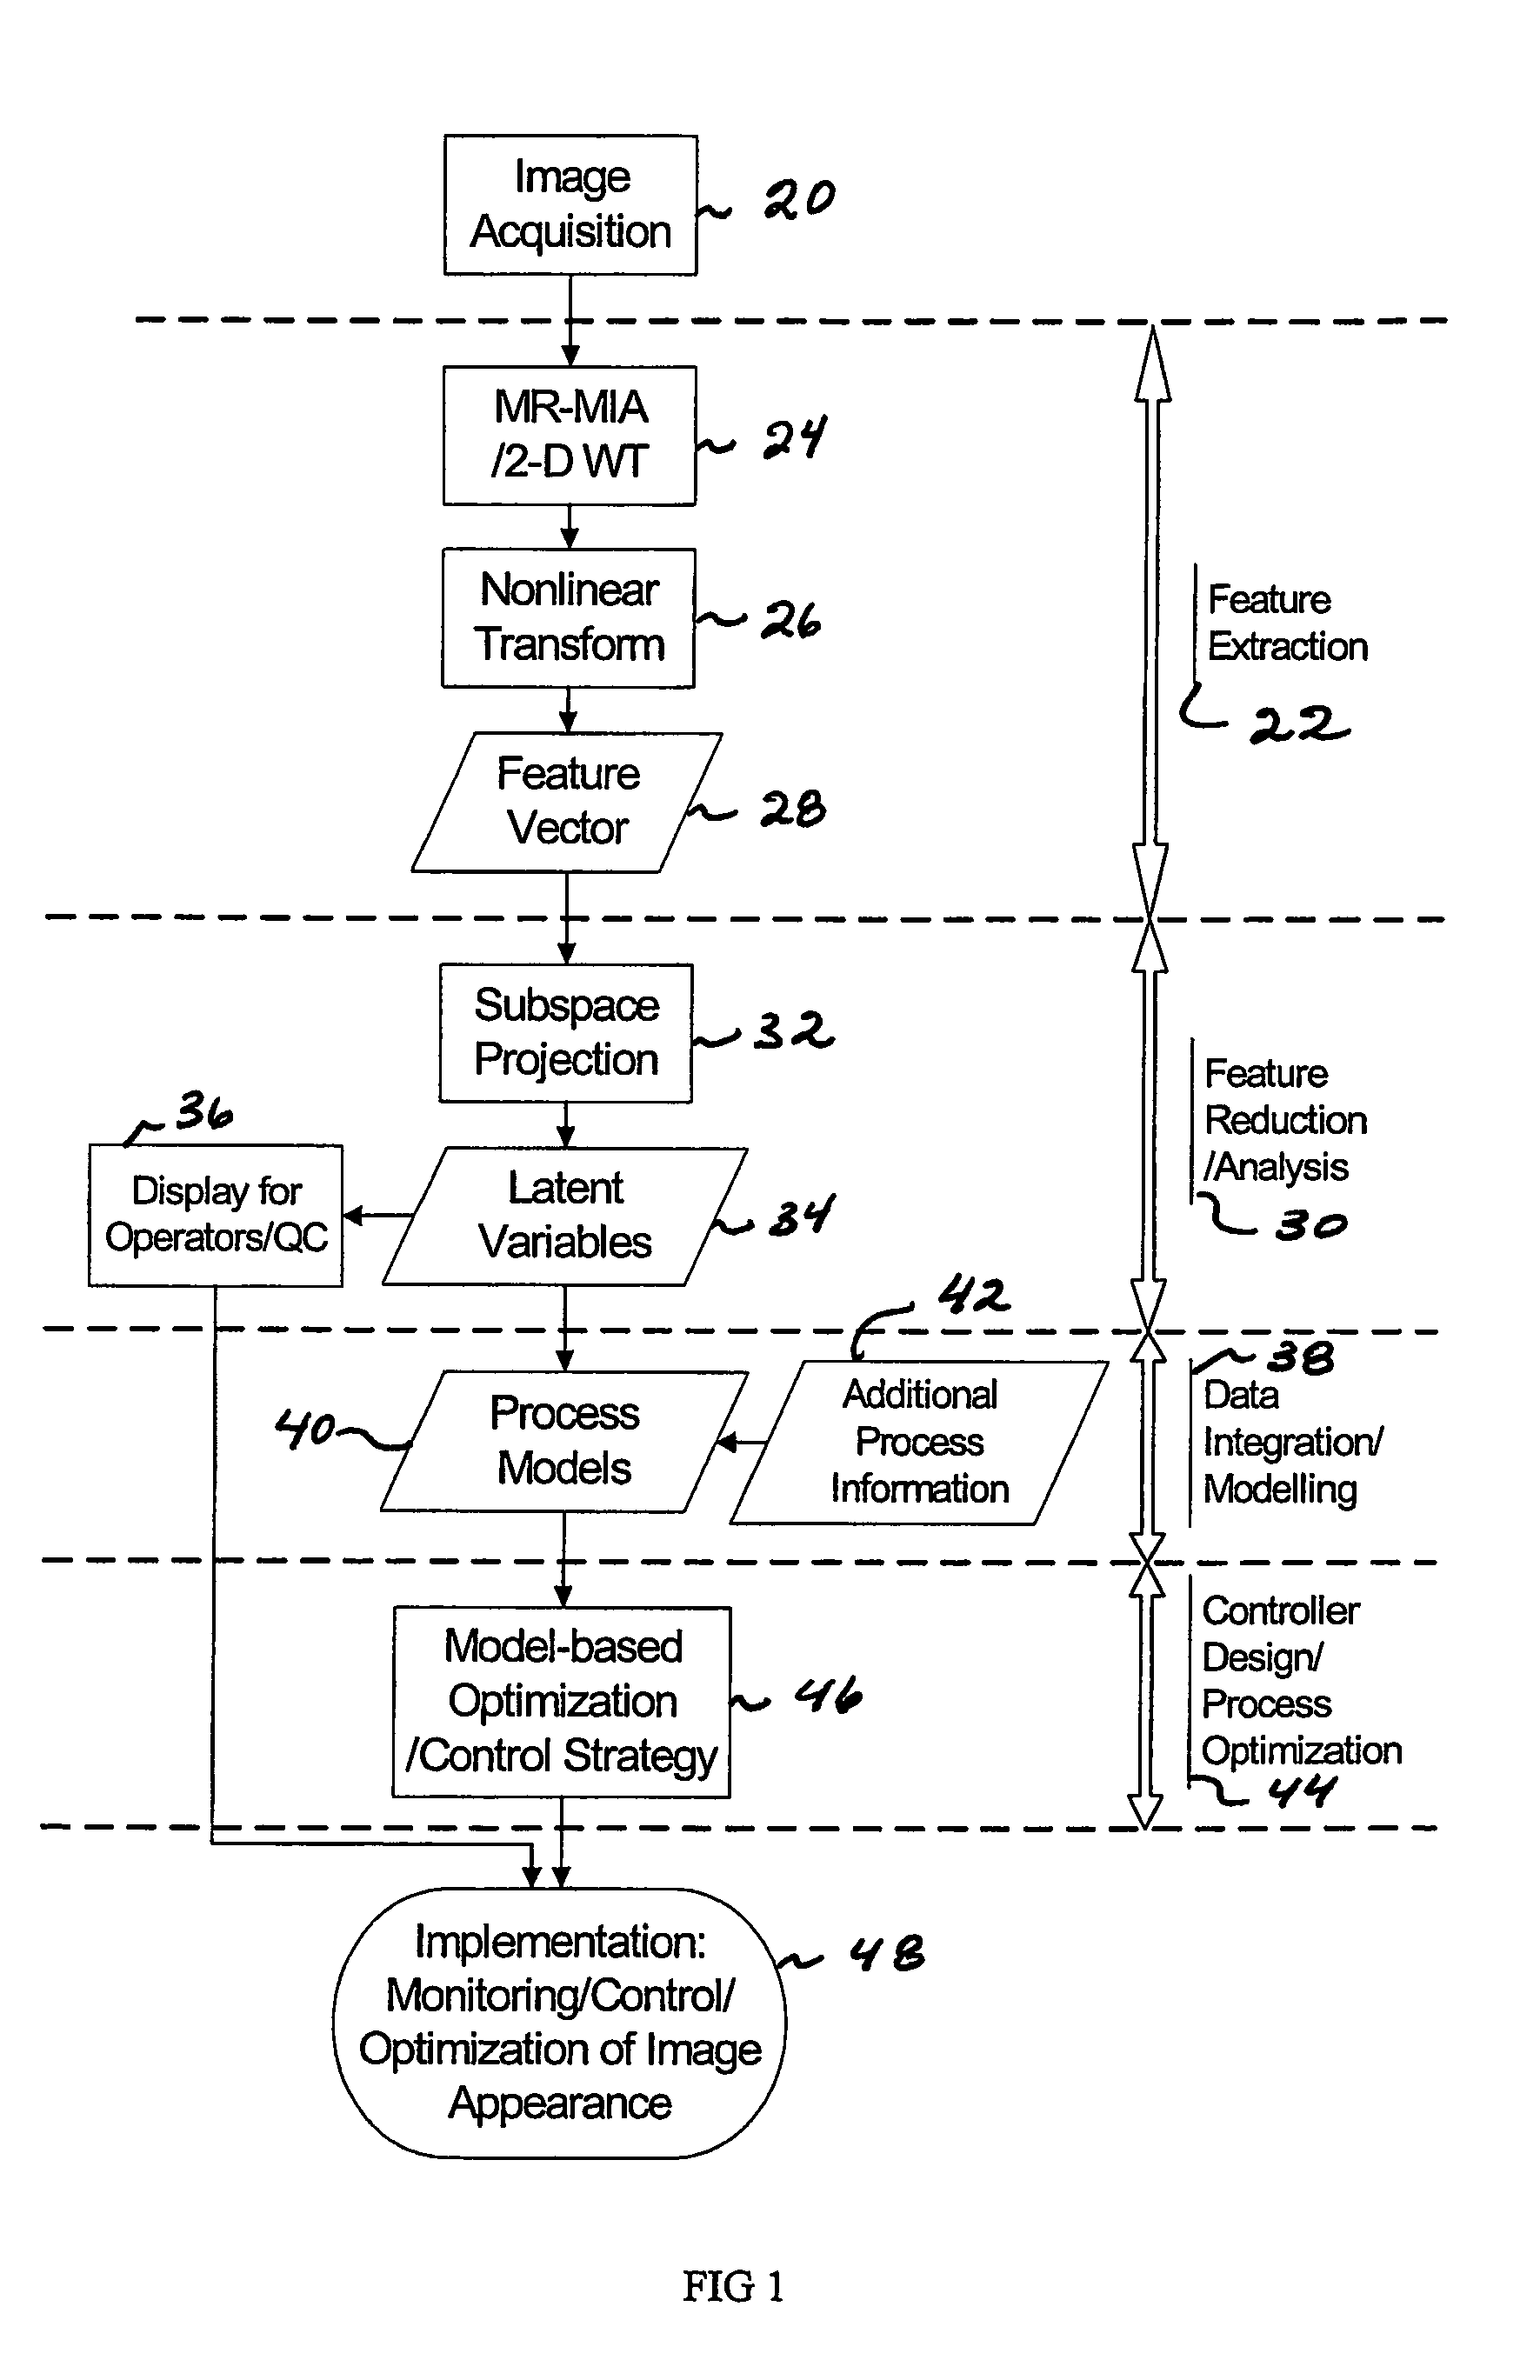
[0074]Feature Extraction 22

[0075]Features used by the operators for the basis of the assessment are clear windows (see the image in the left above), black holes (see the image in the right above), and bubble size distribution. Using MR-MIA, a wavelet size signature analysis is used to extract information re...

example 2

Optimization of Plastic Parts in an Industrial Injection-Molding Process

Image Acquisition 20

[0086]Grayscale images were collected off-line in a QC laboratory.

Feature Extraction 22

[0087]After performing a 5 level discrete wavelet transform the standard deviations of the sub-images were calculated as features.

Feature Reduction / Analysis 30

[0088]Performing a PCA on the feature vectors from the images shows four significant principal components PCs. Based on the t1-t2 score plot in FIG. 7 and the t3-t4 plot in FIG. 8 interpretations of four PCs are as possible; (1) t1 represents presence of any visible patterns in the images, (2) t2 represents presence of structured (horizontal, vertical, and diagonal) wave patterns, (3) t3 represents presence of vertical (positive direction) wave patterns, and (4) images in the negative t4 direction have low intensity and vertical wave patterns.

Process Modeling / Data Integration 38

[0089]A linear PLS model is built using three operating conditions as x-va...

example 3

Quality Control of Appearance in Manufacture of Artificial Countertops

Image Acquisition 20

[0091]Color images were collected off-line at the quality control QC laboratory for different products (1) a black and white countertop—discussed below, and a brown, white, grey and black one.

Feature Extraction 22

[0092]After performing a 5 level discrete wavelet transform (DWT), the energies of each sub-image were calculated as features.

Feature Reduction / Analysis 30

[0093]Performing a PCA on the feature vectors of the images shows three significant PCs and interpretation of four PCs are as follows; (1) t1 captures fineness (or coarseness) in the images, (2) t2 captures contrast in the images, and (3) t3 captures patterns with more clear edges.

[0094]Currently, pre-determined operating conditions are used for every product grade and final products are imaged and analyzed periodically in the quality control lab. An imaging system in the laboratory would enable monitoring the quality of the countert...


PUM


Abstract

A new application of machine vision for process industries is proposed. The invention consists of: (1) estimation of visual quality of products, (2) modeling causal relationship between estimated quality and process variables, and (3) optimization of visual quality using the causal model. This invention can handle the stochastic nature in visual appearance of products that process industries provide, which has been a main obstacle for the success of machine vision in process industries. Also, it opens new tasks in machine vision such as modeling and optimization of visual quality of products.

Description

TECHNICAL FIELD[0001]This invention relates to the application of machine vision to industrial processes in order to optimize the quality of a resulting product or improve efficiency of the underlying process.BACKGROUND ART[0002]Machine vision has been studied for about 40 years but the study in last 15 years has shown drastic progress due to the great advances in imaging and computing technologies. The main purpose of machine vision is to allow a computer to understand aspects of its environment using information provided by visual sensors. The subject of machine vision now embraces innumerable topics and applications: these range from automatic assembly and inspection to automatic vehicle guidance, from automatic documents interpretation to verification of signatures, and from analysis of remotely sensed images to checking of fingerprints and recognizing faces, to list just a few.[0003]Automatic inspection and assembly is one of the areas where machine vision has been most success...

Claims


Application Information

Patent Timeline
Patent Type & Authority Patents(United States)
IPC IPC(8): G06K9/00G05B13/04G05B19/418G06T7/00G06T7/40
CPCG05B13/048G05B19/41875G06T7/0004G06T7/0006G06T7/402G01N21/8851G01N2021/8887G05B2219/32186G06T2207/20064G06T2207/30164G06T7/42Y02P90/02
Inventor MACGREGOR, JOHN F.LIU, JAY J.
Owner MCMASTER UNIV
Why Eureka
Try Eureka