Method of detecting system function by measuring frequency response

a technology of frequency response and detection system, applied in the direction of pulse characteristics measurement, testing circuit, instruments, etc., can solve the problems of time-consuming and effective methods, and achieve the effect of reducing testing tim

Active Publication Date: 2012-04-03
BATTELLE ENERGY ALLIANCE LLC
View PDF24 Cites 30 Cited by
  • Summary
  • Abstract
  • Description
  • Claims
  • Application Information

AI Technical Summary

Benefits of technology

[0008]The subject method allows a parallel implementation for swept frequency measurements to be made utilizing a composite signal of a single time record that greatly reduces testing time without a significant loss of accuracy.

Problems solved by technology

The method is effective but time consuming, as the process is serial.

Method used


Image

  • Method of detecting system function by measuring frequency response
  • Method of detecting system function by measuring frequency response
  • Method of detecting system function by measuring frequency response

Examples


example 1

Analytical Testing on a Sum of Sines

[0095]The CSD algorithm was evaluated using a simple signal that was assembled from a finite sum of equal amplitude sine waves (Sum of Sines (SOS)) with frequencies distributed logarithmically over a limited range. The objective of the analysis was to assess how well the CSD algorithm could pick out an amplitude for each component.

[0096]To check out the concept analytically, a MATLAB® matrix calculation computer software code was written that was a logarithmic mix of 5 equal unity amplitude frequencies (50.5, 51, 51.5, 52, 52.5 Hz). The acquired time record was set to 10 periods of the lowest frequency and the time step was set to 1 / 10 of the period of the highest frequency. As per Equation 9, error-free detection should estimate the amplitude of 0.5 for each component. Table 1 gives an estimate for a first pass or simple synchronous detection and a second pass, the CSD algorithm. The MATLAB® matrix calculation computer software code for this anal...

example 2

Analytical Testing of a Low-Pass Filter

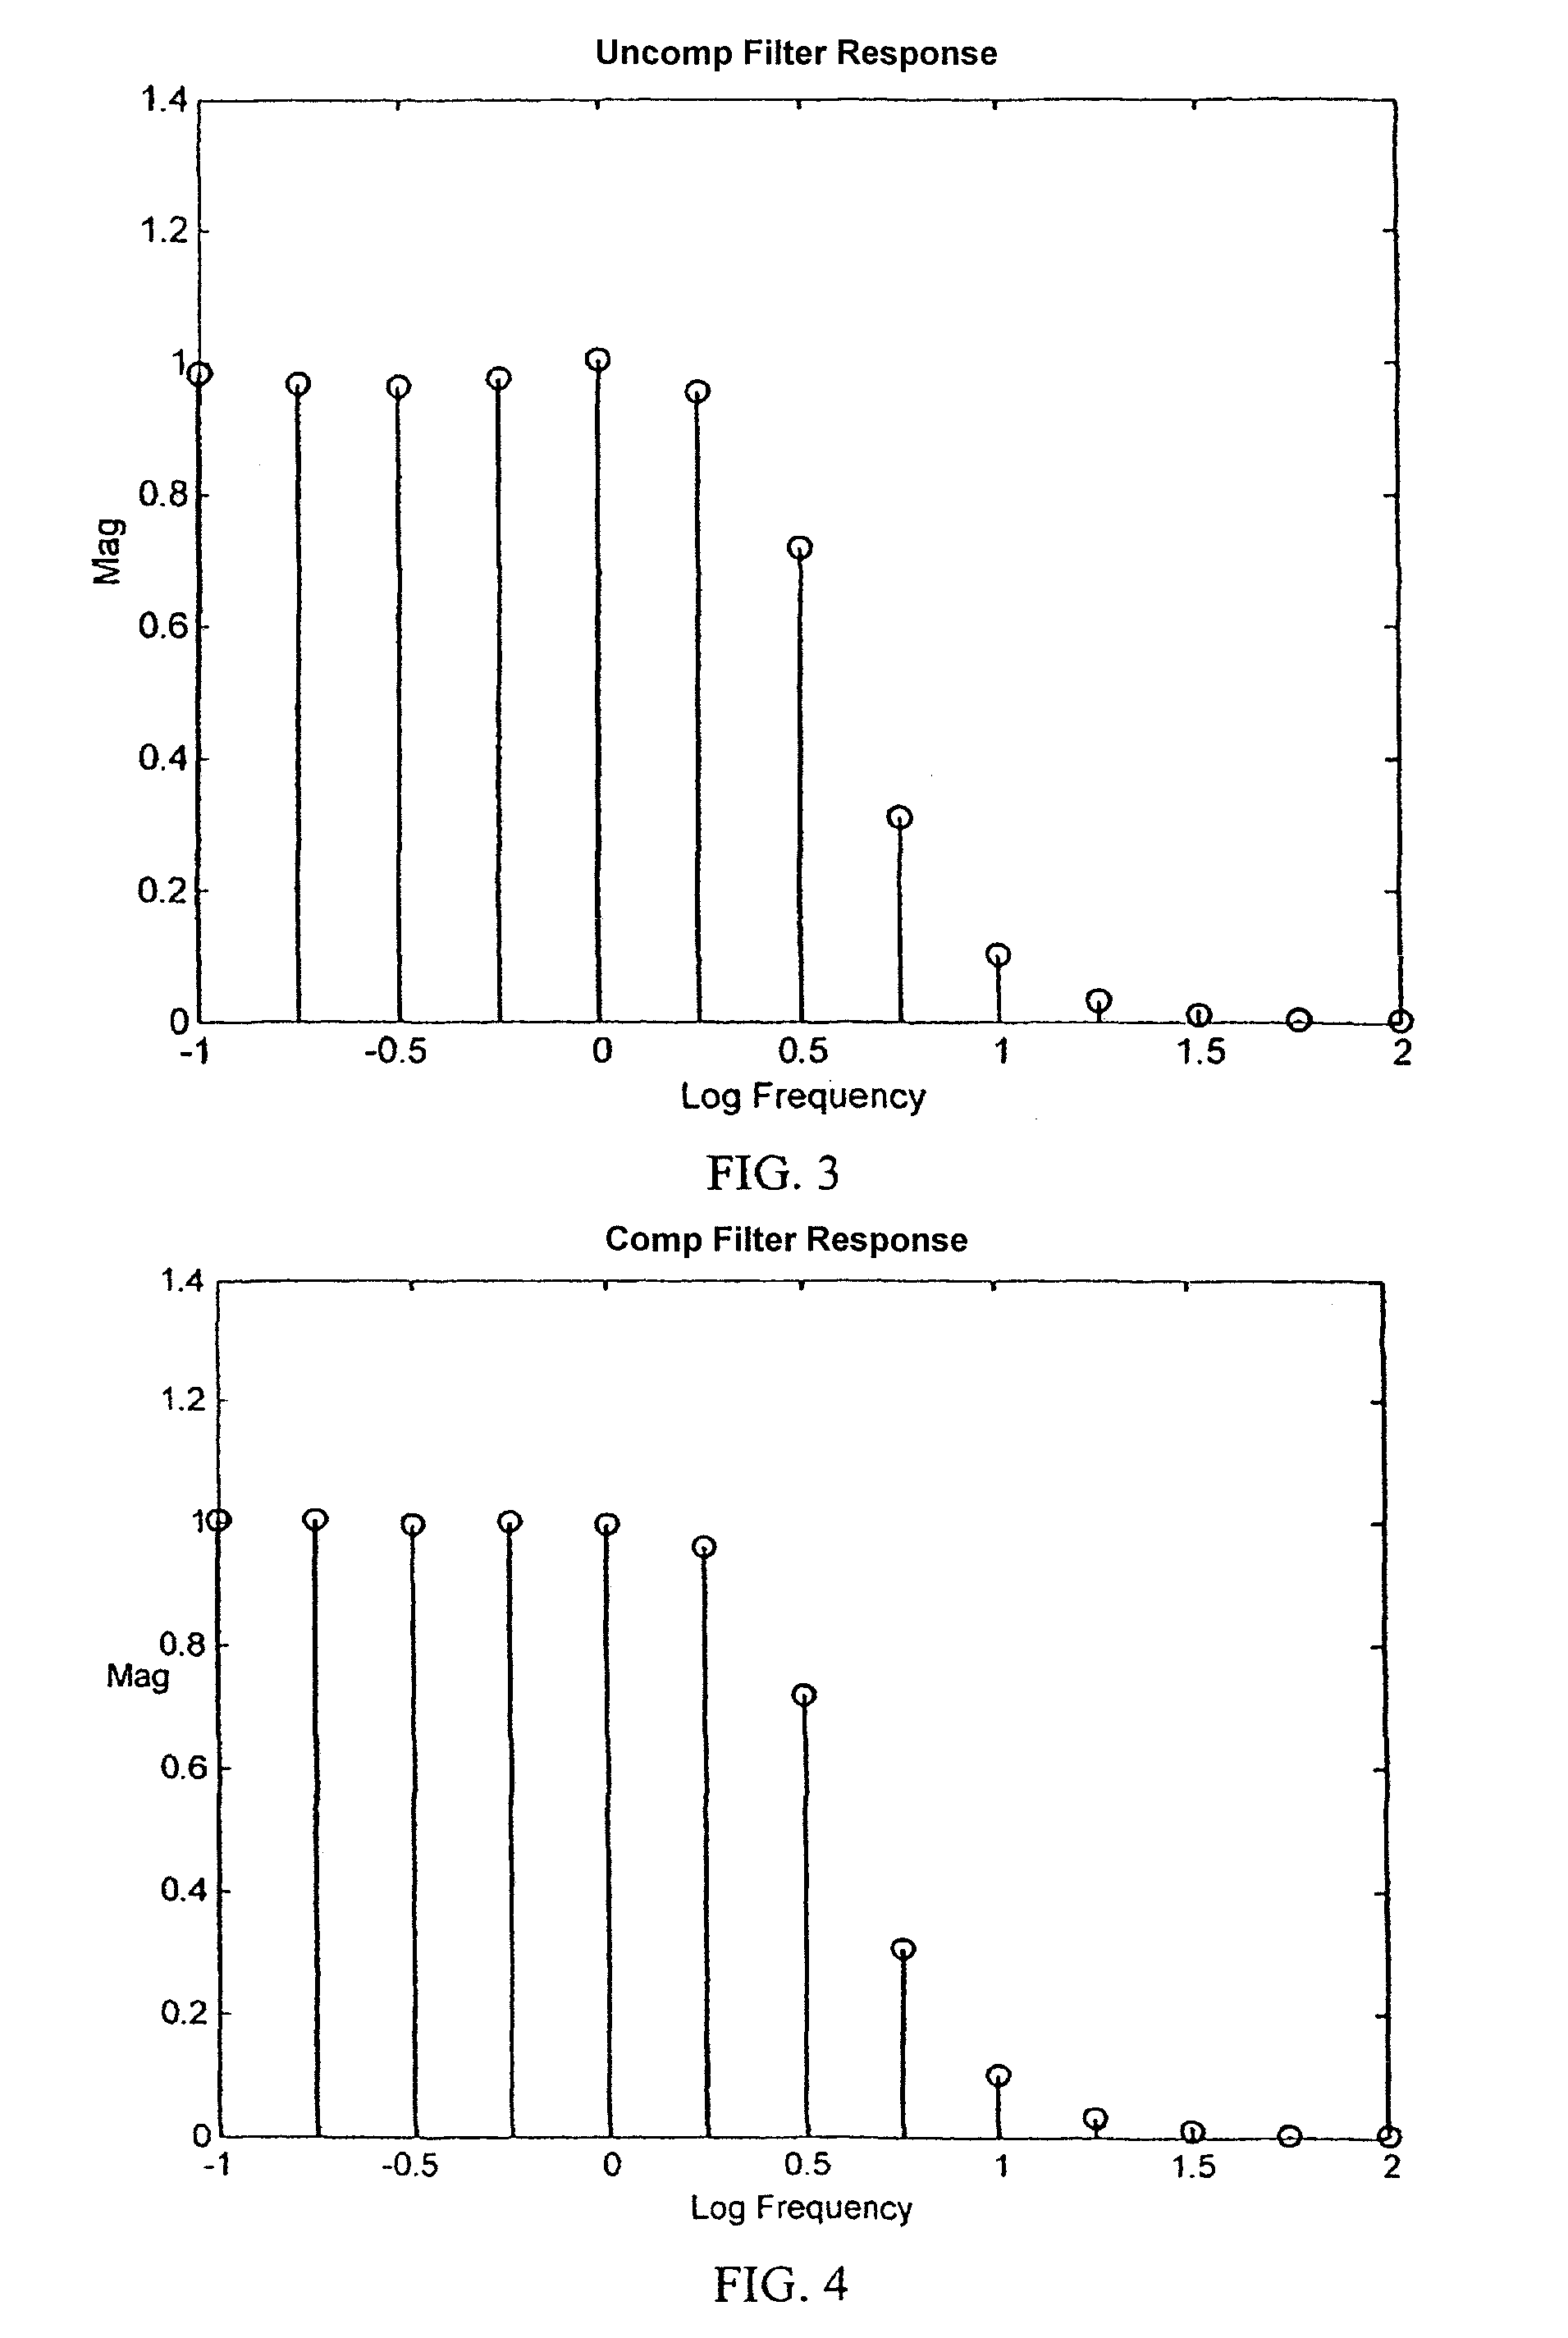
[0099]A recursive model of a second order low-pass function was excited with an SOS input signal. The CSD algorithm was then used to estimate the frequency response at each of the specific frequencies making up the SOS.

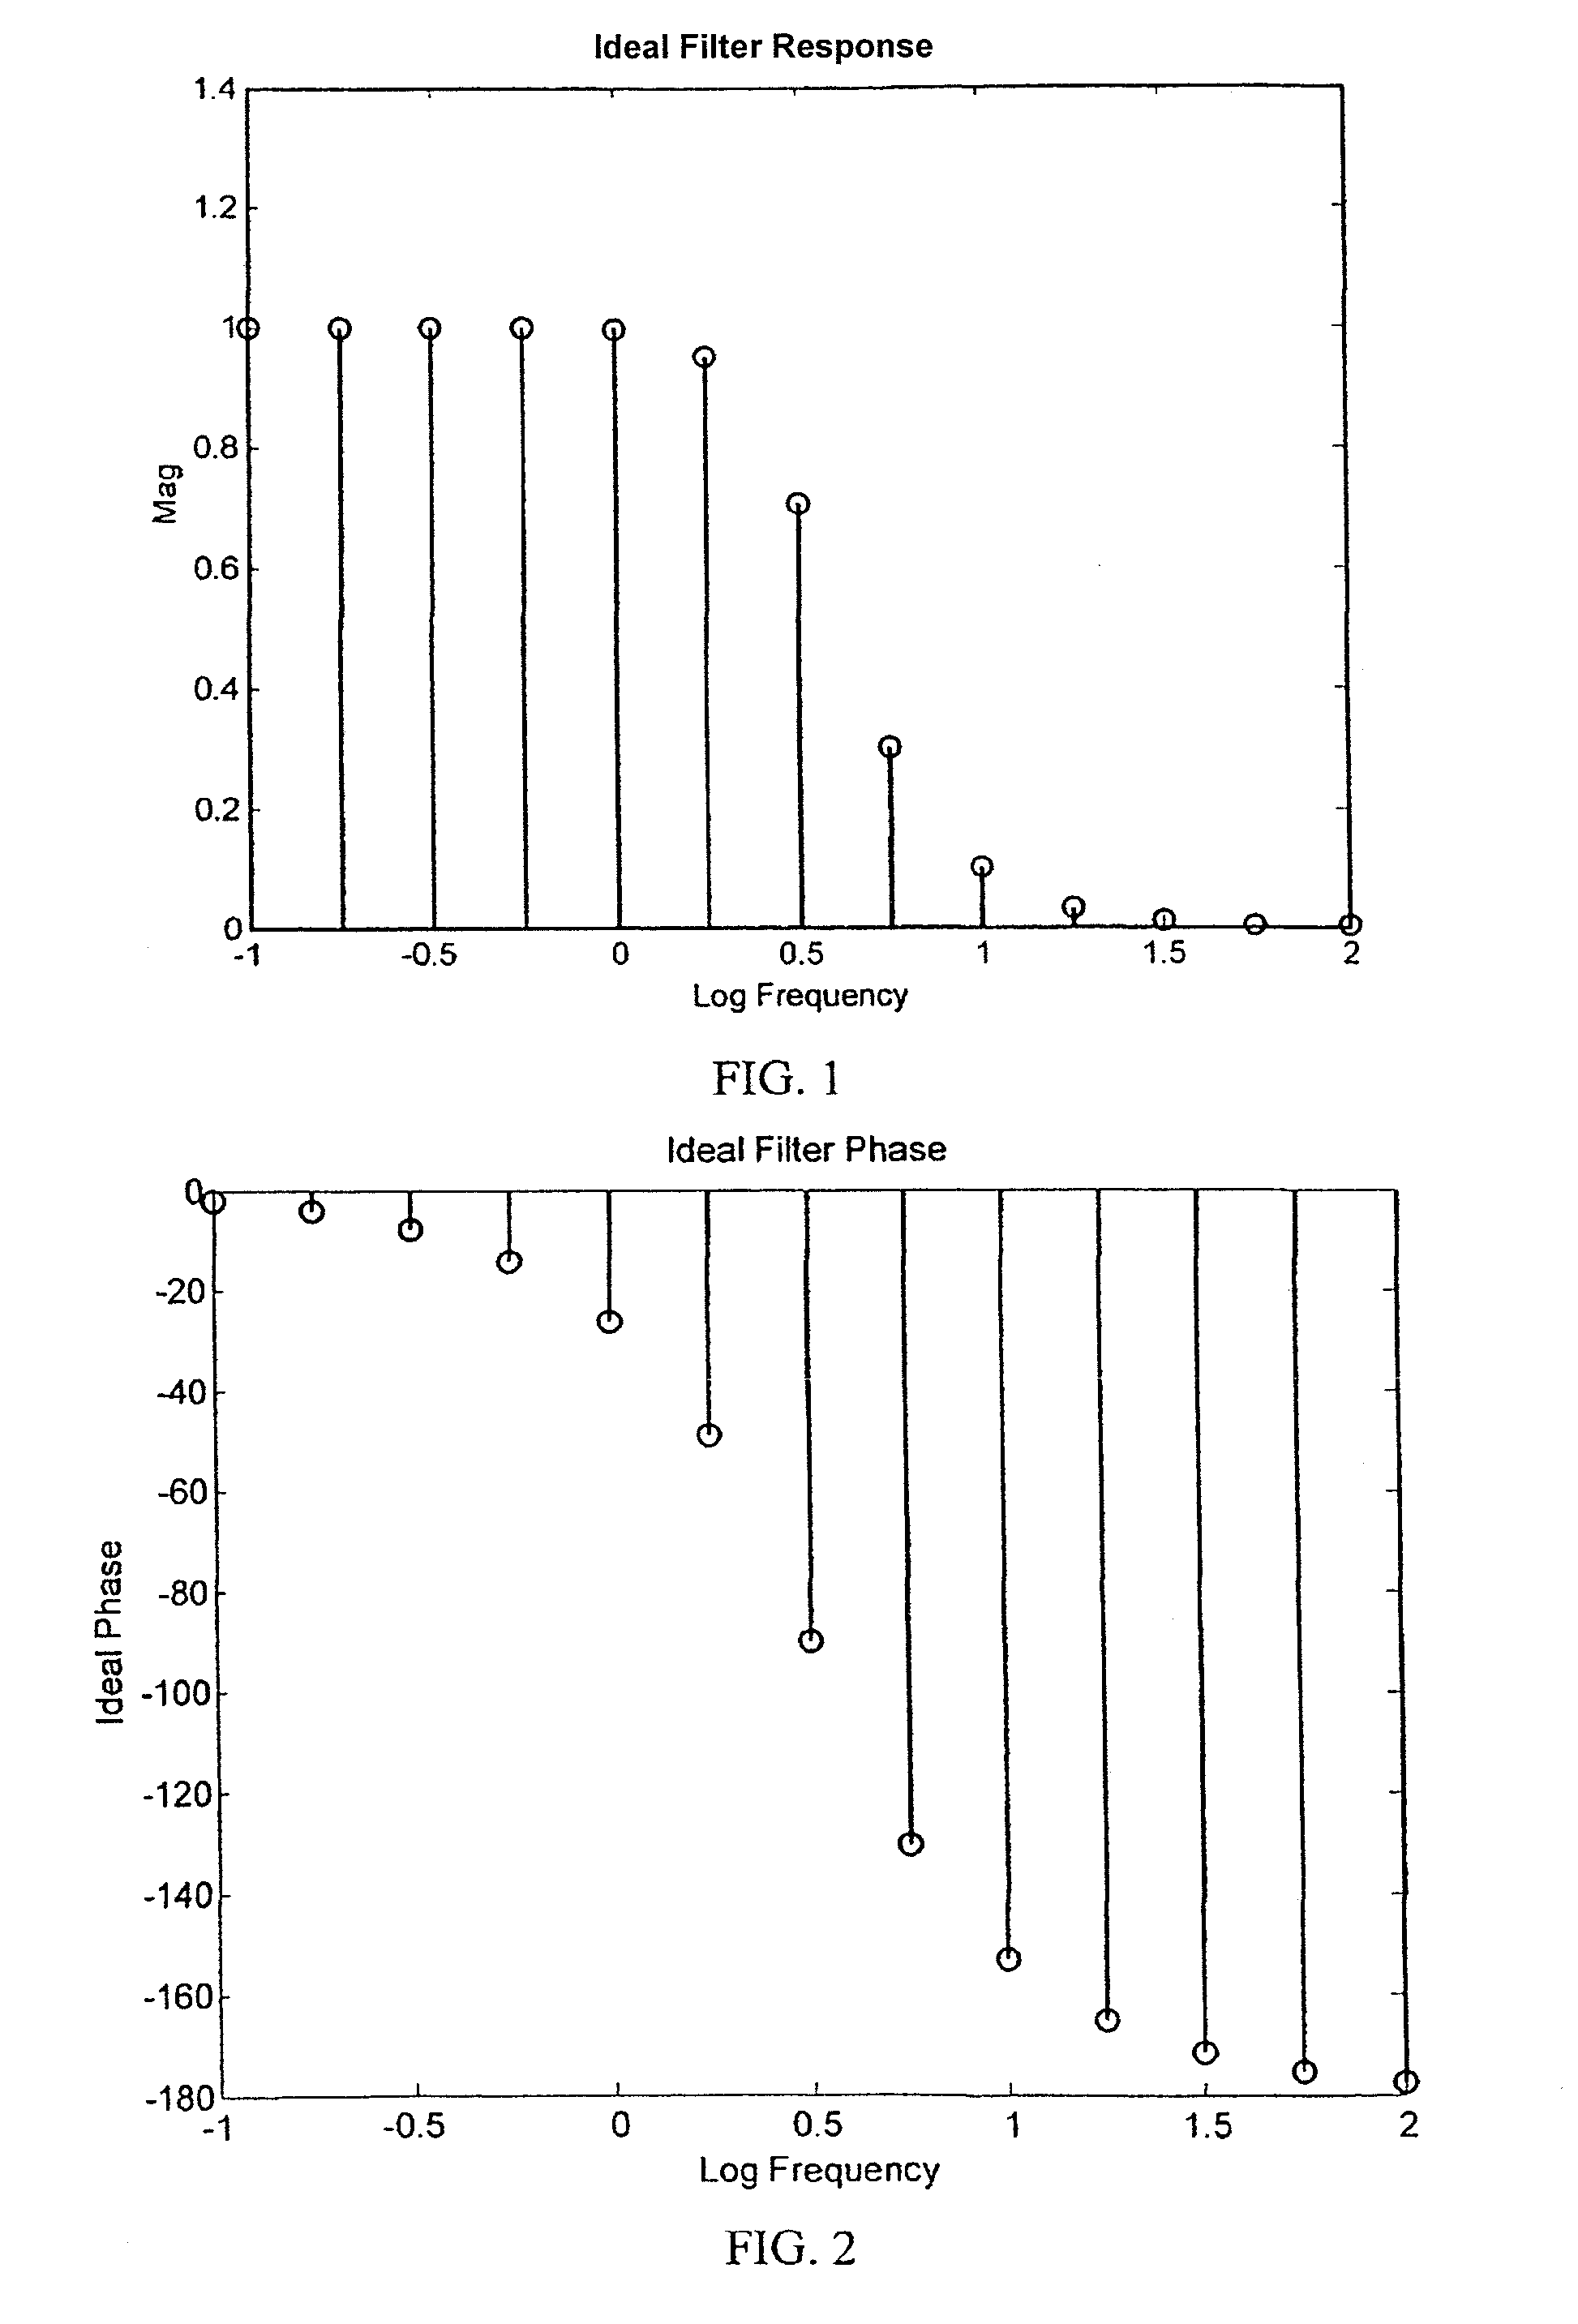
[0100]A spread of 13 specific frequencies was chosen that were spaced in ¼ decade steps starting from 0.1 Hz up to 100 Hz. Using these frequencies, a mix of equal unity amplitude sine waves was created. This range of frequencies was picked as research performed at the Idaho National Laboratory with batteries is typically over this frequency spread. The signal was discretized with a time step that was 10% of the period of the highest frequency. The length of the time record was set at 10 periods of the lowest frequency.

[0101]A recursive model of a second order Butterworth low-pass function was developed. A center frequency was set at the middle of the SOS frequency spread. A filter response to the SOS input time profile was comput...

example 3

Analytical Testing of CSD with a Battery Model

[0103]The CSD algorithm was evaluated analytically via a computer simulation of the detection of the impedance of the Lumped Parameter Model of a battery (LPM) that was developed by the Idaho National Laboratory (INL) (see, FreedomCAR Battery Test Manual, 2003). A computer model for the LPM that will simulate battery voltage response to an arbitrary battery current was also developed at INL by Fenton et al., 2005. The voltage response of the model normalized to the current in the frequency domain will be the battery impedance. The equivalent circuit for the LPM with parameter identification is shown in FIG. 6.

[0104]The LPM was excited with a current source IIN that was an SOS, and the CSD algorithm was used to identify the impedance seen looking into the LPM over a limited range of discrete frequencies. It should be noted that the polarity of the voltage response was defined as negative because the SOS excitation current was a discharge ...


PUM


Abstract

Real-time battery impedance spectrum is acquired using a one-time record. Fast Summation Transformation (FST) is a parallel method of acquiring a real-time battery impedance spectrum using a one-time record that enables battery diagnostics. An excitation current to a battery is a sum of equal amplitude sine waves of frequencies that are octave harmonics spread over a range of interest. A sample frequency is also octave and harmonically related to all frequencies in the sum. The time profile of this signal has a duration that is a few periods of the lowest frequency. The voltage response of the battery, average deleted, is the impedance of the battery in the time domain. Since the excitation frequencies are known and octave and harmonically related, a simple algorithm, FST, processes the time record by rectifying relative to the sine and cosine of each frequency. Another algorithm yields real and imaginary components for each frequency.

Description

CROSS-REFERENCE TO RELATED APPLICATIONS[0001]This application is a continuation-in-part of U.S. patent application Ser. No. 11 / 825,629, filed Jul. 5, 2007, now U.S. Pat. No. 7,395,163, issued Jul. 1, 2008, which is a continuation of U.S. patent application Ser. No. 11 / 313,546, filed Dec. 20, 2005, now abandoned, which claims the benefit of U.S. Provisional Patent Application Nos. 60 / 637,969, filed Dec. 20, 2004, and 60 / 724,631, filed Oct. 7, 2005. The disclosure of each of these applications are hereby incorporated by reference in their entirety, including all figures, tables and drawings.STATEMENT REGARDING FEDERALLY SPONSORED RESEARCH OR DEVELOPMENT[0002]The subject invention was made with government support under a research project supported by NASA, Grant No. NNA05AC24C. The government has certain rights in this invention. Further, the United States Government has certain rights in this invention pursuant to Contract No. DE-AC07-05ID14517 between the United States Department of ...

Claims


Application Information

Patent Timeline
Patent Type & Authority Patents(United States)
IPC IPC(8): G01R23/00G06F11/00
CPCG01R31/3662G01R31/389
Inventor MORRISON, JOHN L.MORRISON, WILLIAM H.CHRISTOPHERSEN, JON P.
Owner BATTELLE ENERGY ALLIANCE LLC
Why Eureka
Try Eureka