
DNA integrity assay (DIA) for cancer diagnostics, using confocal fluorescence spectroscopy

a technology of confocal fluorescence and integrity assay, applied in the direction of material analysis, biochemistry apparatus and processes, instruments, etc., can solve the problems of inconvenient quantification and multiplex detection, and inability to reliably reproduce pcr on a daily basis

Active Publication Date: 2014-09-16
THE JOHN HOPKINS UNIV SCHOOL OF MEDICINE
View PDF1 Cites 32 Cited by
  • Summary
  • Abstract
  • Description
  • Claims
  • Application Information

AI Technical Summary

Benefits of technology

μCICS provides a rapid, economical, and accurate method for cancer detection, capable of analyzing DNA integrity in serum samples without DNA isolation or PCR amplification, offering high sensitivity and specificity, and can detect cancers at an earlier stage than conventional methods.

Problems solved by technology

Despite the potential benefits, the clinical analysis of CNA biomarkers faces two key hurdles.
While PCR has been very successful in biomarker discovery and research, it has intrinsic limitations.
For example, PCR is a complicated enzymatic process that requires substantial optimization to obtain favorable results, making PCR finicky and somewhat difficult to reliably reproduce on a daily basis.
More complicated variants, such as quantitative real-time PCR (qPCR) and nested PCR, require yet more care, making robust quantification and multiplex detection difficult. qPCR has wide dynamic range but is typically limited to measuring 2-fold changes in quantity.
Multiplexed PCR reactions can also be affected by varying amplification efficiencies, leading to poor quantification accuracy.
Furthermore, the sensitive nature of the PCR process and the lack of standardization in sample preparation steps can further exacerbate these issues.
Practically, long run times, tedious sample processing steps, expensive reagents, and trained technicians required for PCR, limit its clinical utility.

Method used


Image

  • DNA integrity assay (DIA) for cancer diagnostics, using confocal fluorescence spectroscopy
  • DNA integrity assay (DIA) for cancer diagnostics, using confocal fluorescence spectroscopy
  • DNA integrity assay (DIA) for cancer diagnostics, using confocal fluorescence spectroscopy

Examples


example i

Materials and Methods

[0104]DNA Sizing Calibration.

[0105]λ Hind III digest DNA (New England Biolabs) was used as a control sample for assay development. To prepare the sample for analysis, the DNA was diluted to 200 ng / mL, mixed with 0.1 μM TOTO-3 dye (Invitrogen), and allowed to incubate at room temperature in the dark for 1 hour. The sample was then further diluted to 1 pM and loaded into the microfluidic device for analysis. All dilutions were performed using TE buffer.

[0106]μCICS Analysis.

[0107]μCICS analysis was performed using the previously described platform (Liu et al. (2008) Biophys J 95, 2964-2975). PDMS microfluidic devices were fabricated with standard soft-lithography techniques. Each microfluidic device contains a large transport channel with a centrally located analysis constriction. The analysis constriction measures 20×5×1.5 μm or 20×5×0.5 μm (l×w×h). The device also contains a filter array at the inlet to remove particles and cells to reduce channel clogging. Sampl...

example ii

Results

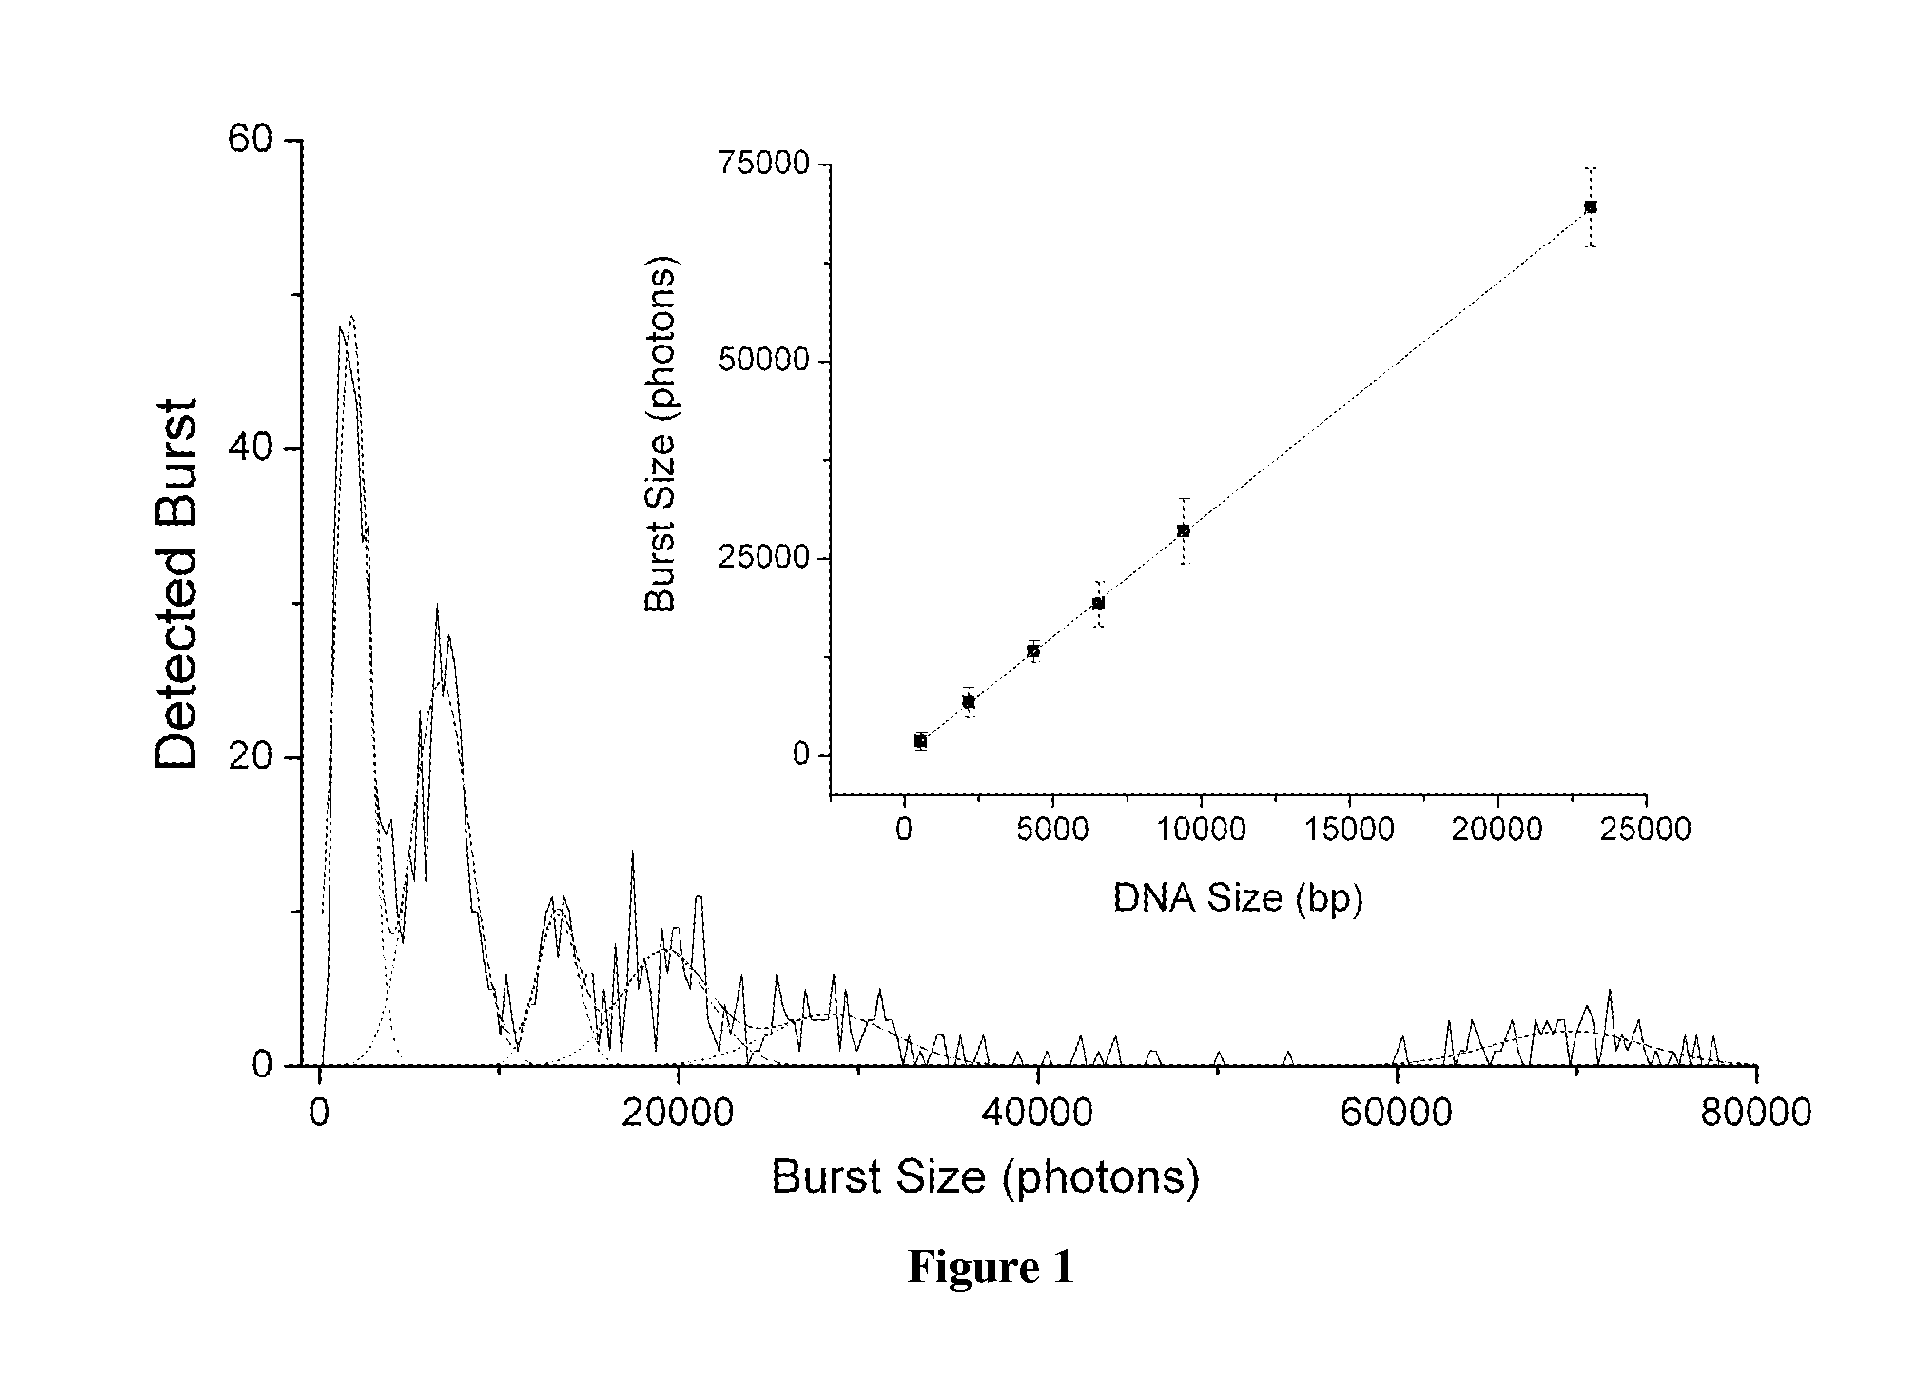
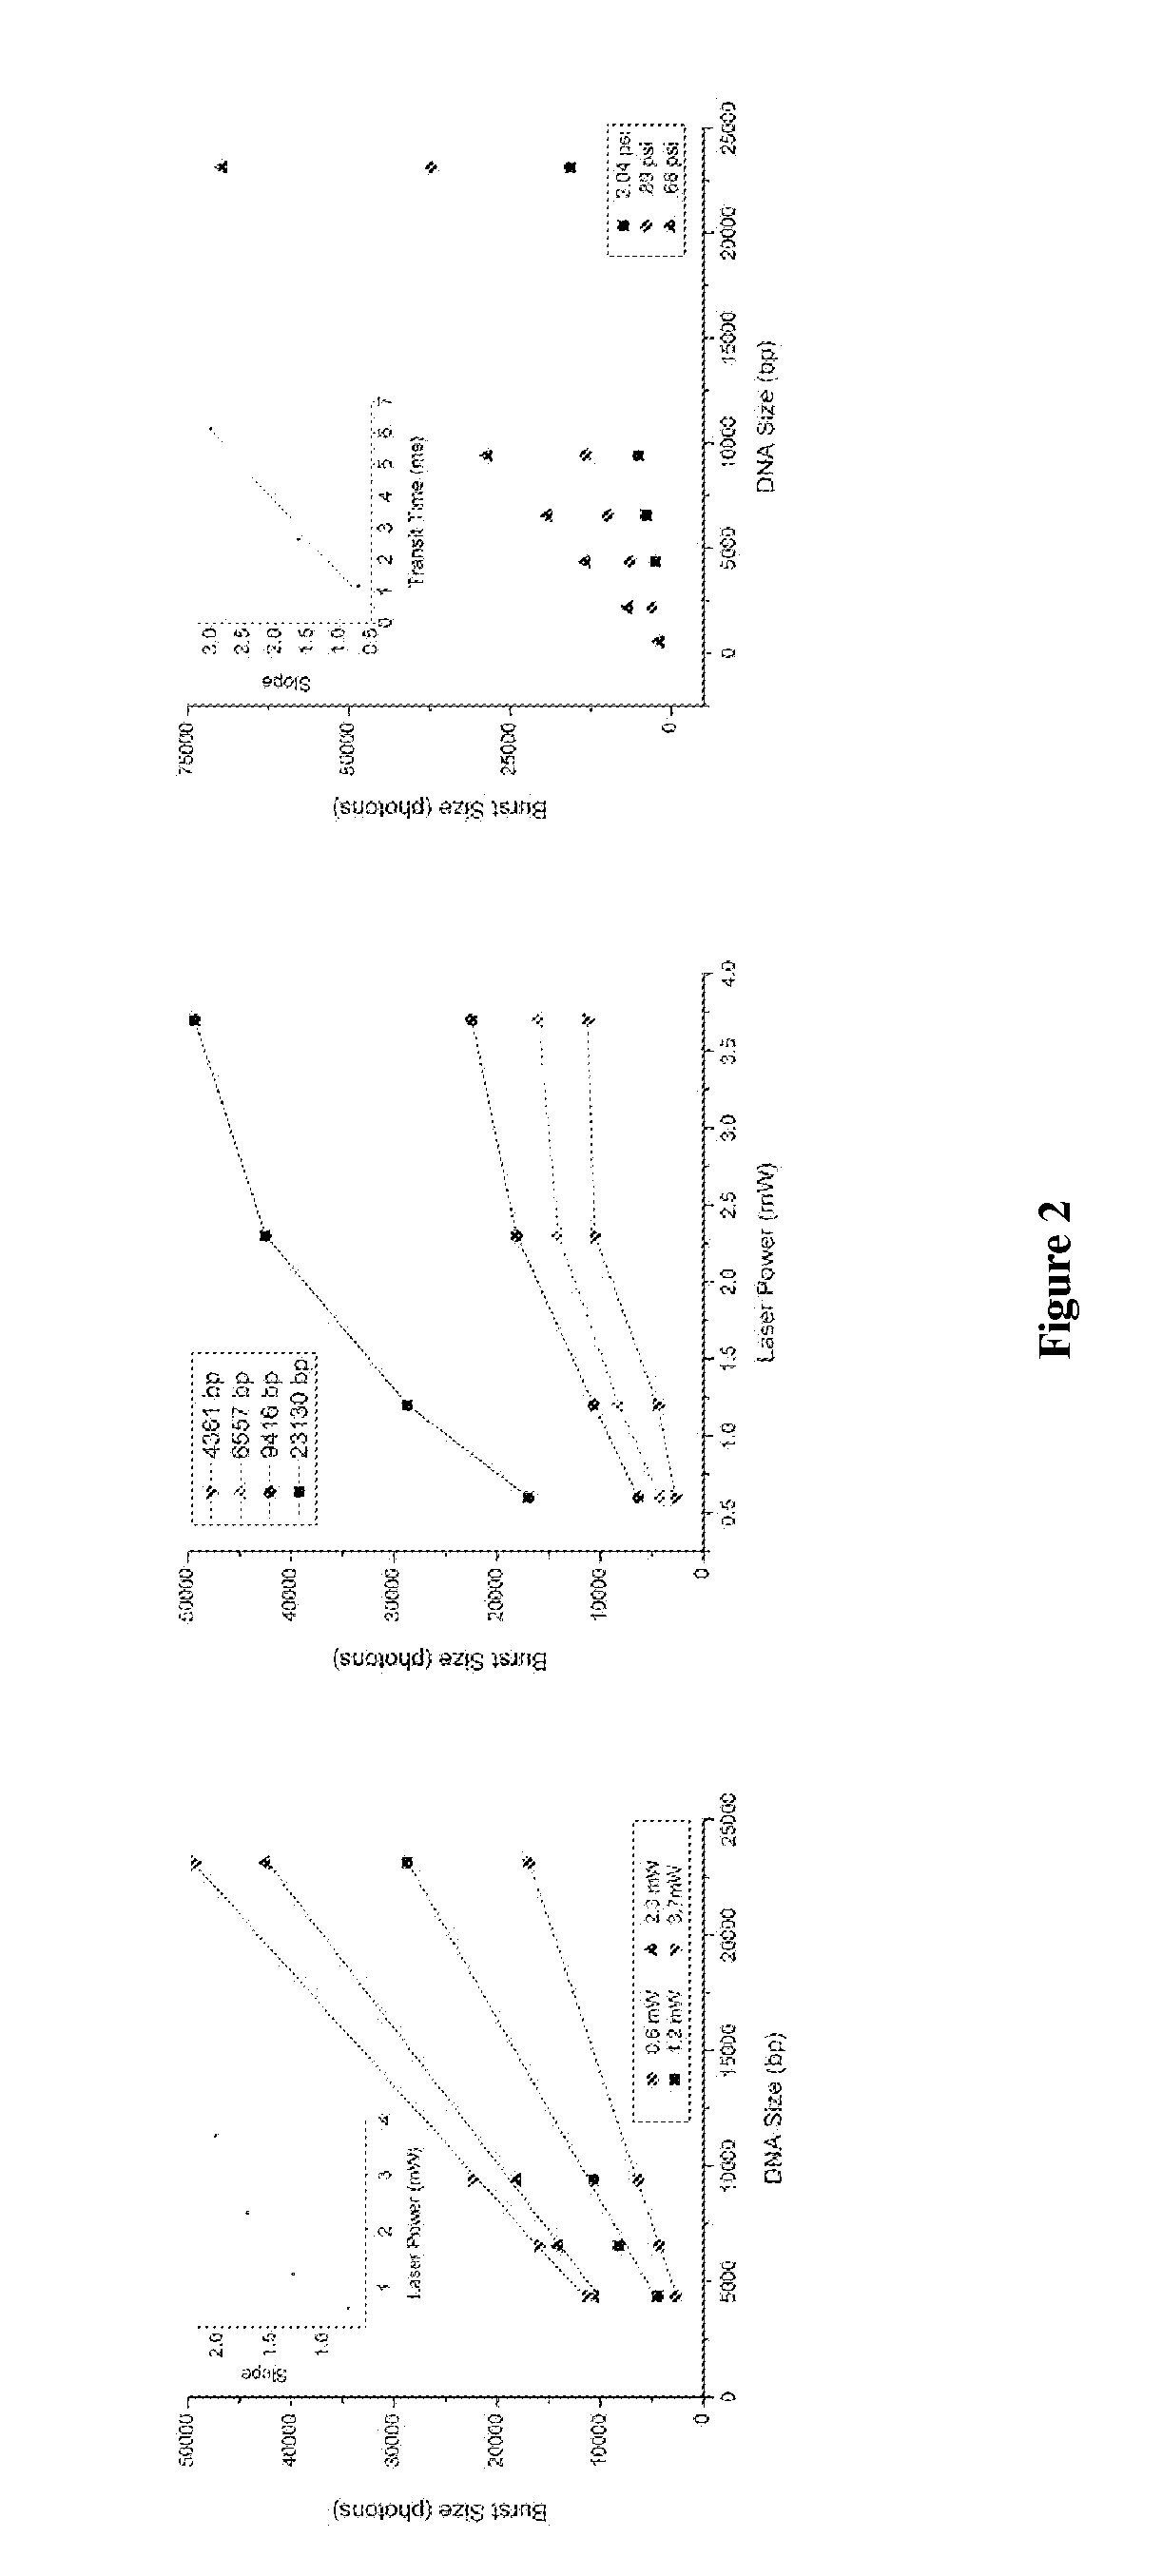
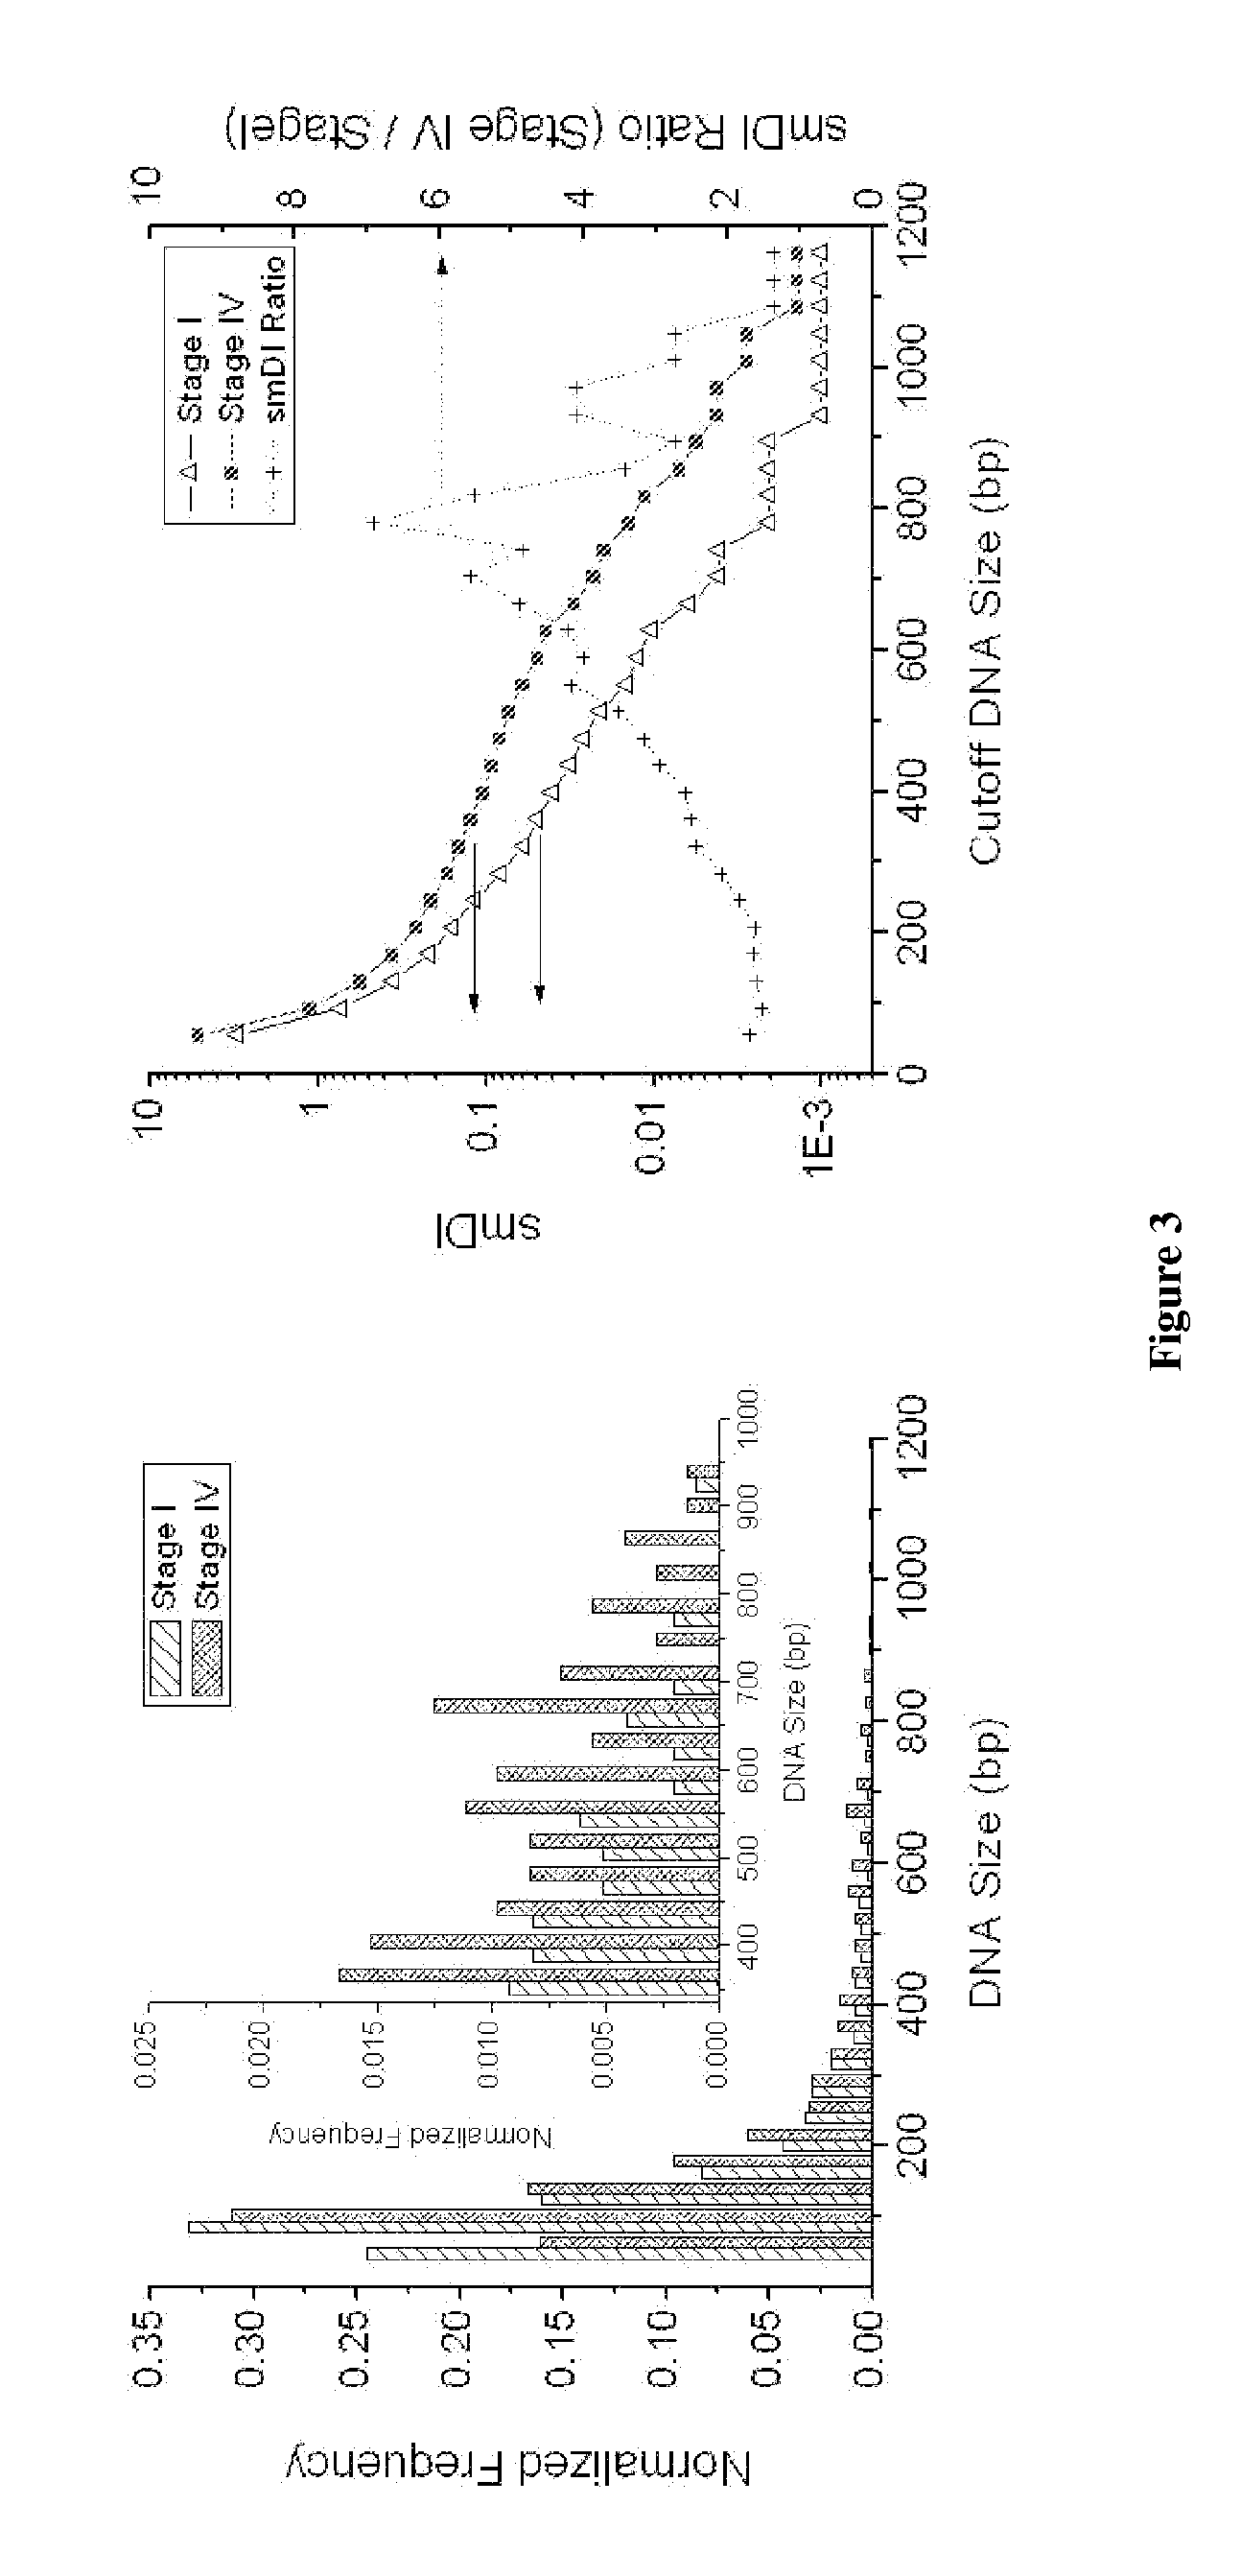
[0117]Single molecule DNA sizing of λ Hind III digest DNA was performed via fluorescent burst size analysis. The DNA was stoichiometrically labeled with TOTO-3 intercalating dye such that each DNA molecule incorporated a number of dye molecules that was directly proportionate to its length. The labeled DNA sample was then diluted, fluorescent tracer particles were added, and the sample was loaded into a microfluidic device for μCICS analysis. The μCICS platform has two excitation and detection channels. 488 / 520 nm excitation / detection was used to monitor the tracer particle fluorescence while 633 / 670 nm excitation / detection was used to analyze the DNA fluorescence. The fluidic drive pressure was slowly changed until an average tracer particle transit time of 5 ms was obtained. This corresponds to an average flow velocity of 0.2 mm / s within the microchannel.

[0118]To perform a measurement, the μCICS observation volume is focused into the center of the 5 μm wide analysis constri...

example iii

System for CICS

[0132]The terms light, optical, optics, etc are not intended to be limited to only visible light in the broader concepts. For example, they could include infrared and / or ultraviolet regions of the electromagnetic spectrum according to some embodiments of the current invention.

[0133]An embodiment of the current invention provides a confocal spectroscopy system that can enable highly quantitative, continuous flow, single molecule analysis with high uniformity and high mass detection efficiency. Such a system will be referred to as a Cylindrical Illumination Confocal Spectroscopy (CICS) system. CICS is designed to be a highly sensitive and high throughput detection method that can be generically integrated into microfluidic systems without additional microfluidic components.

[0134]Rather than use a minute, diffraction limited point, CICS uses a sheet-like observation volume that can substantially entirely span the cross-section of a microchannel. It is created through the...


PUM

PropertyMeasurementUnit
concentrationsaaaaaaaaaa
poweraaaaaaaaaa
bin timeaaaaaaaaaa

Abstract

The present invention relates, e.g., to a method for determining the size distribution of DNA molecules in a sample comprising cell-free nucleic acid, comprising labeling the DNA with a fluorescent dye in a stoichiometric manner, subjecting the DNA to molecular spectroscopy (e.g., cylindrical illumination confocal spectroscopy), analyzing suitable fluorescent burst parameters of the labeled DNA, and conducting single molecule DNA integrity analysis of the labeled DNA molecules in the sample. In one embodiment of the invention, the method is used as a diagnostic method for detecting cancer.

Description

[0001]This application is a National Stage Application of International Application No. PCT / US2009 / 063262 filed Nov. 4, 2009, which claims priority to U.S. Provisional Application No. 61 / 111,064 filed Nov. 4, 2008, the entire contents of both of which are incorporated by reference in their entirety. Co-pending U.S. application Ser. No. 12 / 612,300, filed on Nov. 4, 2009, contains related information and is incorporated by reference herein in its entirety.[0002]This application was made with U.S. government support, including grants number 0546012, 0730503, and 0725528 from The National Science Foundation. The U.S. government thus has certain rights in the invention.FIELD OF THE INVENTION[0003]This invention relates, e.g., to a method for detecting nucleic acid integrity in cell-free nucleic acid, using single molecule spectroscopy methods and / or systems. In one embodiment of the invention, cylindrical illumination confocal spectroscopy (CICS) systems and methods are employed. This me...

Claims


Application Information

Patent Timeline
Patent Type & Authority Patents(United States)
IPC IPC(8): C12Q1/68
CPCC12Q1/6825C12Q2563/107C12Q2525/204Y10T436/143333
Inventor WANG, TZA-HUEILIU, KELVIN J.SHIH, IE-MING
Owner THE JOHN HOPKINS UNIV SCHOOL OF MEDICINE
Learn More