
A Planning Method for Backbone Dimensions of Integrated Circuit Clock Grid
A technology of integrated circuits and clock grids, applied in the direction of electrical digital data processing, special data processing applications, instruments, etc., can solve problems such as large clock delay and deviation, many stages of clock tree, and long non-common paths
- Summary
- Abstract
- Description
- Claims
- Application Information
AI Technical Summary
Problems solved by technology
Method used
Image

Examples
Embodiment Construction
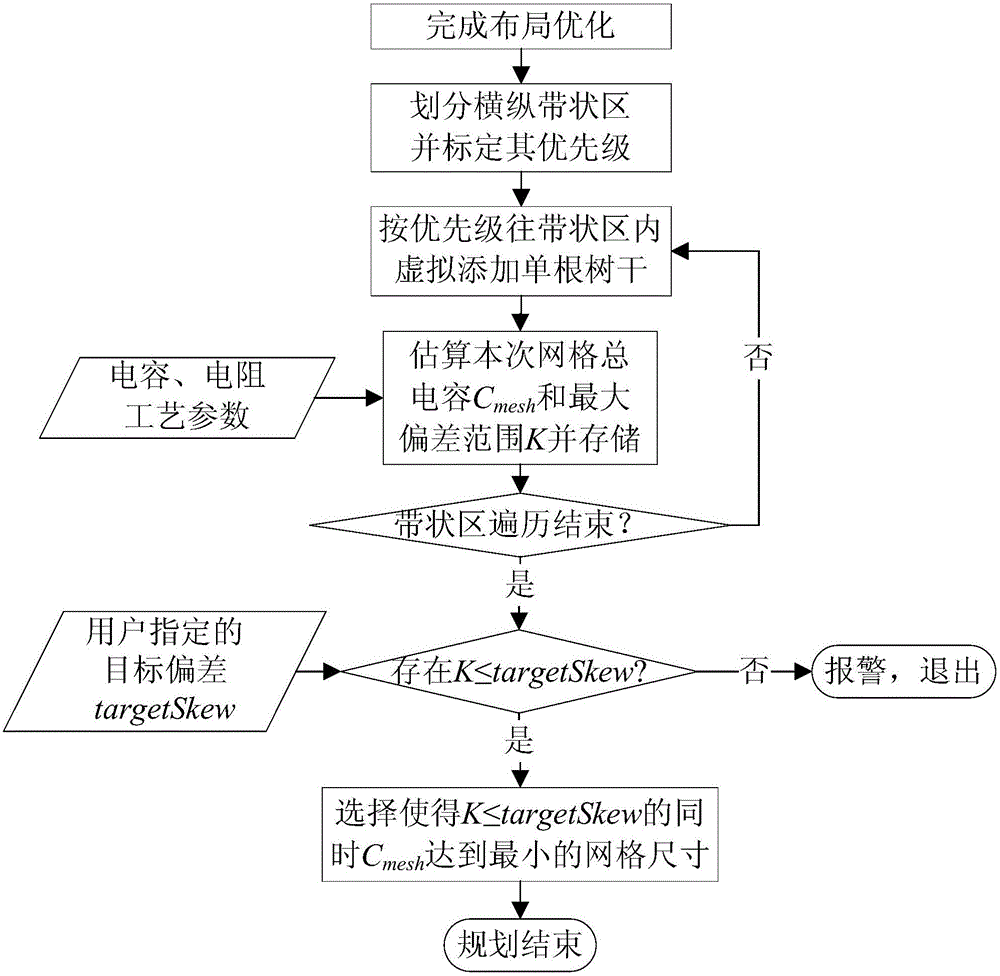
[0038] Such as figure 2 As shown, the implementation steps of the method for planning the backbone size of the integrated circuit clock grid in this embodiment are as follows:
[0039] 1) Divide the layout-completed integrated circuit design drawing to be planned into uniform horizontal strip regions and vertical uniform strip regions to obtain multiple strip regions distributed along the horizontal and vertical directions.
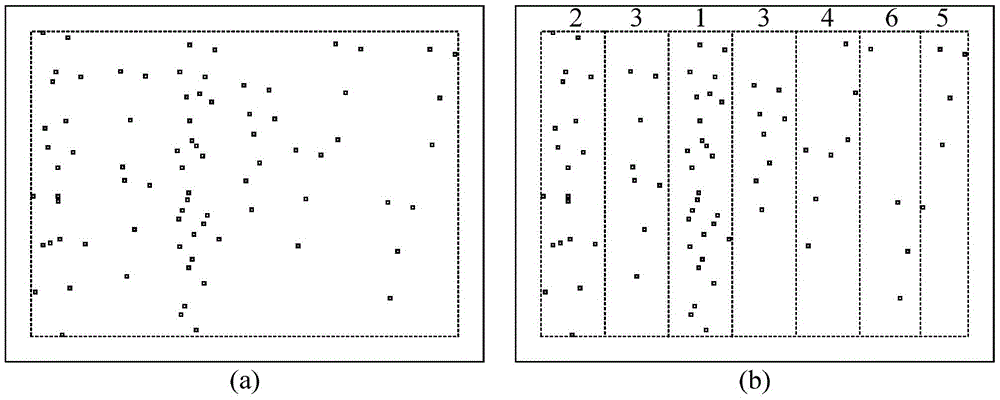
[0040] Such as image 3 As shown, the black dots in the figure represent the loads to be driven by the grid. image 3 (a) indicates that the dotted line box represents the boundary of all load distributions, and after being divided into longitudinal uniform strip-shaped areas, we get image 3 (b) shows a plurality of longitudinal strip-shaped areas evenly spaced by dotted lines, and each strip-shaped area is a candidate area for the placement of a single grid longitudinal backbone. image 3 (b) only shows the vertical division, and the horizontal divi...
PUM
 Abstract
Description
Claims
Application Information