Non-diagnostic applications of two-dimensional graphdiyne materials for fluorescence detection of biomarkers
A biomarker and fluorescence detection technology, applied in the field of application, can solve the problems of simultaneous detection of multiple targets, low detection sensitivity, and long detection time, so as to increase the possibility of clinical detection, improve detection sensitivity, and reduce testing time. The effect of fees
- Summary
- Abstract
- Description
- Claims
- Application Information
AI Technical Summary
Problems solved by technology
Method used
Image
Examples
Embodiment 1
[0035] H1N1 influenza detection (gene sequence: CGACTACACTCTCGATGAAGAA)
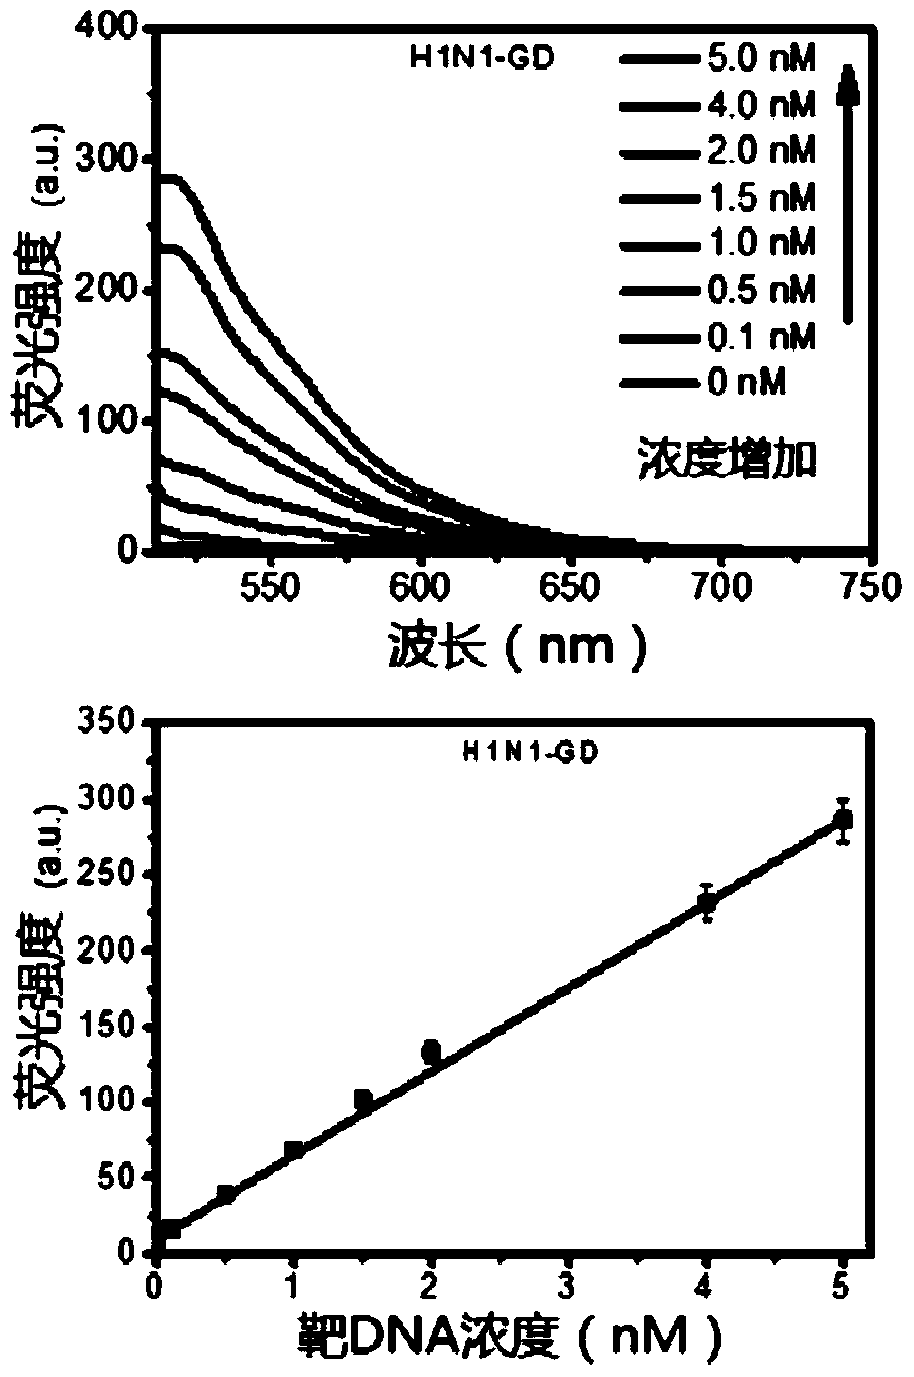
[0036] In 930 μL of phosphate buffer (0.1M, pH7.4), 1.2nM probe DNA molecules (gene sequence: TTCTTCATCGAGAGTGTAGTCG-FAM) were hybridized with different concentrations (0-5nM) of target DNA, and left at room temperature for 1min. Add graphyne (20 μg ml -1) to stand for 1 minute. The relationship between the target DNA concentration and the detected signal intensity is as follows: image 3 As shown, the fluorescence spectrum analyzes the FAM fluorescence characteristic peak intensity change in the 494nm band, such as image 3 It can be seen that with the increase of the concentration of the target DNA, the detection signal obviously increases, and the minimum detection concentration of the graphyne material is 20pM.
Embodiment 2
[0038] Simultaneous detection of multiple genes, the gene sequences used are as follows:
[0039] H1N1 Influenza T1 (gene sequence: CGACTACACTCTCGATGAAGAA)
[0040] Probe DNA molecule P1 (gene sequence: TTCTTCATCGAGAGTGTAGTCG-FAM)
[0041] H5N1 Influenza T2 (gene sequence: CATACTGAGAACTCAAGAGTCT)
[0042] Probe DNA molecule P2 (gene sequence: AGACTCTTGAGTTCTCAGTATG-Texas Red)
[0043] M13 bacteriophage T3 (gene sequence: ACTGGGCCGTCGTTTTAC)
[0044] Probe DNA molecule P3 (gene sequence: GTAAAACGACGGCCAGT-ROX)
[0045] In 930 μL phosphate buffer (0.1M, pH7.4), 1.2 nM probe DNA molecules (P1, P2 and P3) were mixed with graphyne (20 μg ml -1 ) mix and let stand for 1 minute.
[0046] 1) Add target DNA (T1, T2 and T3) respectively. Fluorescence spectrum analysis of the characteristic peaks in the 494nm, 518nm and 595nm bands.
[0047] 2) Add T2 and T3 target DNA at the same time, and analyze the characteristic peaks in the band of 494nm to 595nm by fluorescence spectrum.
...
PUM
| Property | Measurement | Unit |
|---|---|---|
| thickness | aaaaa | aaaaa |
Abstract
Description
Claims
Application Information
 - R&D
- Intellectual Property
- Life Sciences
- Materials
- Tech Scout
- Unparalleled Data Quality
- Higher Quality Content
- 60% Fewer Hallucinations
Browse by: Latest US Patents, China's latest patents, Technical Efficacy Thesaurus, Application Domain, Technology Topic, Popular Technical Reports.
© 2025 PatSnap. All rights reserved.Legal|Privacy policy|Modern Slavery Act Transparency Statement|Sitemap|About US| Contact US: help@patsnap.com


