Metabonomics analysis method for quorum sensing inhibition mechanism
A quorum sensing and metabolomics technology, applied in the field of metabolomics, to achieve the effect of rich structural information and simple sample preparation
- Summary
- Abstract
- Description
- Claims
- Application Information
AI Technical Summary
Problems solved by technology
Method used
Image
Examples
Embodiment 1
[0023] Example 1: Extraction of Pseudomonas aeruginosa PAO1 metabolites and preparation of NMR samples
[0024] Pick a single colony of Pseudomonas aeruginosa PAO1 into NB medium, and culture overnight at 37°C and 150rpm. Dilute the overnight cultured bacterial solution 1:1000 into a conical flask containing NB medium, add resveratrol to make the final concentration 400 μM, and use an equal volume of DMSO as a control, mix well and put it in a shaker, Cultivate at 37°C and 180rpm for 16-18 hours, and set thirteen repetitions for each group. Place the cultured bacterial solution on ice for a brief incubation, centrifuge at 4°C and 10,000 rpm for 8 minutes, and discard the supernatant to obtain the bacterial cells. After washing the bacteria three times with pre-cooled PBS, transfer to a new 10mL centrifuge tube. Add 3.8mL of pre-cooled methanol / water (1 / 0.9; v / v) extraction solution, and conduct the extraction by intermittent ultrasonication on ice for 5min. Add 4 mL of chlo...
Embodiment 2
[0025] Example 2: 1 H-NMR test
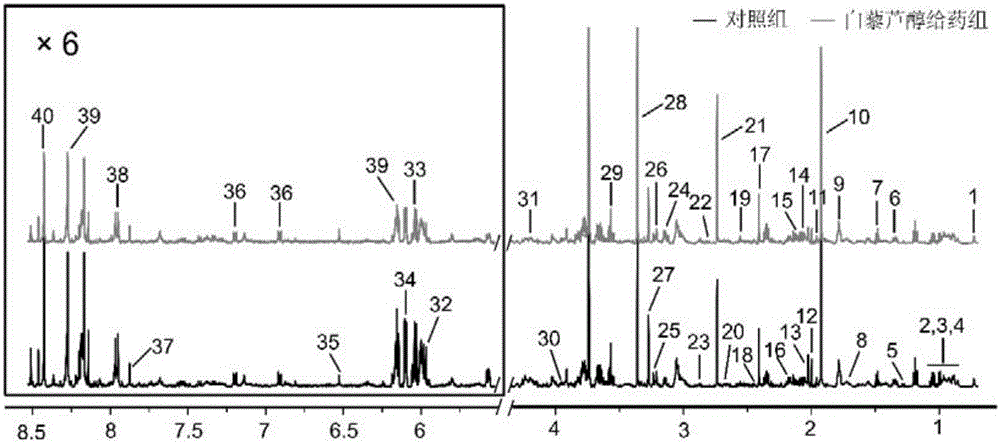
[0026] Metabolite samples extracted from bacterial fluid 1 H-NMR test is carried out in Bruker Av500MHz liquid nuclear magnetic resonance spectrometer. The collection temperature is 298K, with D 2 O lock field, the peak of internal standard TSP is used as the reference of zero-point chemical shift ( 1 H, δ 0.00). One-dimensional acquisition using the "cpmg" (Call-Purcell-Meiboom-Gill) sequence of suppressed water pulses 1 H-NMR. 1 The number of H-NMR spectrum FID accumulations is 128, the number of sampling points is 32K, the spectrum width is set to 10,330Hz, the acquisition time is 3.27s, and the relaxation time is 3.0s. Before the Fourier transform, all one-dimensional 1 The FID of the H-NMR spectrum was multiplied by an exponential window function with a broadening factor of 0.5 Hz.
Embodiment 3
[0027] Example 3: 1 Preprocessing of H-NMR data and assignment of characteristic peaks
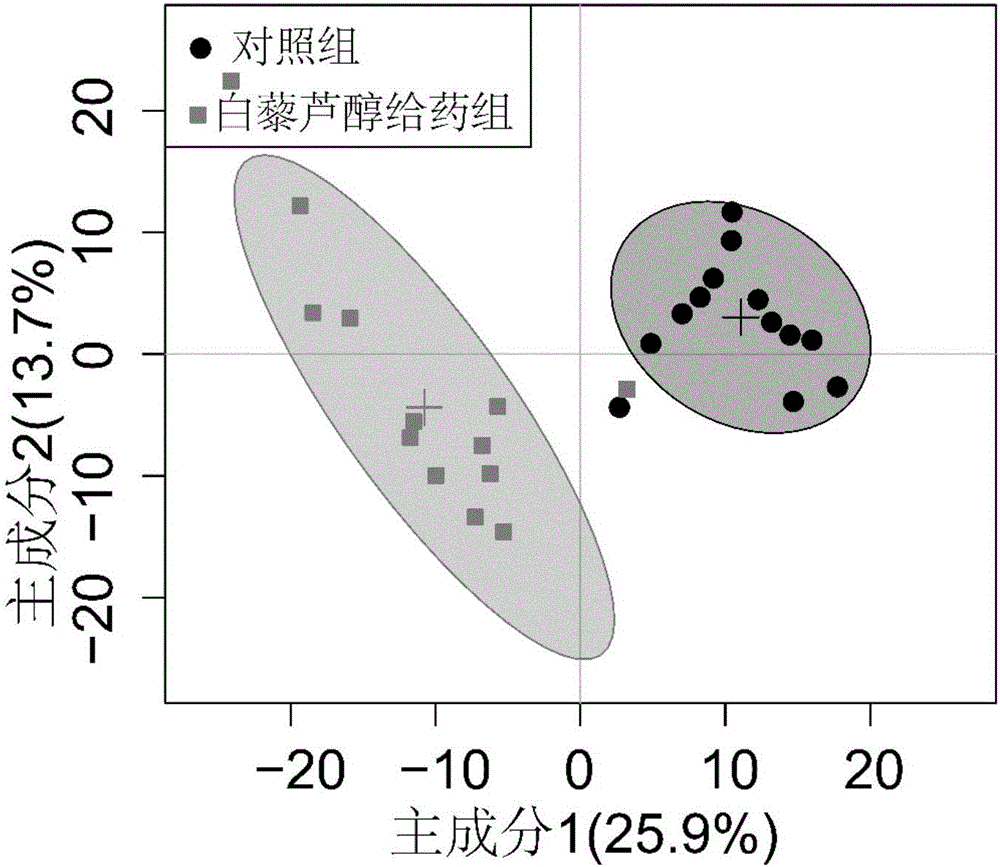
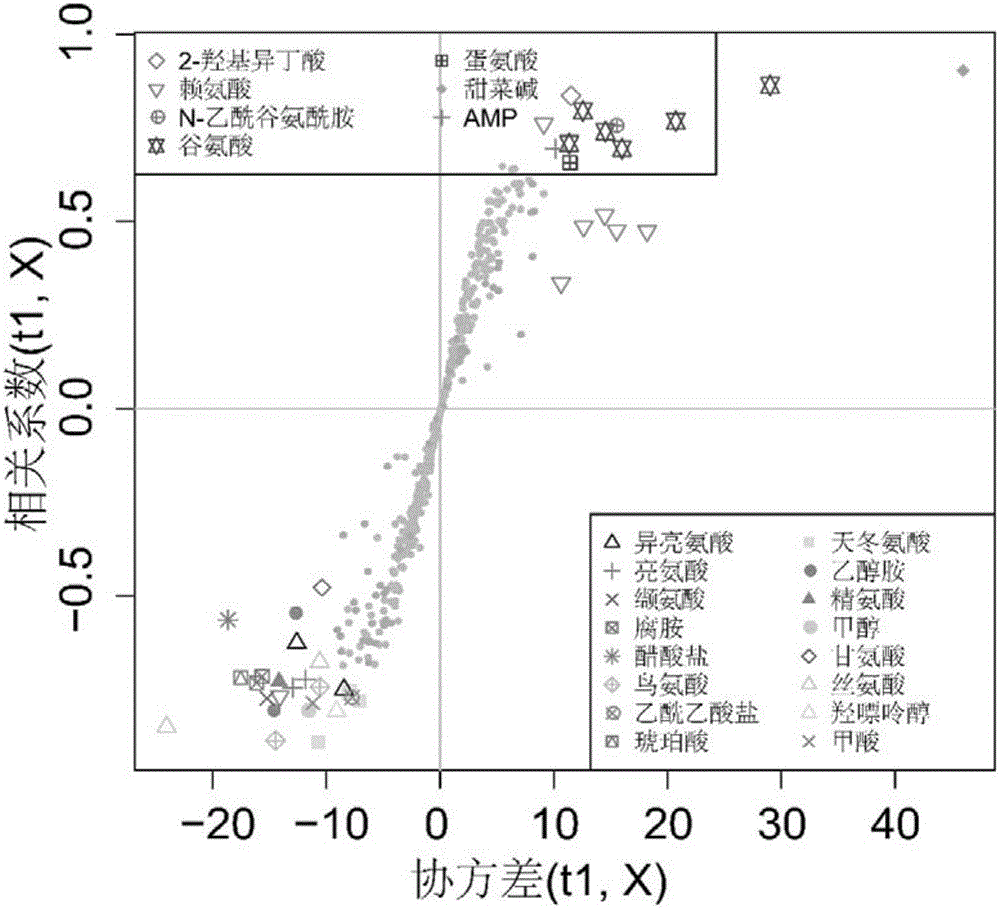
[0028] all 1 The H-NMR spectra were all manually corrected phase, adjusted baseline, and adjusted the peak of internal standard TSP to zero shift ( 1 H, δ 0.00). will be processed 1 The H-NMR spectrum was imported into MestReNova software (version 8.0.1, Mestrelab Research SL), and exported as an ASCII format file. Then import the file in ASCII format into "R" software (http: / / cran.r-project.org / ) for multivariate statistical analysis. For one-dimensional in the interval of 0.2 to 10ppm 1 The H-NMR spectrum is integrated in segments according to the unit segment integration interval (Buckets) of 0.005ppm to reduce the number of data points and remove the residual water peak signal area (4.5-5.0ppm). The PQN (Probability Quotient Normalization) method is adopted for the residual integral 1 The total spectral region of H-NMR was normalized to increase the comparability of data. Befor...
PUM
 Abstract
Description
Claims
Application Information
 - R&D
- Intellectual Property
- Life Sciences
- Materials
- Tech Scout
- Unparalleled Data Quality
- Higher Quality Content
- 60% Fewer Hallucinations
Browse by: Latest US Patents, China's latest patents, Technical Efficacy Thesaurus, Application Domain, Technology Topic, Popular Technical Reports.
© 2025 PatSnap. All rights reserved.Legal|Privacy policy|Modern Slavery Act Transparency Statement|Sitemap|About US| Contact US: help@patsnap.com


