Nucleic acid aptamer of cortisol, and gold-colloidal test strip used for detecting cortisol
A nucleic acid aptamer, gold-labeled test paper technology, applied in measurement devices, instruments, scientific instruments, etc., can solve the problems of expensive instruments, time-consuming, complicated processes, etc., and achieve a simple detection method, a wide range of applications, and good stability. Effect
- Summary
- Abstract
- Description
- Claims
- Application Information
AI Technical Summary
Problems solved by technology
Method used
Image
Examples
Embodiment 1
[0030] (1) Synthesis of nucleic acid aptamers and complementary probes
[0031] Synthesis of thiol-modified aptamers at the 5' end:
[0032]5'-SH-GCAGAGGATCATGATGCGGGGTGGAGAATGGGCCGCACTTCGGCTTCACTCTTGGCAGAAAAGCTT-3';
[0033] Synthesis of complementary probe A modified with biotin at the 5' end:
[0034] 5'-biotin-AAGCTTTTCTGCCAAGAGTGAAGCCGAAGT-3'.
[0035] The following are the nucleic acid aptamers and corresponding probes used in the comparison test:
[0036] Synthesis of thiol-modified aptamers at the 5' end for comparison:
[0037] 5'-SH-CAACGAGTCACTGTTTCTGGGTGGAGAATGGGCCGCACTTCGGCTTCACAACGAGTCACTGTTTCT-3';
[0038] Complementary probes synthesized with biotin-modified 5' ends of the alignment:
[0039] 5'-biotin-AGAAACAGTGACTCGTTGTGAAGCCGAAGT-3'.
[0040] (2) Preparation of colloidal gold solution
[0041] Mix 1 μL of 0.5M acetic acid buffer solution with a pH of 5.9 and 1.5 μL of 10 mM TCEP (tris(2-carboxyethyl)phosphine) solution, and then add 9 μL of 100 μM sul...
Embodiment 2
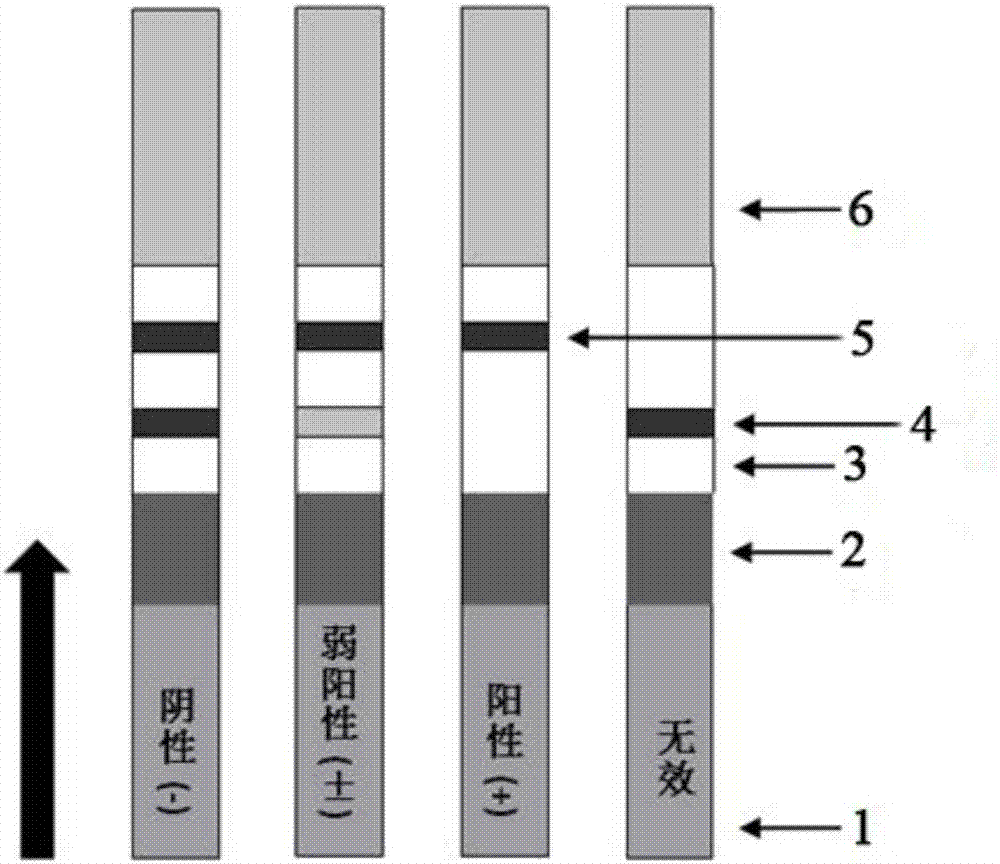
[0056] Gold standard test strips were prepared and used according to the method described in Example 1. Take saliva samples containing 0nM, 10nM, 15nM, 20nM, 50nM cortisol respectively for detection, and the detection results are as follows: Figure 4 As shown on the left side of A, the T-line color development is from strong to weak, and the detection concentration range is 0 to 50nM; urine samples containing 0nM, 50nM, 100nM, 150nM, and 200nM cortisol were taken for detection, and the detection results are as follows Figure 4 As shown on the right side of A, the T-line color development ranges from strong to weak, and the detection concentration range: 0-200nM.
[0057] Figure 4 B is the result of the comparison test (using the comparison nucleic acid aptamer and the comparison probe in Example 1), get the saliva samples containing respectively 0nM, 10nM, 15nM, 20nM, 50nM cortisol for detection, and the detection results are as follows Figure 4 As shown on the left side...
PUM
| Property | Measurement | Unit |
|---|---|---|
| length | aaaaa | aaaaa |
| particle diameter | aaaaa | aaaaa |
| length | aaaaa | aaaaa |
Abstract
Description
Claims
Application Information
 - R&D
- Intellectual Property
- Life Sciences
- Materials
- Tech Scout
- Unparalleled Data Quality
- Higher Quality Content
- 60% Fewer Hallucinations
Browse by: Latest US Patents, China's latest patents, Technical Efficacy Thesaurus, Application Domain, Technology Topic, Popular Technical Reports.
© 2025 PatSnap. All rights reserved.Legal|Privacy policy|Modern Slavery Act Transparency Statement|Sitemap|About US| Contact US: help@patsnap.com


