On the other hand, most weekly home and garden programs don't present any advertising or commercial promotions for alcoholic beverages.
While this goal is easy to quantify, it is not so easy to achieve and many advertising campaigns are simply ineffective.
There is no way to effectively gather feedback for an advertising campaign and to accurately measure or evaluate the performance of the advertising effort.
One of the main problems with the currently used models and techniques for identifying and implementing the most optimal advertising campaign for a given product using a given advertising medium is the lack of effective tools for scoring, evaluating, and comparing alternative advertising strategies.
There is no well known, acceptable technique or method for evaluating, scoring, and comparing one advertising plan or schedule and strategy with another.
As further described below, this deficiency reduces the advertising optimization process to a series of estimates and educated guesses when determining which campaign, from among a group of similar campaigns, will be most successful in accomplishing the desired goals.
Another problem with developing effective media advertising campaigns is directly related to the technology limitations of presently implemented systems.
Using the currently-available systems and methods to manipulate and analyze the huge amounts of data that are available to decision-makers can take days or even weeks to accomplish.
In addition, the lack of sophisticated advertising optimization tools impose artificial limits on advertising agencies and media planners that are actively involved in the decision-making process.
There are, at present, no broad-
ranging interactive methods or tools available to the media planner for optimizing an advertising campaign in real time.
Many media planners have the data available to make strategic decisions regarding advertising, but the available planning tools do not allow rapid and easy access to the data in an intuitive, interactive environment.
Specifically, known systems focus only on "effective reach" and do not allow rapid week-to-week analysis of a unified sample.
Because of these factors, many media planners are relatively ineffective in preparing valuable advertising strategies until they have several years of experience.
Another significant drawback of the systems and methods presently used to analyze television audience viewing data is
limited access.
Many analysis and decision support systems available today are large, expensive computer systems that many smaller companies cannot afford to purchase.
Given
limited access to necessary resources, many companies are forced to pay high-priced consultants to analyze the relevant data and to provide access to the desired information.
This further limits the value of the available data for companies without the financial resources to engage consultants or purchase expensive equipment.
Without a more effective
system for scoring, comparing and optimizing advertising campaigns for specific needs, advertising agencies, networks, businesses, and other interested organizations will continue to be limited in their efforts to produce effective advertising campaigns.
The result will undoubtedly be less than optimal use of scarce advertising dollars and an unnecessary loss in revenue for everyone that relies on the presently available systems / methods for analysis and decision-making purposes.
This means that previously complex and lengthy
information retrieval and analysis activities can be accomplished in very short periods of time (typically seconds instead of minutes or even hours).
However, for various reasons such as
relocation, death, and unreliability, households will often remain in the sample for only a few weeks or months.
This means that the television viewing data for a particular household or member for that day are not reliable for
estimation and reporting purposes.
Therefore, the viewing history for household visitors cannot be accurately tracked from one day or week to the next.
As previously mentioned, although this very significant body of data are available for use by businesses and organizations that hope to benefit by analyzing it, the limitations of the present
analysis tools and techniques have been too cumbersome to overcome.
The two main factors which in the past have made the Nielsen person-by-person data difficult to work with are the tradeoff between
database size and
system performance, and the problems associated with the unification of the sample data.
In addition, several other difficulties with accessing and analyzing the Nielsen data have been noted.
Patterns of program and network loyalty, for example, cannot be effectively analyzed without a large quantity of data which spans periods that are at least as long as the time required to established these patterns.
As the size of the person-by-person database increases, system-level
processing constraints and limitations become a significant concern.
These researchers have invariably noted the difficulties that they have encountered with the sheer size and cumbersome nature of the data.
However, even these special studies still generally span a limited number of weeks of data, require the use of the substantial computing resources available to Nielsen, and may require several weeks of
calendar time to generate the results.
Other problems related to the size of the Nielsen data files are particularly troublesome for organizations with multiple geographic locations that need to access the Nielsen data files.
Weekly updates to each database with 35 Mbytes of data would become prohibitively difficult.
In addition, if such a data service became widely popular, the task of delivering and installing data for numerous clients using conventional database management systems would also become unreasonably difficult for a data vendor using existing technology.
Yet another problem becomes apparent when using the Nielsen data for demographic studies and analysis.
But to do so with sufficient speed to allow interactive browsing is not possible at the
current time with widely available computer systems and traditional DBMS
software.
The data sets are simply too large and the queries too complex.
Finally, the
physical structure of the records in the Nielsen data files can also introduce unnecessary complexity into the analysis process.
This is simply because the various relational and hierarchical database models in use today are too unwieldy for manipulating large data files with any significant speed, absent very specialized and expensive
computer hardware.
Using most standard computers, the performance of a
general purpose DBMS will typically be inadequate for
interactive analysis when manipulating the hundreds of Mbytes of data that comprise the Nielsen data.
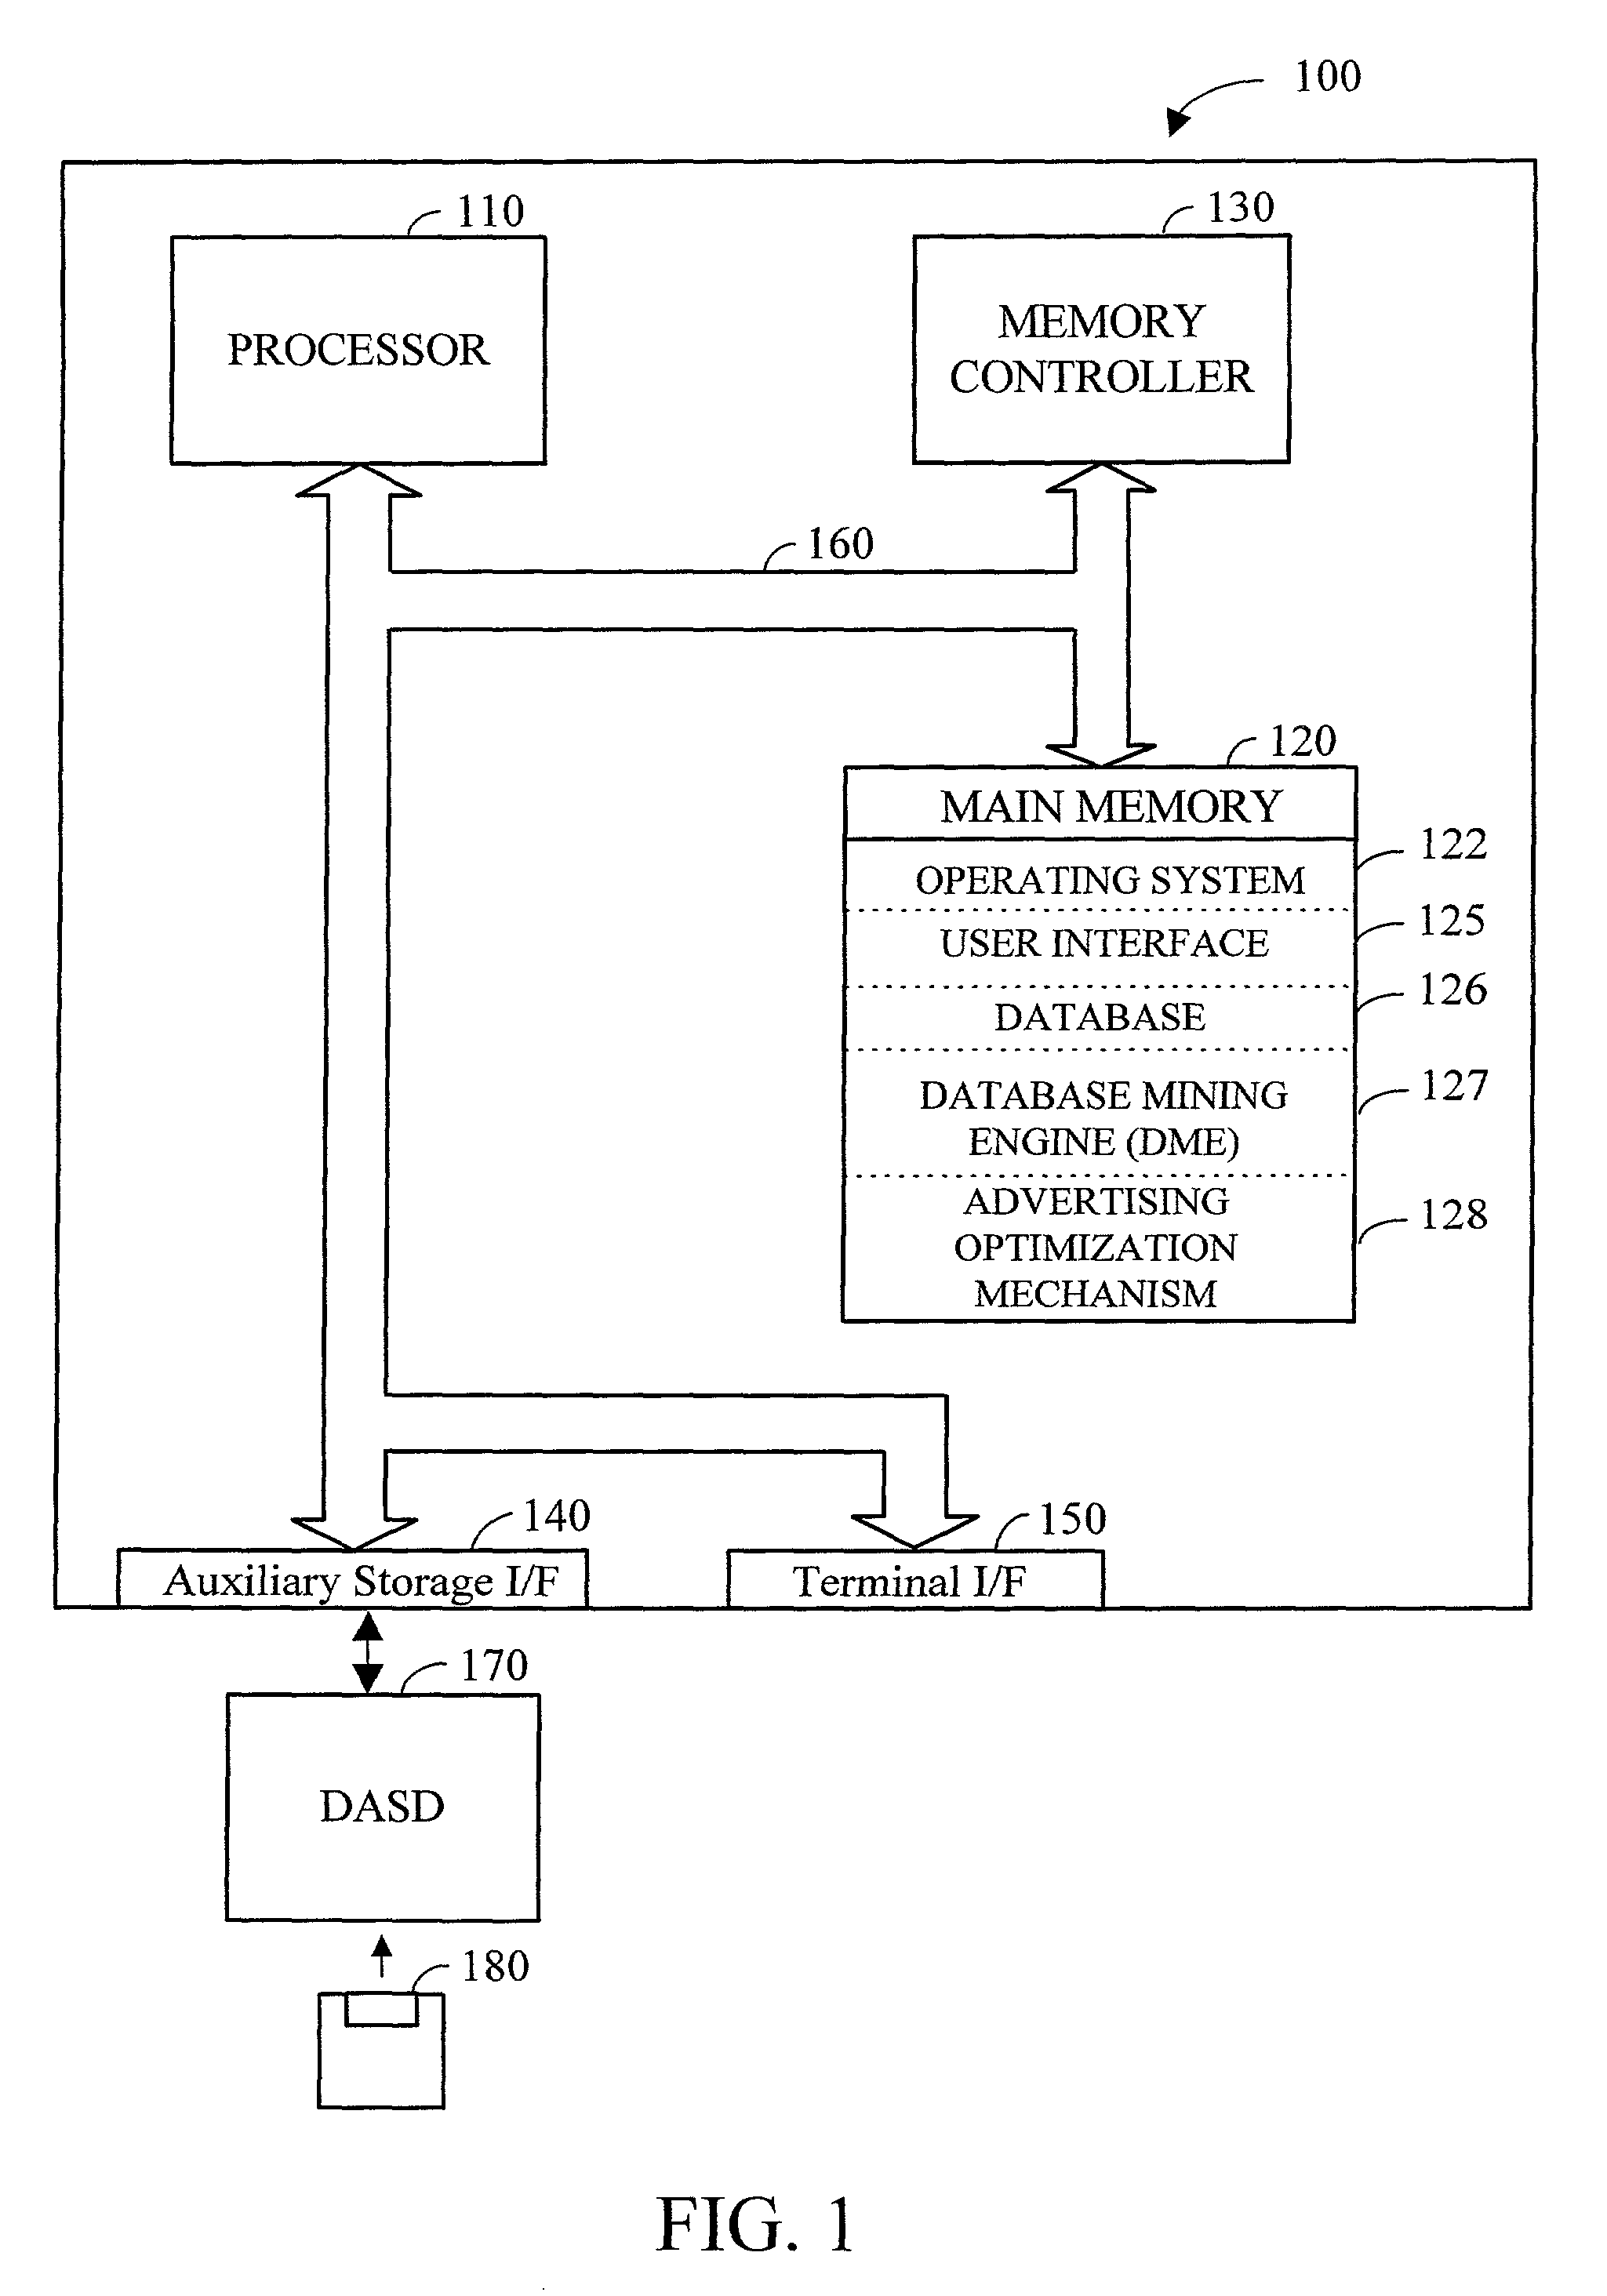
Although the data received from Nielsen is very valuable for analysis and advertising purposes, the format of the data does not readily lend itself to quick and efficient manipulation.
This type of
data retrieval is not possible using conventional database systems because the binary representation of the data in a typical database is typically not the same as the data in memory 120.
The design of DME database 126 does not provide the
data type independence of many commercially available database management systems in which the representation of the data in the database is independent of the representation of the data in memory.
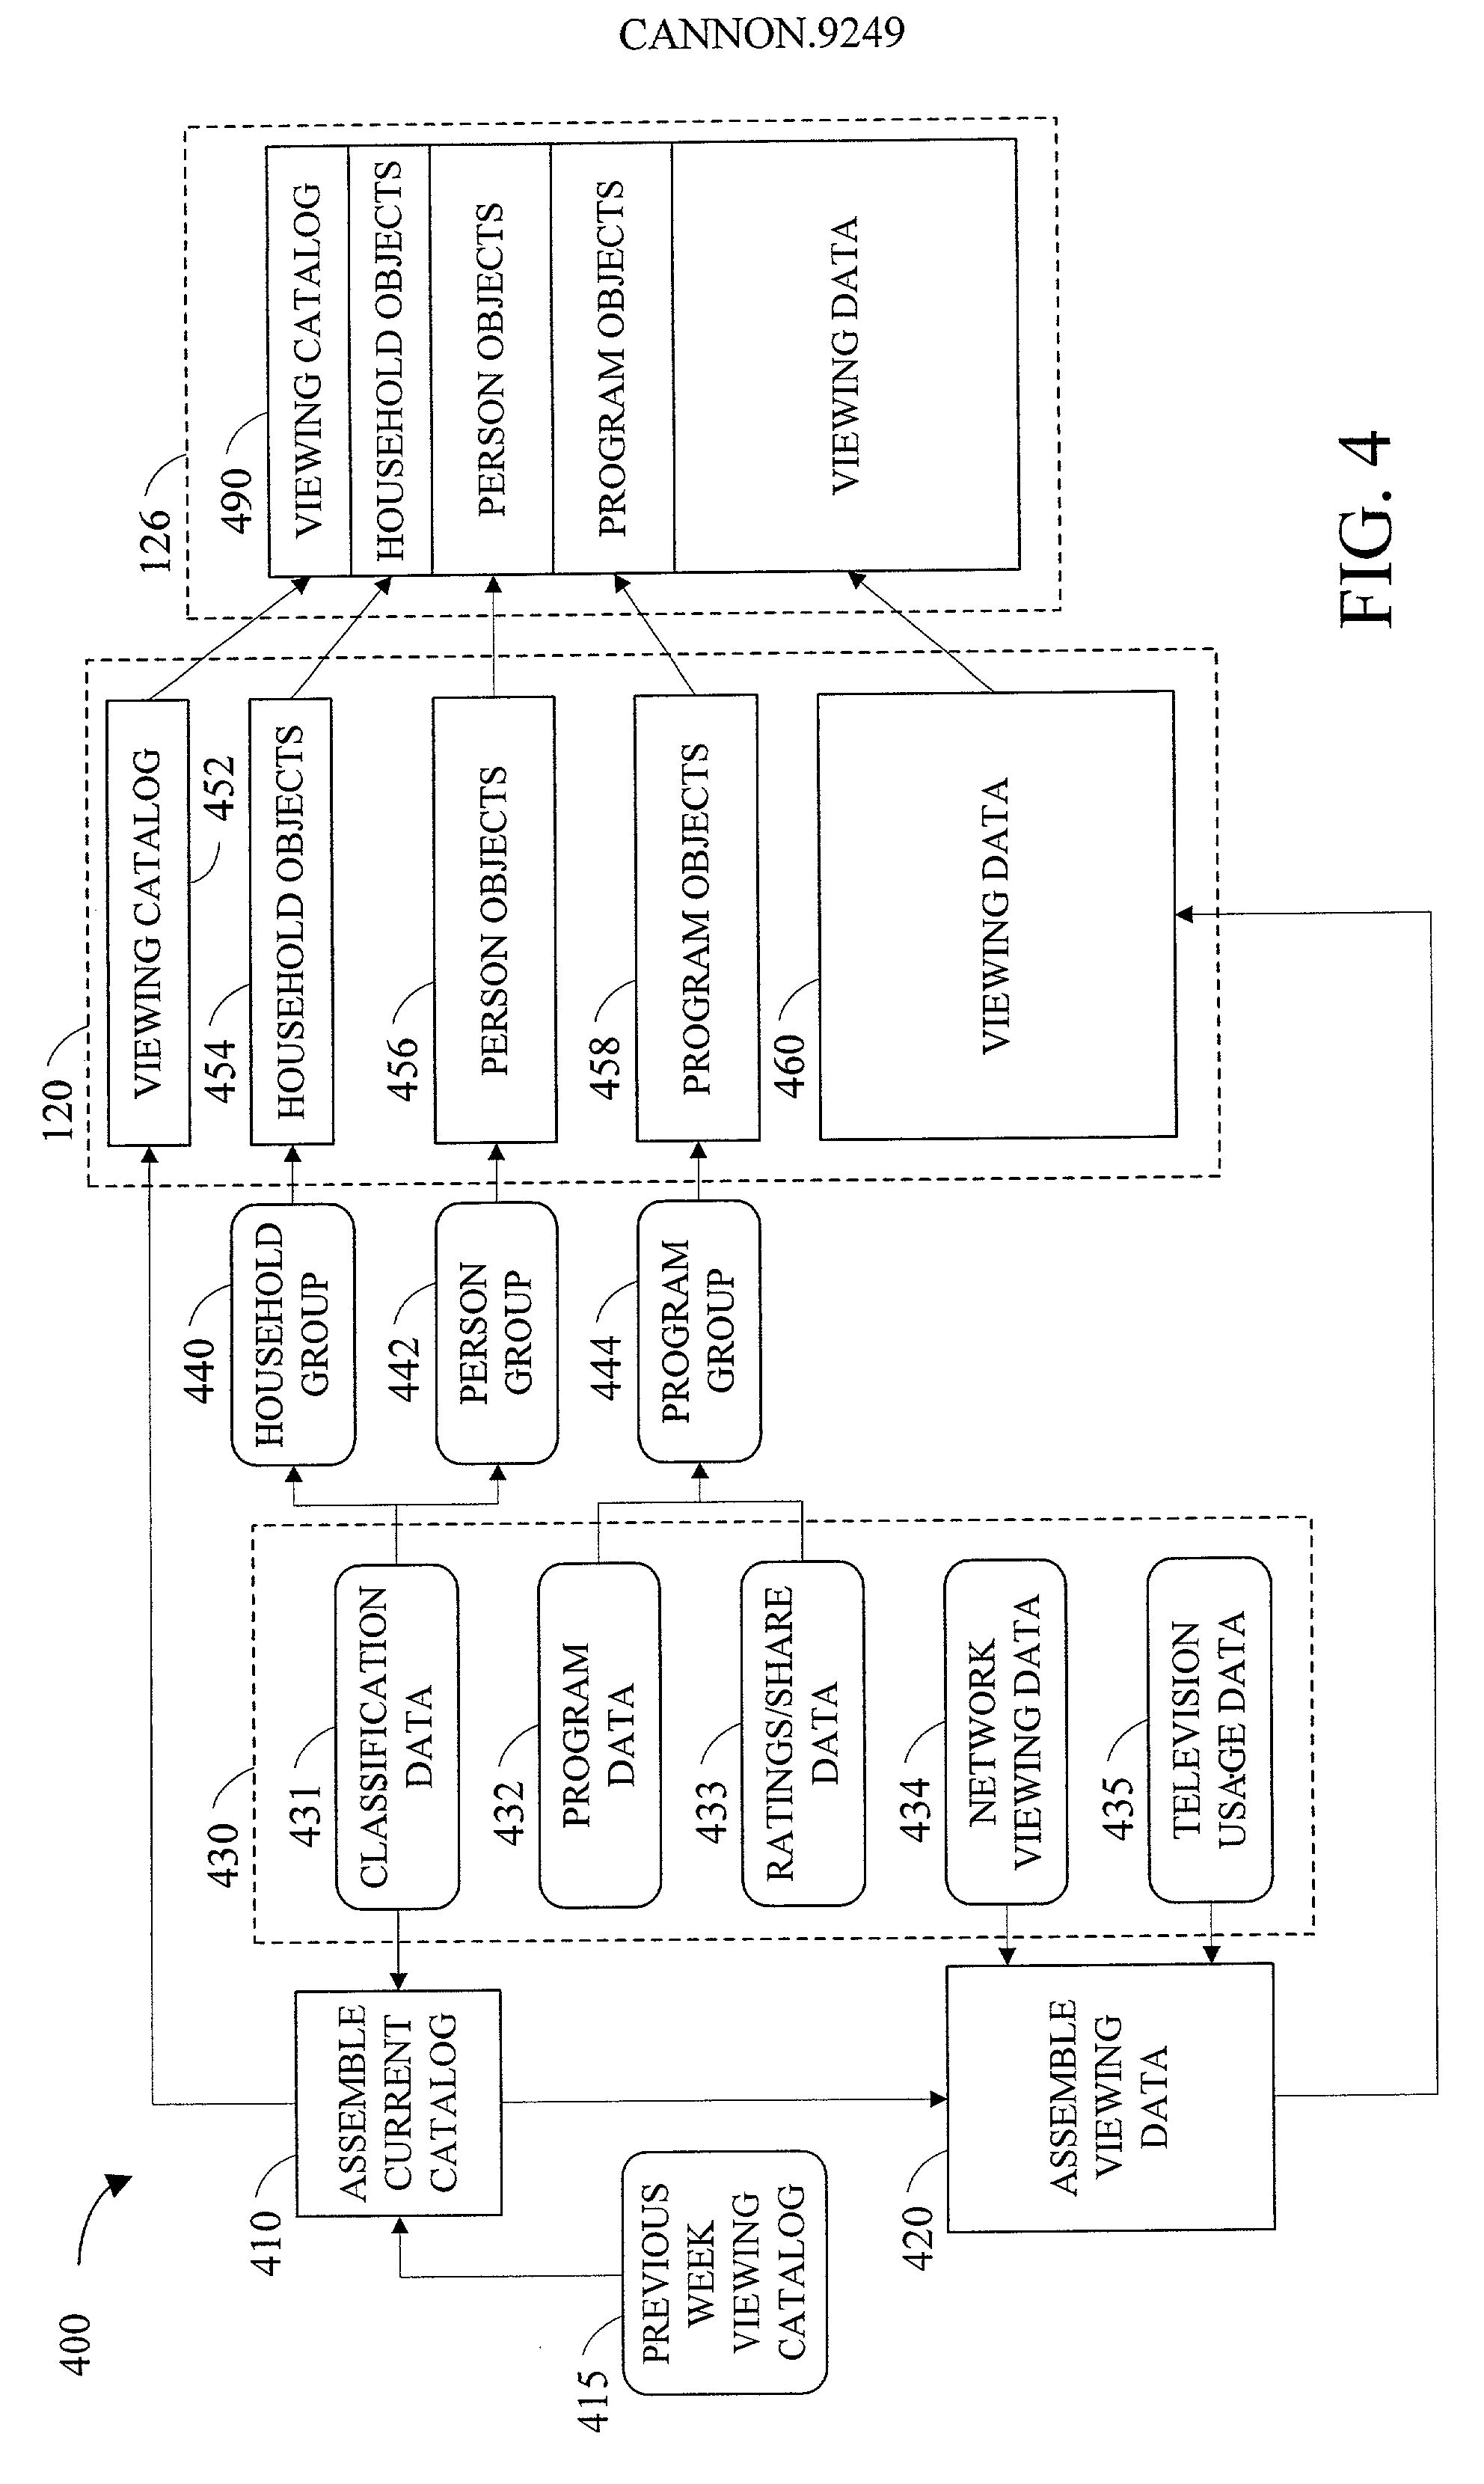
It is important to note that this technique of assigning non-network viewing to those individuals who are viewing television but not viewing network
programming will result in occasional over-counting of non-network program viewing.
This type of graphical presentation for media-related data is not readily available for general use in the market today.
A significant challenge in media advertising is to identify optimal compromises in satisfying simultaneous but sometimes conflicting advertising objectives.
The range and volume of data available to a media planner that can be used to develop an advertising plan can be formidable.
The challenge however, is to systematically use all of these data in guiding the development of a optimal plan.
Although scoring is not particularly complex mathematically, it is data and computation intensive, and requires access to large, person-by-person, media
exposure databases, such as the Nielsen data.
Without the methods of the present invention, however, there has been no systematic way of incorporating these beliefs into the
planning process.
Obviously, all other factors being equal, as the total cost of a given spot increases, the attractiveness of the spot to an advertiser declines.
It is possible, however, that based on the other four factors introduced in this section, an inexpensive spot might not be worth the cost to a particular advertiser while a relatively expensive one might be.
Conversely, some advertisers might be committing to relatively expensive spots that have less value than more plentiful and less expensive alternatives.
Finally, as would be expected, the cost of advertising on this relatively more desirable program is higher than average when compared to other, less desirable programs.
Although this process can obviously be performed by hand, it would be an extremely tedious and error-prone process.
Although advertisers pay standard rates for audience exposures, measured in cost per thousand (CPM), exposures are not of equal value to advertisers.
For example, a person who sees the advertisement for the first time may not fully understand what is being advertised.
The simple techniques are easy to use, and require very little data, but may not fully describe the influence of multiple advertising exposures on particular audiences.
Most known optimization methods suffer from this tradeoff.
This results in increasing frequency for those individual who are exposed, but has only a limited effect on reach.
While adequate in some circumstances, there are two limitations to using an average frequency approach to specify the objectives of an advertising campaign.
The other limitation of average frequency for optimization purposes lies in the potential for having
exposure timing patterns at an
individual level which are not optimal.
Average frequency, taken by itself, does not provide sufficient information to determine how well specific advertising plans are meeting objectives.
Unfortunately, most presently known optimization techniques rely heavily on average frequency to determine the most optimal plan or schedule.
The practice of using
effective frequency to specify the objectives of an advertising campaign suffers from the same problems that average frequency does.
While the relative values of alternative changes in an advertising plan or schedule can be compared, there is no way to compute the absolute value of an advertising plan or schedule or a change in a plan or schedule.
These media plans assume that if individual audience members are exposed to fewer advertisements than this critical number during a given period of time, then it is likely that the message will not be well enough understood or sufficiently motivating to result in any change in
purchasing decisions.
This critical number of exposures has also been the subject of much debate.
According to Krugman, with fewer than three exposures, people will not yet be sufficiently aware or informed of the product to consider making a change in their buying decisions.
But no campaign is ideal.
If, however, one spot were to be added to our base campaign, and if spots A and B are the only two spots available, then adding spot B would be the optimum solution, even though it is not an
ideal solution.
As discussed above, is has been observed that modifications to an advertising plan or schedule to increase either reach or frequency is often at the expense of the other.
In addition, because of the limitations associated with reach, the underlying wisdom of using reach as a measure for the value of an advertising campaign has been questioned.
Optimizing an advertising plan or schedule to achieve this objective is not possible with any known techniques.
The first time people are exposed to advertising, their ability to recall is less than perfect.
Modifying an advertising plan or schedule to more evenly distribute advertisements may not improve the overall effectiveness or value of the plan or schedule if the individual exposures do not become more evenly distributed as a result of the modification.
It is possible that a plan or schedule could be evenly distributed over time, but still have an overall uneven distribution of
exposure because of uneven distribution of exposure by various categories of audience members.

